
Monday 7 September
Starting the week’s plan with a quick review of currently opened trades.
Open Trades
Foschini Group
The trade is currently in the red, I entered on a bullish divergence
Firstrand group
The trade is currently in some small green, it was on a bearing flag
Pending trades
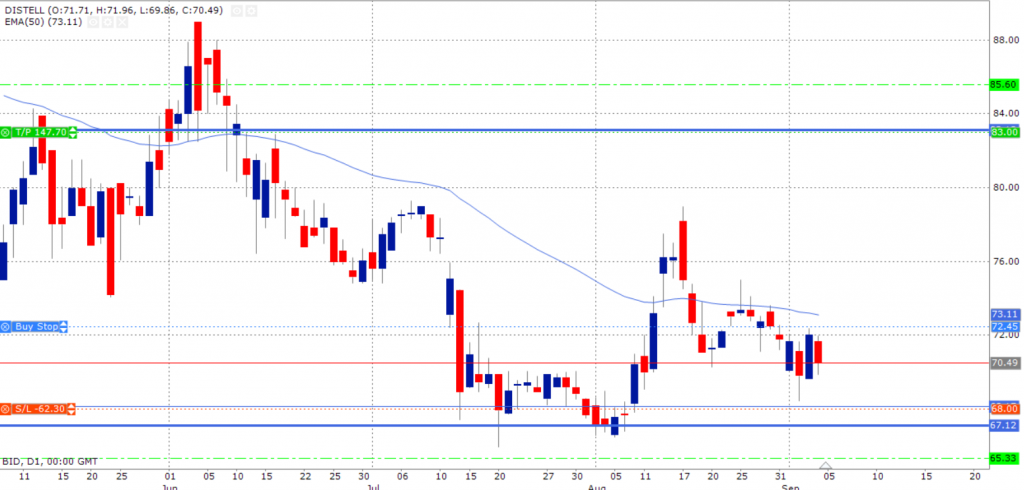
Distell
On 3 September 2020, we had a bullish engulfing candle on the Distell share. This triggered a buy signal. Perhaps Distell may start to recover from the lockdown and lack of sales (Not trading the news but the tape)
I needed the price to trade above the high of the trigger candle (Engulfing) candle for the confirmation. The share hasn’t done so. I place a buy stop order and waiting to take me in the trade by the market.
Triggered and potential trades
Tiger brands
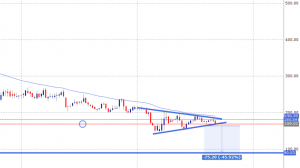
We have a nice bearish triangle pattern. I’m waiting for the break to the downside on the continuation of the trend. I will enter on the break and close below the support of the triangle.
My stop will be at around 190 levels, and my target is around 90 ( height of the triangle projected downwards.
DRD Gold
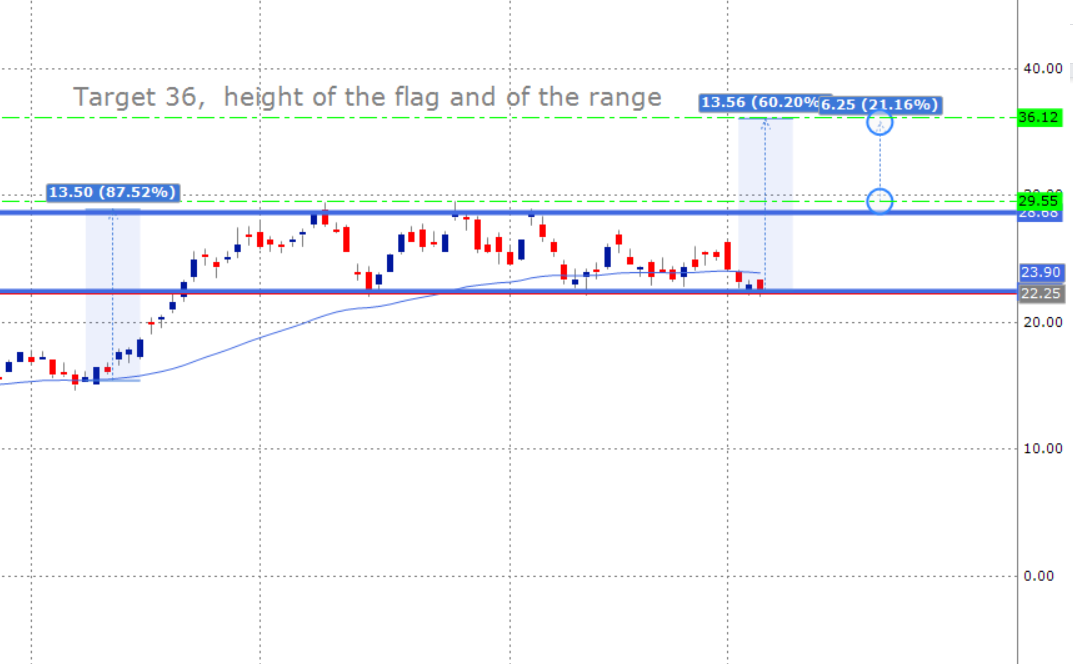
Gold stocks have been rallying alongside the gold. Most have subsequently consolidated. DRD Gold is no exception.
We have a rectangle bullish flag on DRD. Its been consolidating for a couple of months now.
I have my resistance level of the flag at R28.68. I’m looking for a 3% break and close (above 29.55) levels. Looking for a long trade targeting R36 (Height of the triangle)
Closed trades
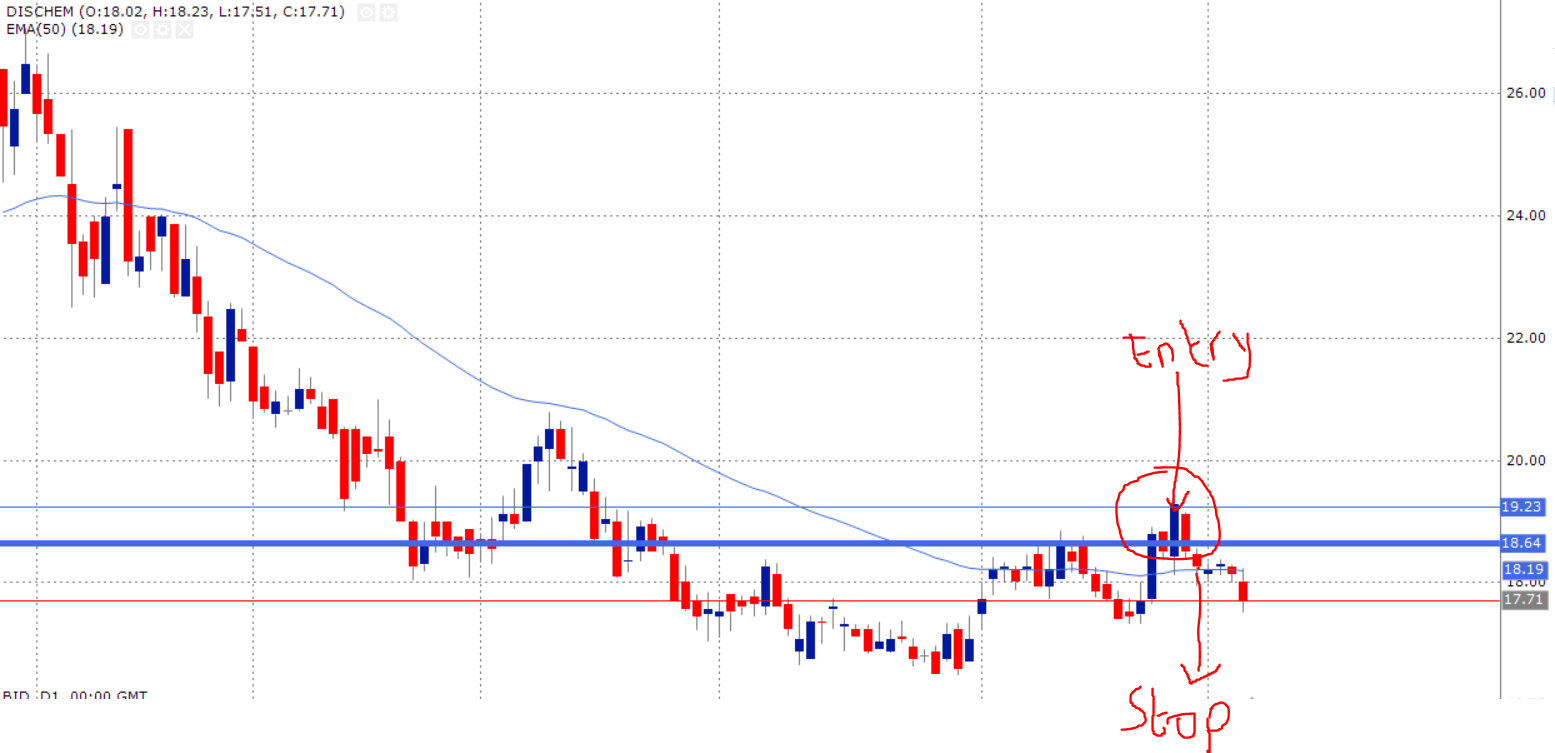
Dischem
I went long on Dischem on 28 August 2020, on a breakout. I got stopped at the original stop loss
I was stopped out at a loss. In hindsight, Dischem was clearly on a downtrend, and I took a long positing on the breakout. And the share was training below its 50-week moving average as well. I will monitor this in the future. I neglected the fundamental aspect of trading (follow the trend).
I believe everything else about the trade was as per my plan. My take away from this trade. Is the importance of looking at the weekly chart before making decisions on a daily chart.
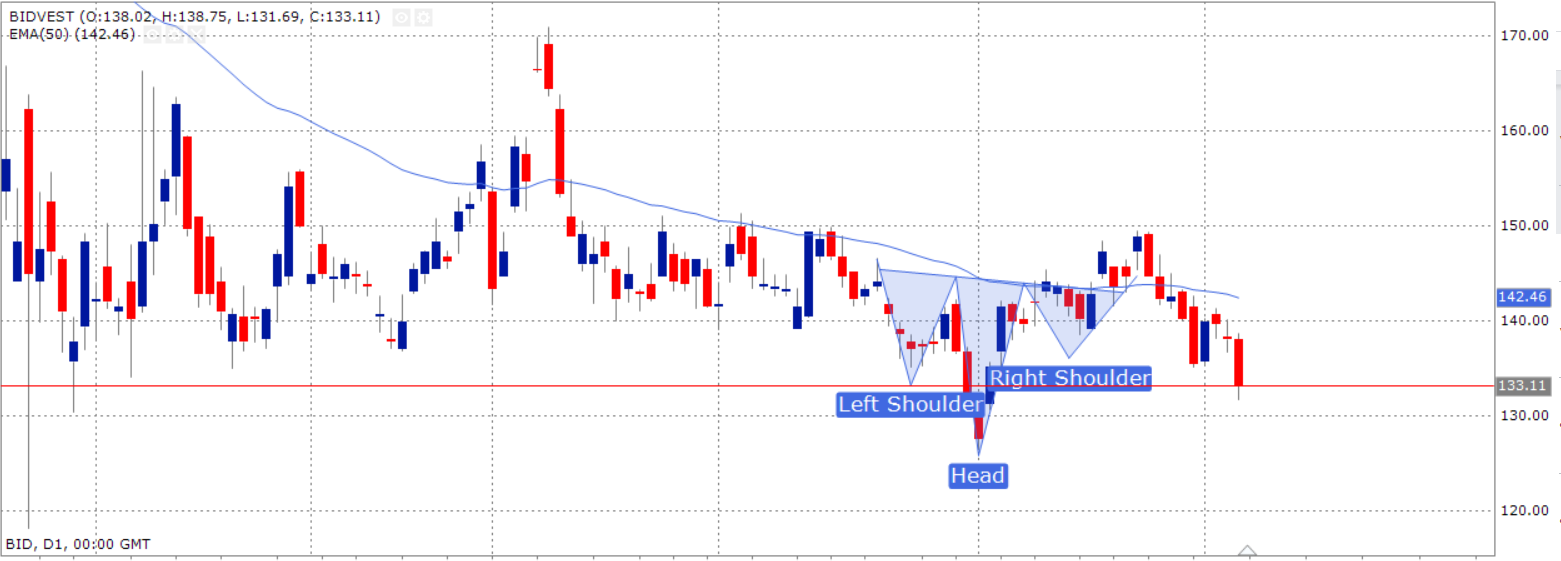
Bidvest
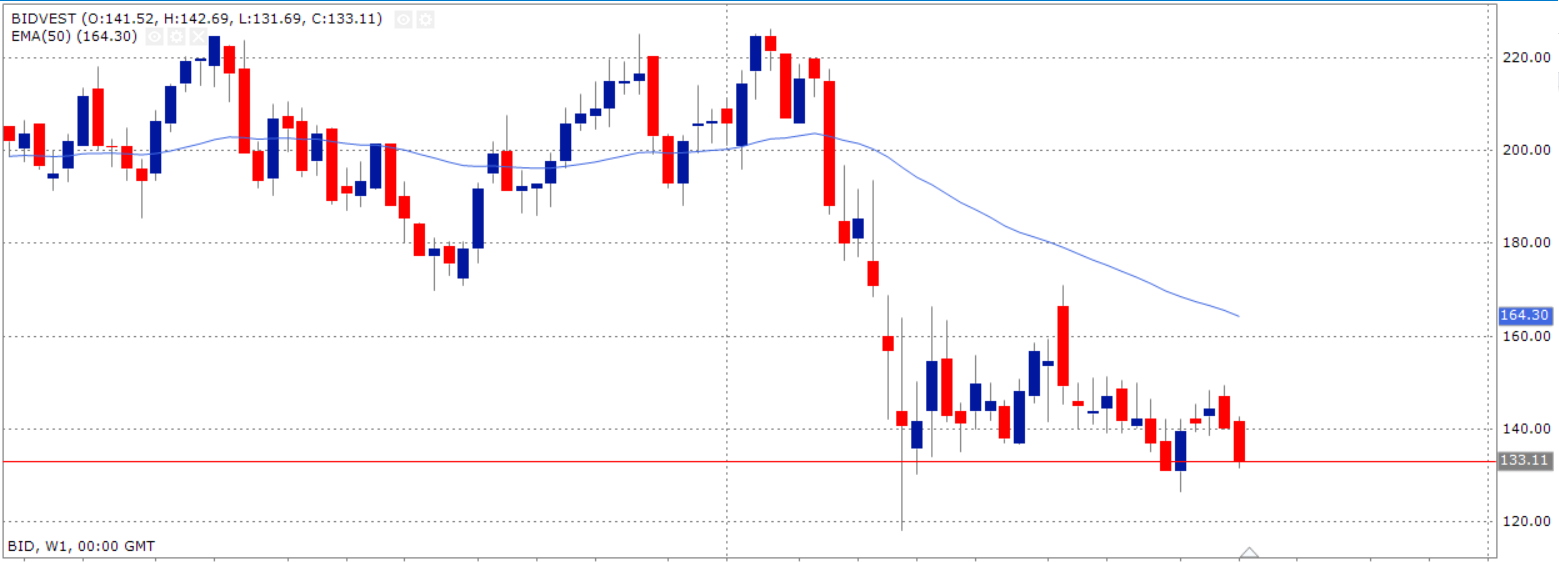
I went long Bidvest on 24 August 2020. I entered the trade on a head and shoulders pattern. A traditional reversal pattern. I got stopped at my original stop loss. In hindsight, I was trading against the trend. As the share had been trading below its 50 Week moving average.
Weekly chart
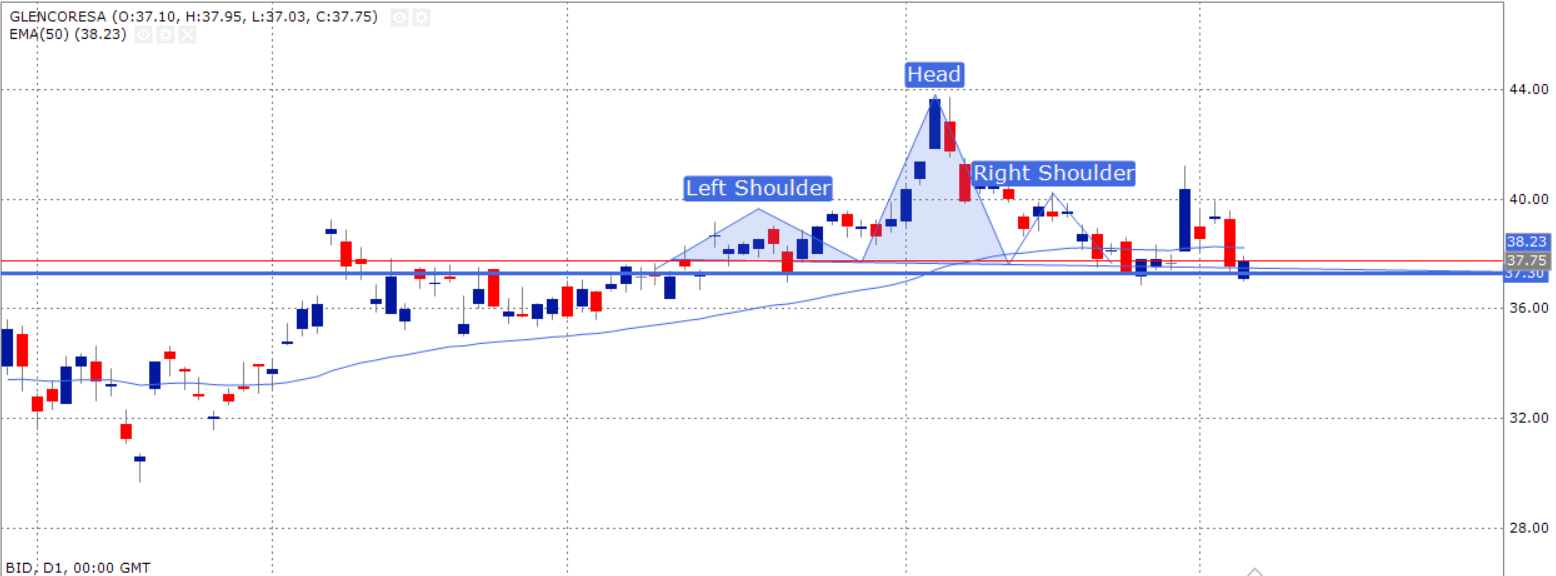
Glencore
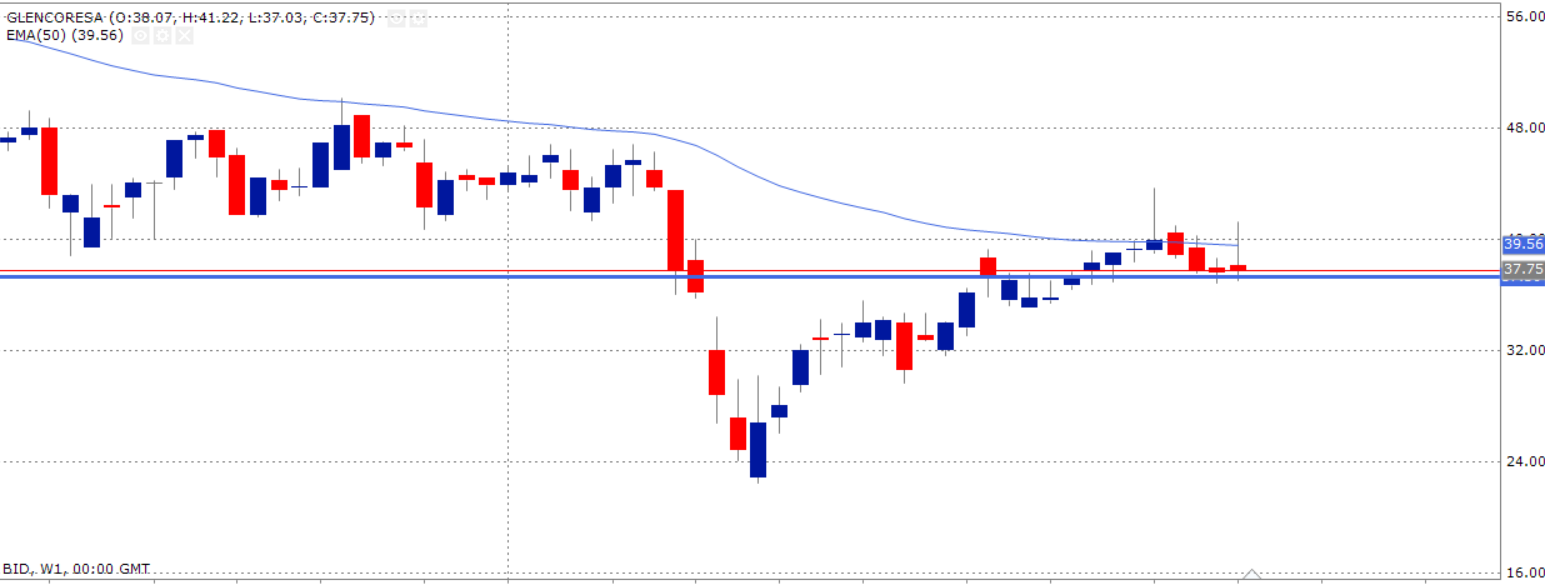
I went short on Glencore on 21 August 2020. I was stopped out at my original stop loss. On the weekly chart the price was making higher lows but trading below the 50-week moving average. I think it’s just one of those mises perhaps I had too tight a stop, I don’t necessarily believe so though. The share has restest the 50-week moving average but failed to violate it. A short trade still interests me, on the break below the support. On the daily chart at 37. Looking a 3% break below
Weekly chart.
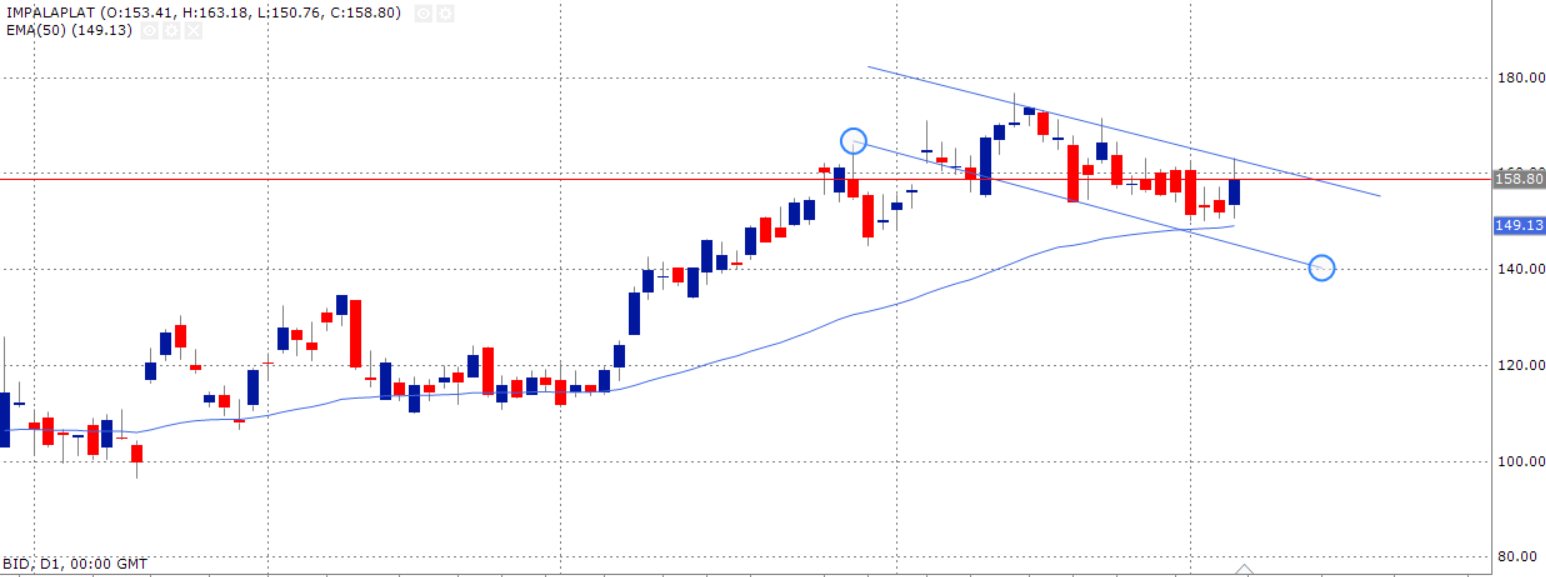
I went short on 18 August 2020. I was stopped after having pulled my stop closer to break even. It would seem perhaps I was too aggressive with adjusting my stop in this instance I used 2X ATR. I was counter-trend trading, I was calling a reversal based.
I made a call to trade the reversal, at share was trading at an extreme resistance level, and had a doji. Will continue to monitor if the uptrend continues or the resistance will hold ag
ain.
At the moment I have a bullish flag that interests me on the long side (in the direction of the trend) I will monitor the share.
I went short on the BHP trading essentially calling a top. With a Doji candle at the extreme resistance. I got stopped at 1R profit after puling my stop using 2X ATR twice. The share has since moved back in my direction with a gap. I am considering re-entering if the share trades below the low of the gapping candle by placing a sell stop order in the market. I will monitor the share in the coming week
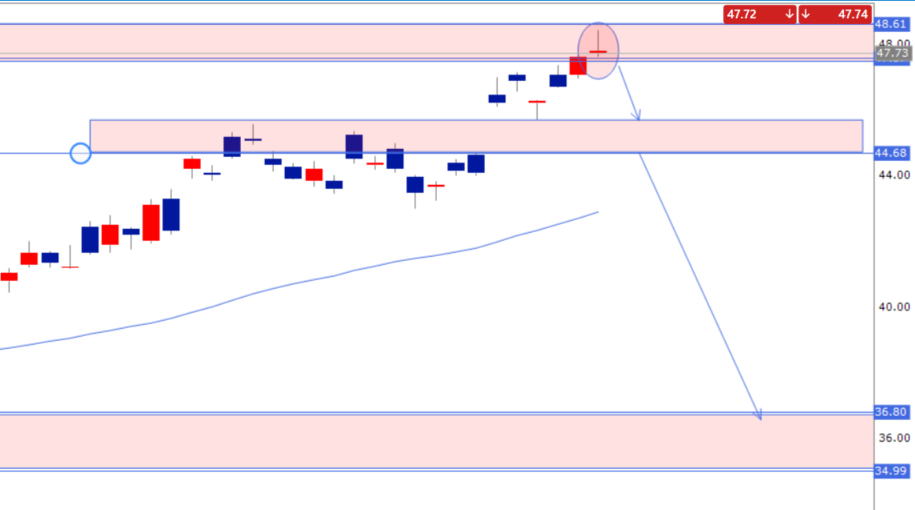
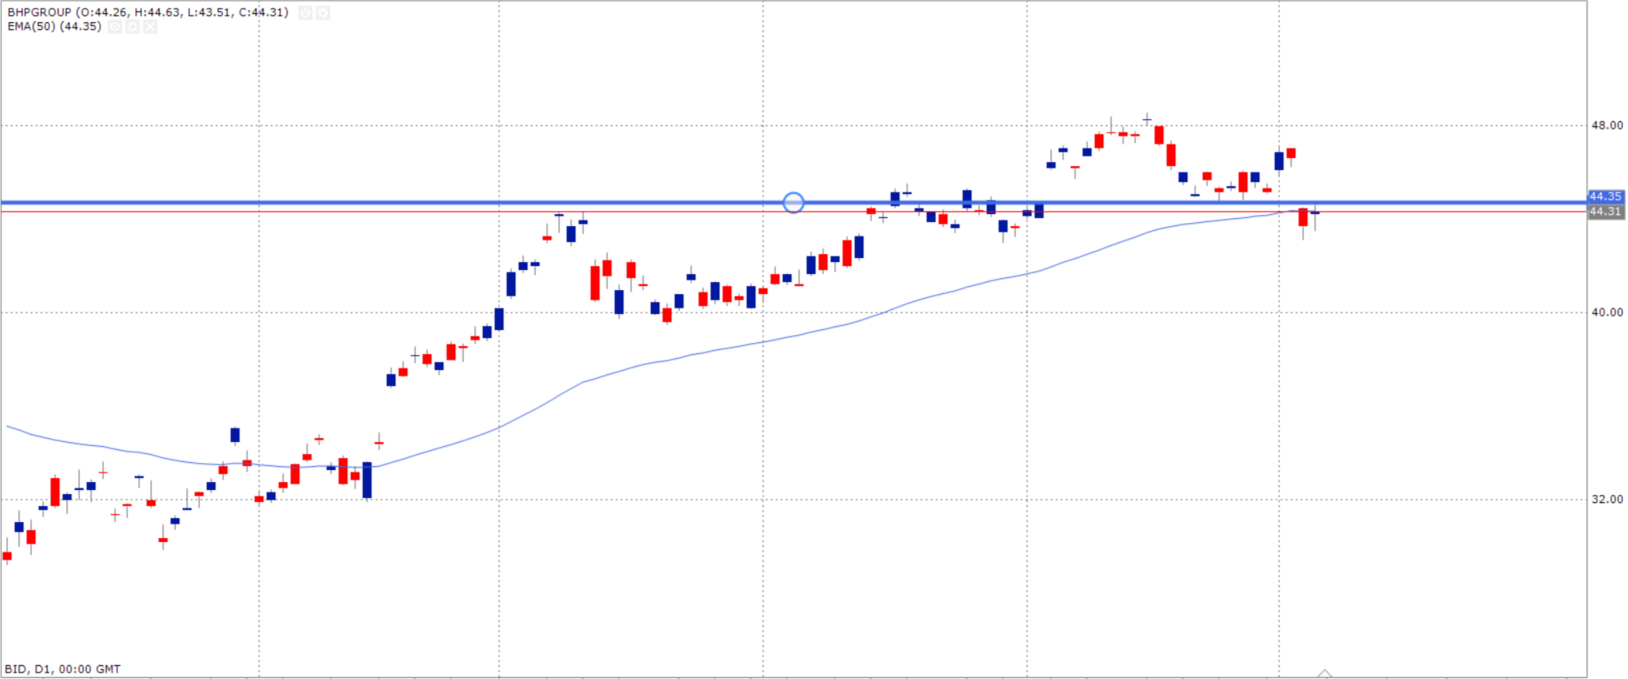
BHP has closed the gap with a gap to a level where I was going to take half my position out.
I will place a sell stop order below the low of the gapping candle and target the close of the second gap (My initial target).
Portfolio update
Current balance: (Margin): R2926.33
New capital: R2000
Current Equity: R2912.05
Paper P/L: -R14.28
VT portfolio unit value: R9.22 -0.48% from R9.26
Pingback: Village Trader Episode 17 with the Village Traders – Village Trader staging