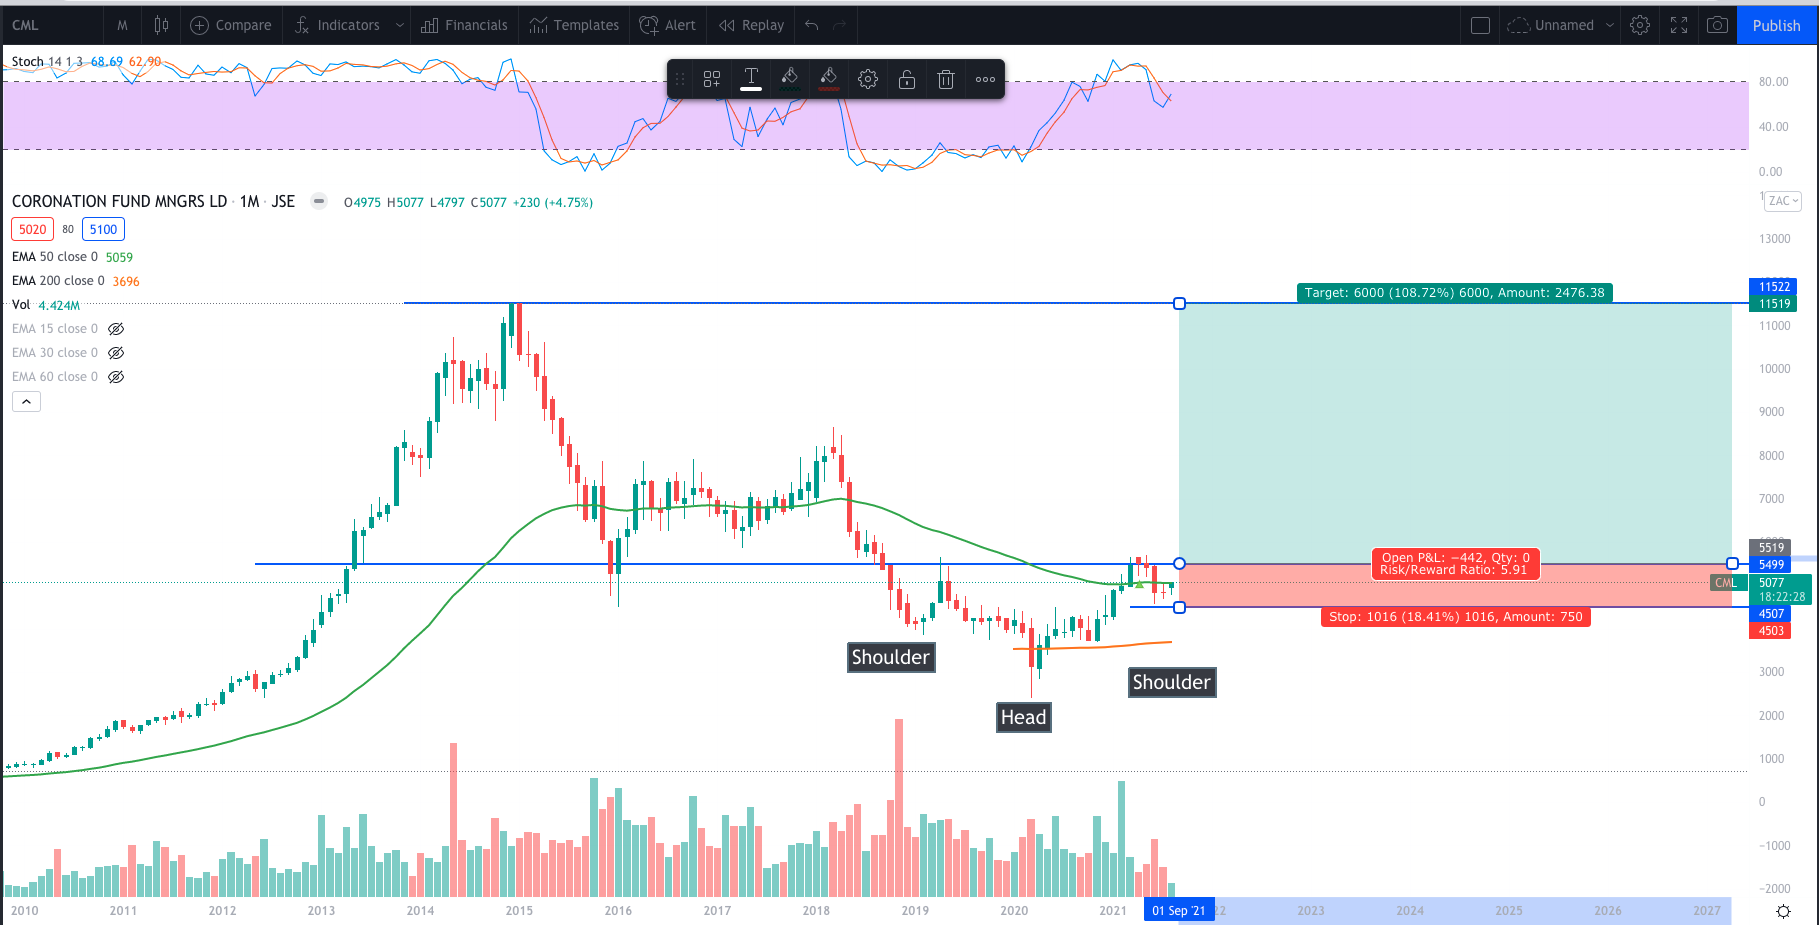
This is my kind of Dip to buy
We have an inverse head and shoulder pattern. The right shoulder holding the 50 month EMA. If the stock is to have a go at the R115 highs these levels are about where levels provide an interesting 5.9 risk:reward long term opportunity. If the stock takes out the R55 neckline. With a long term stop loss at around R45. This is mildly interesting let’s have a look.
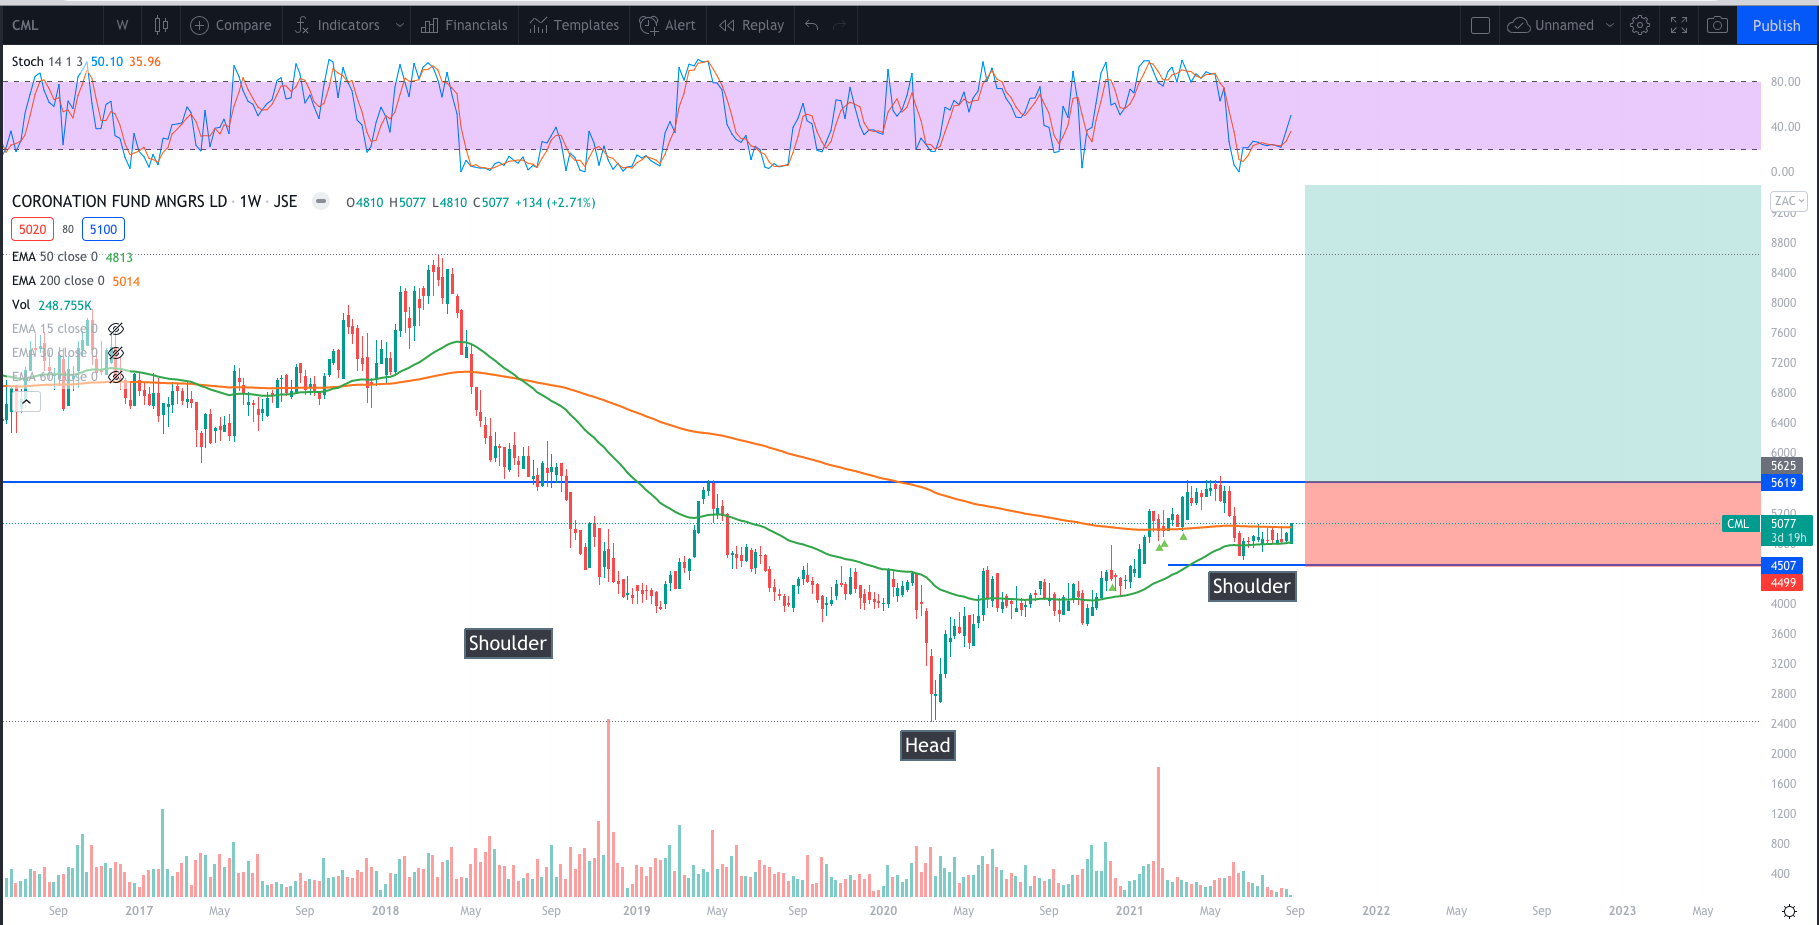
The weekly chart
Tug of war between buyers and sellers at around the 50 and 200 week EMAs. 50 week EMA quite close from triggering a golding cross.
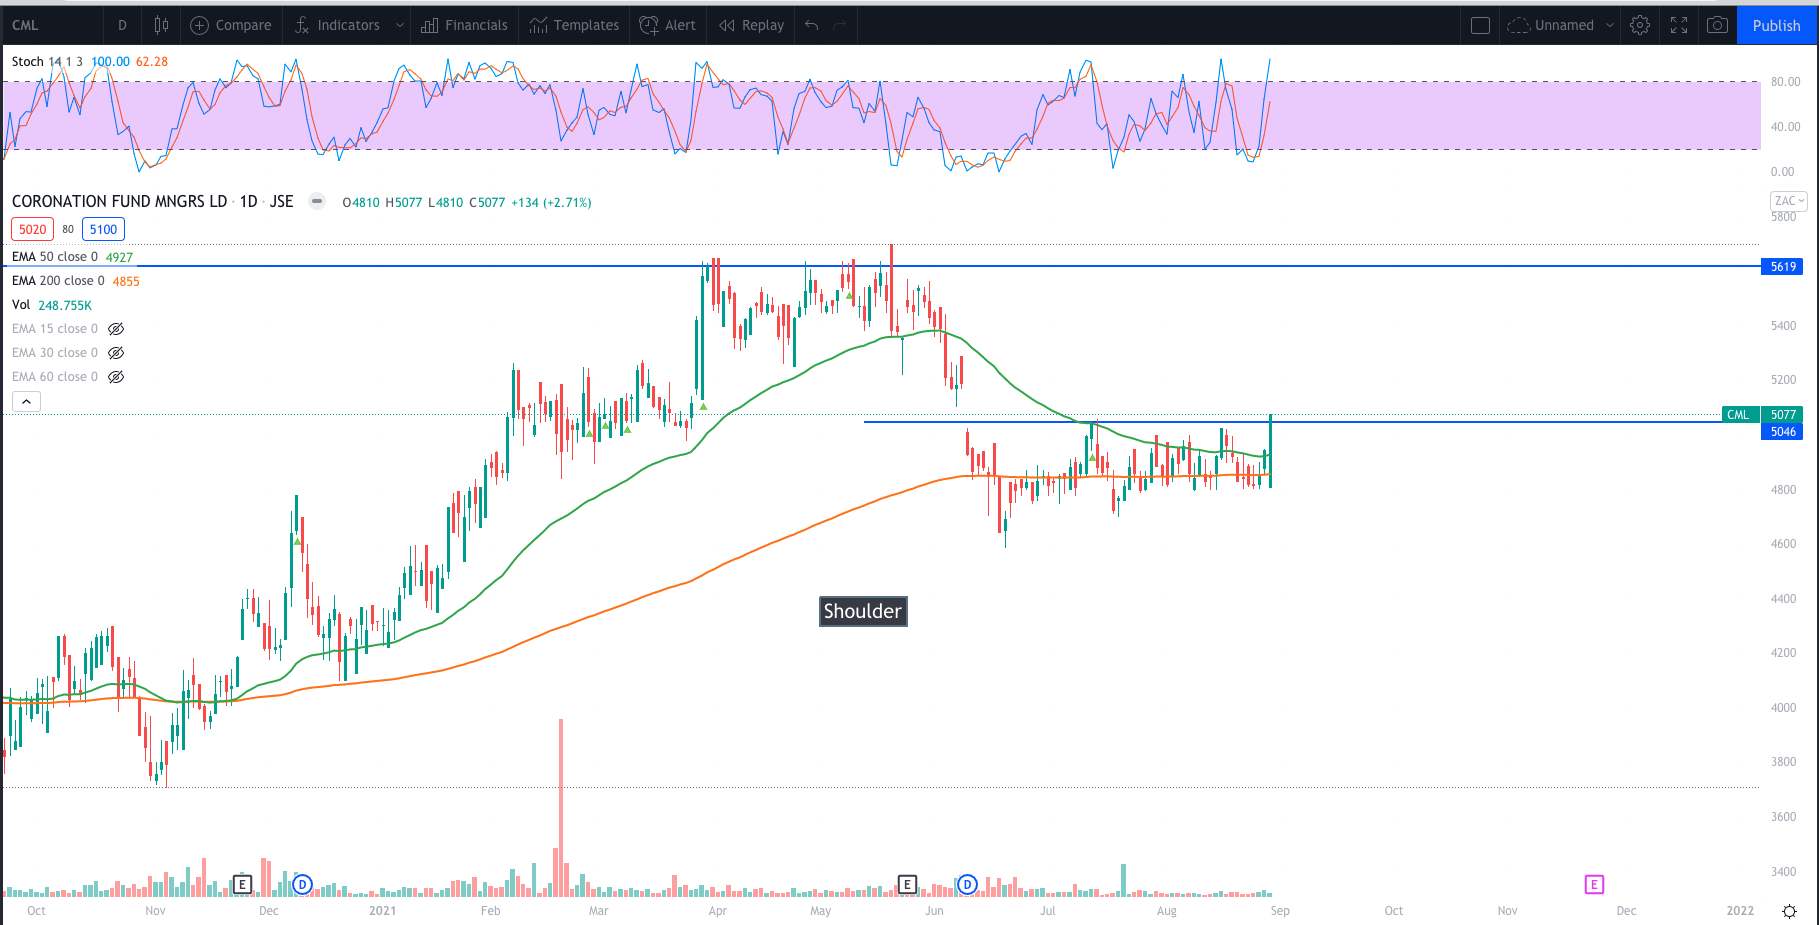
Let’s look at the daily chart to see who’s winning
The stock broke out of the “war’s” range with a bullish engulfing candle. Engulfing pretty much the entire range. Closing back above the 50 day EMA. On Monday 30 August 2021 Good time to start building a position with an anticipation of the head and shoulders trade. That provides a better risk reward opportunity of about 16. If the stock then closes above R55 then continue building the position.