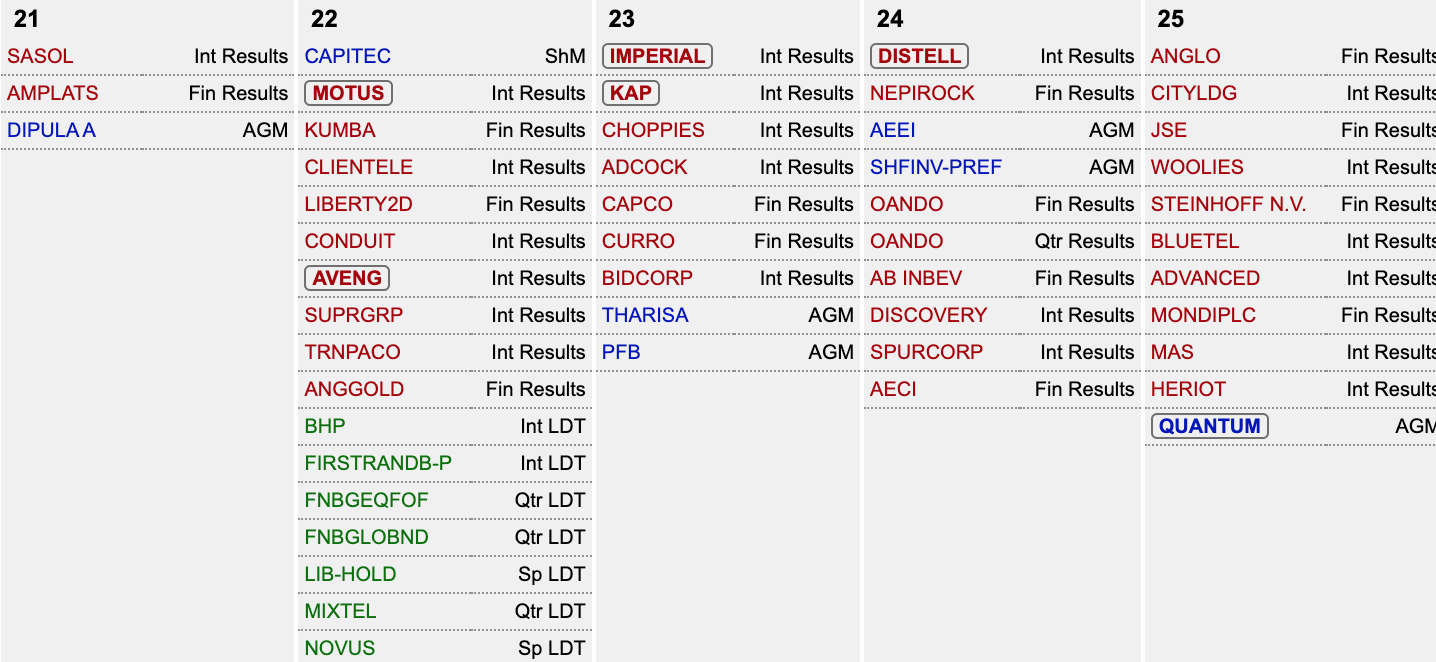
Market calendar
Let’s get into this week’s stocks in play
Resources
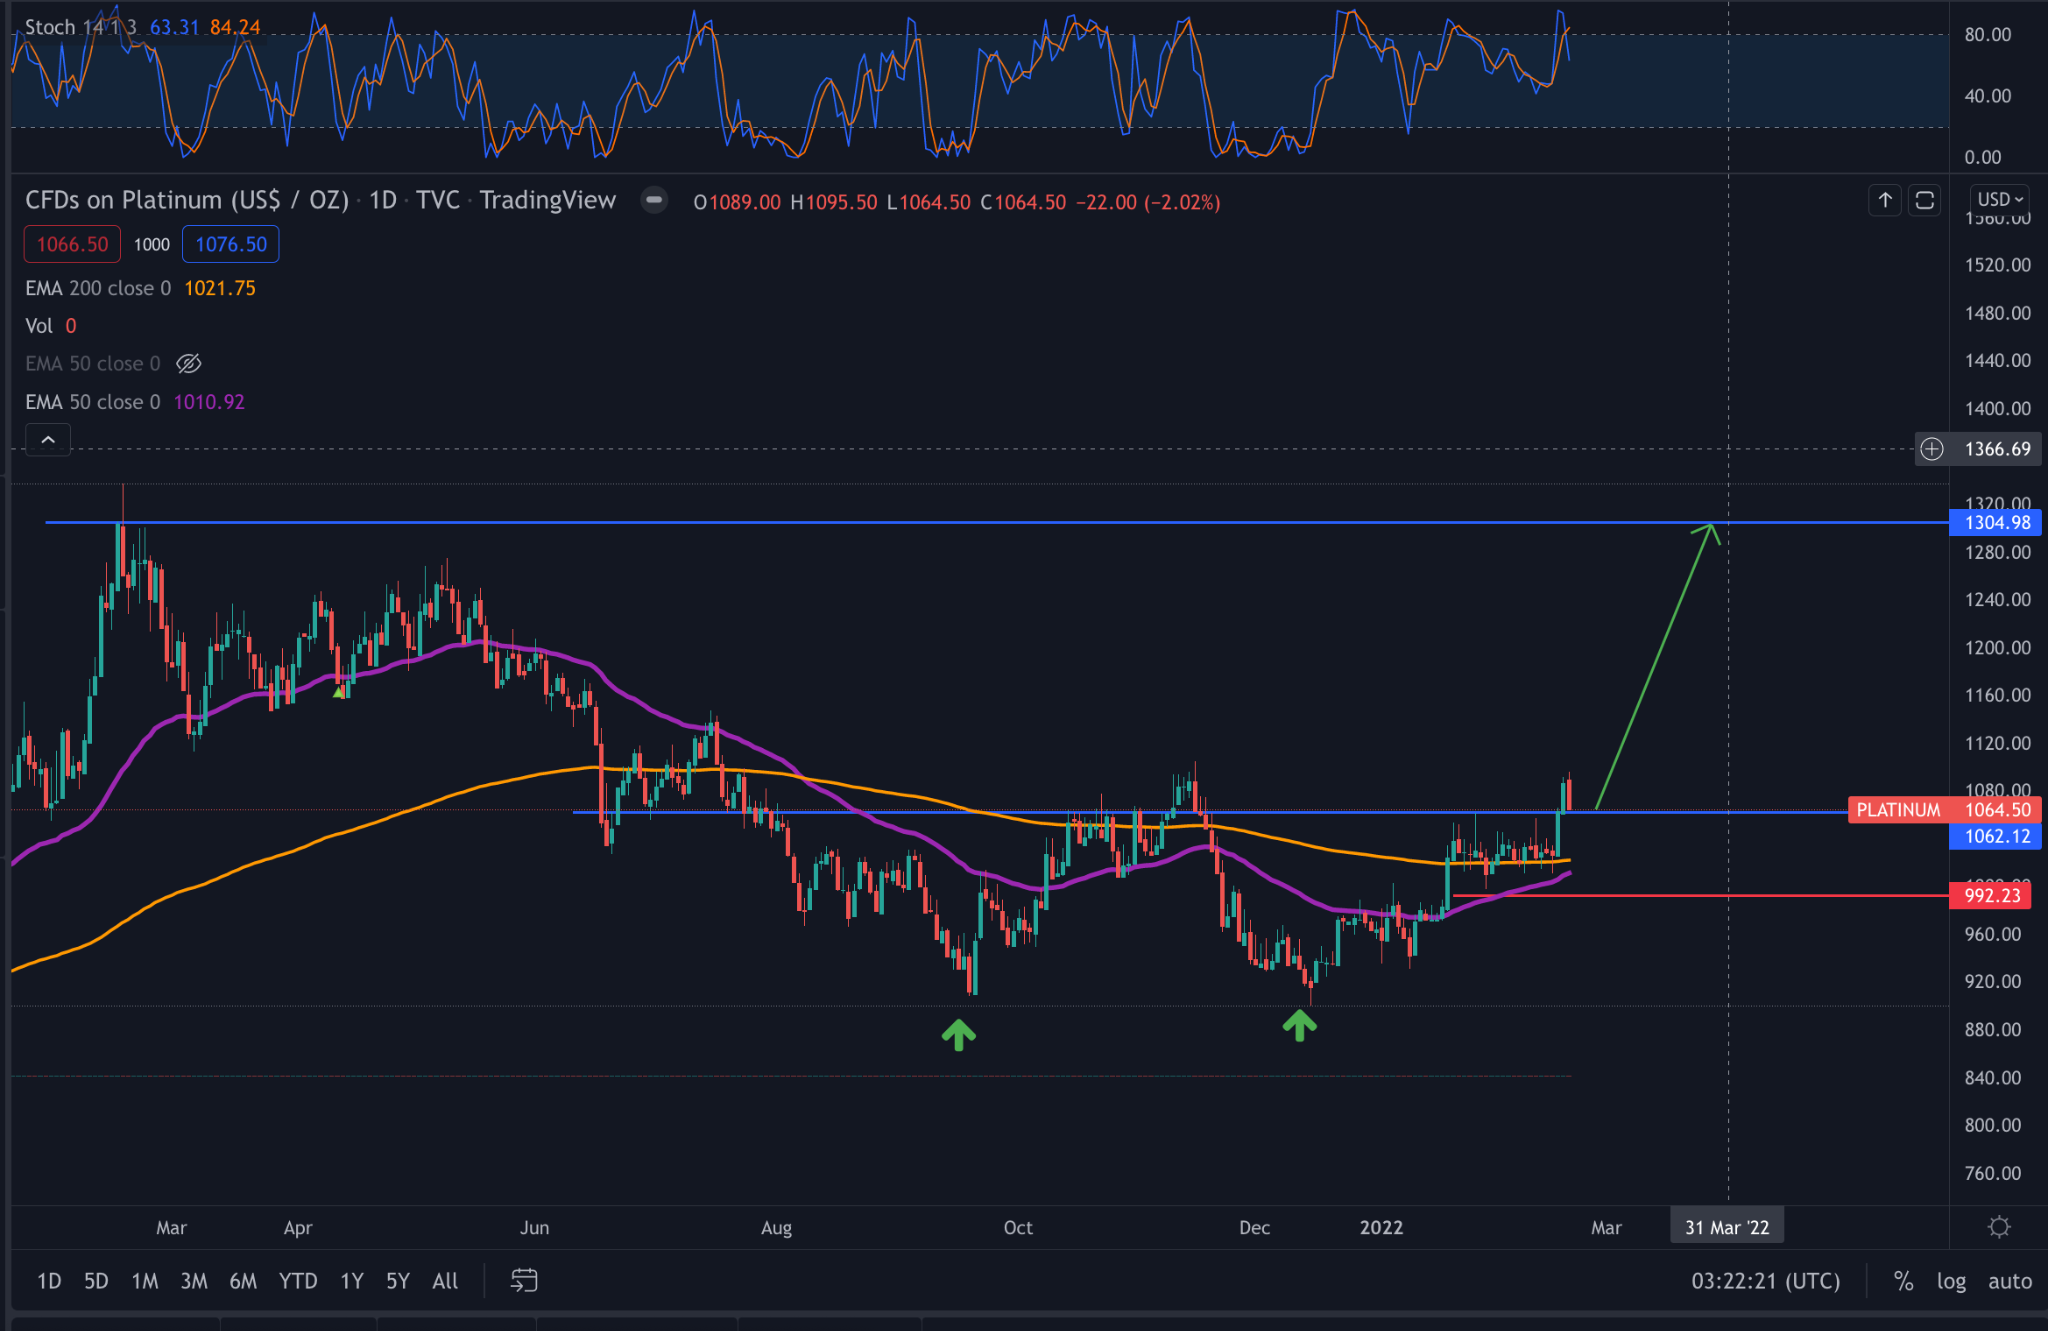
Platinum
Resources prices have been rising recently. Platinum showing a double bottom reversal pattern. Bouncing off the 50 200 day EMA.The first breakout was from a cup and handle pattern we could see the metal run to $1304 with $992 risk point.
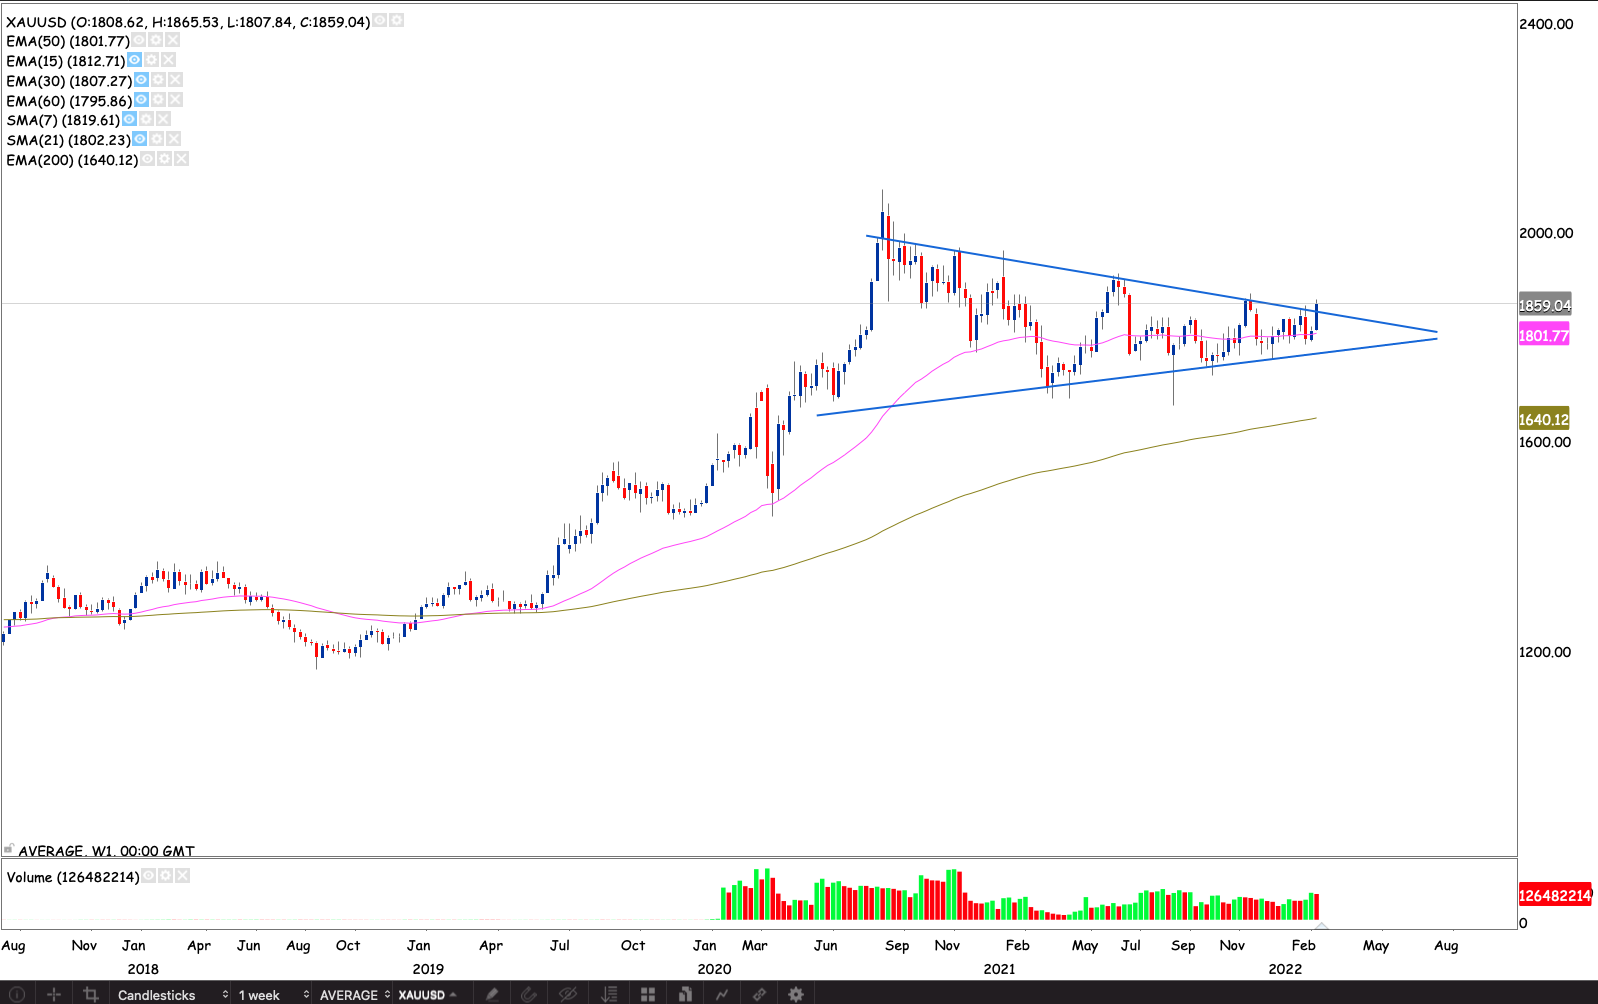
Gold
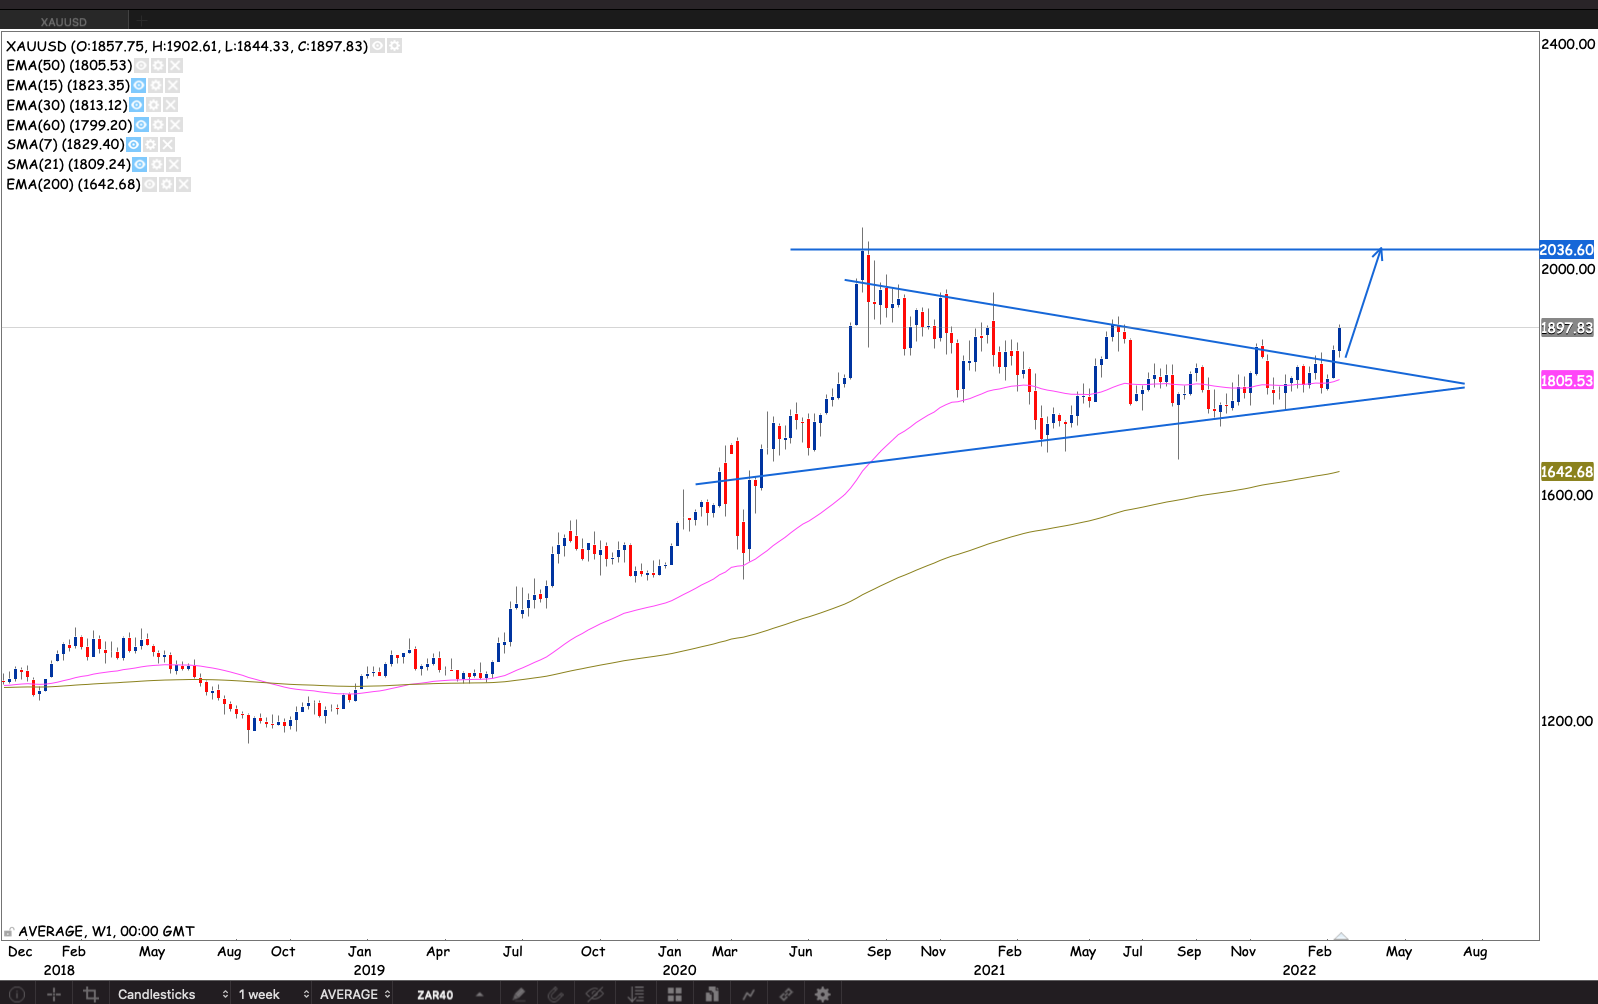
Gold breakout seems to be a valid one. Looking likely to run up to $2063 prior highs. The yellow metal is quite close to make a 52 week high close, if it closes this week above $1902.60 the high is $1916.53.
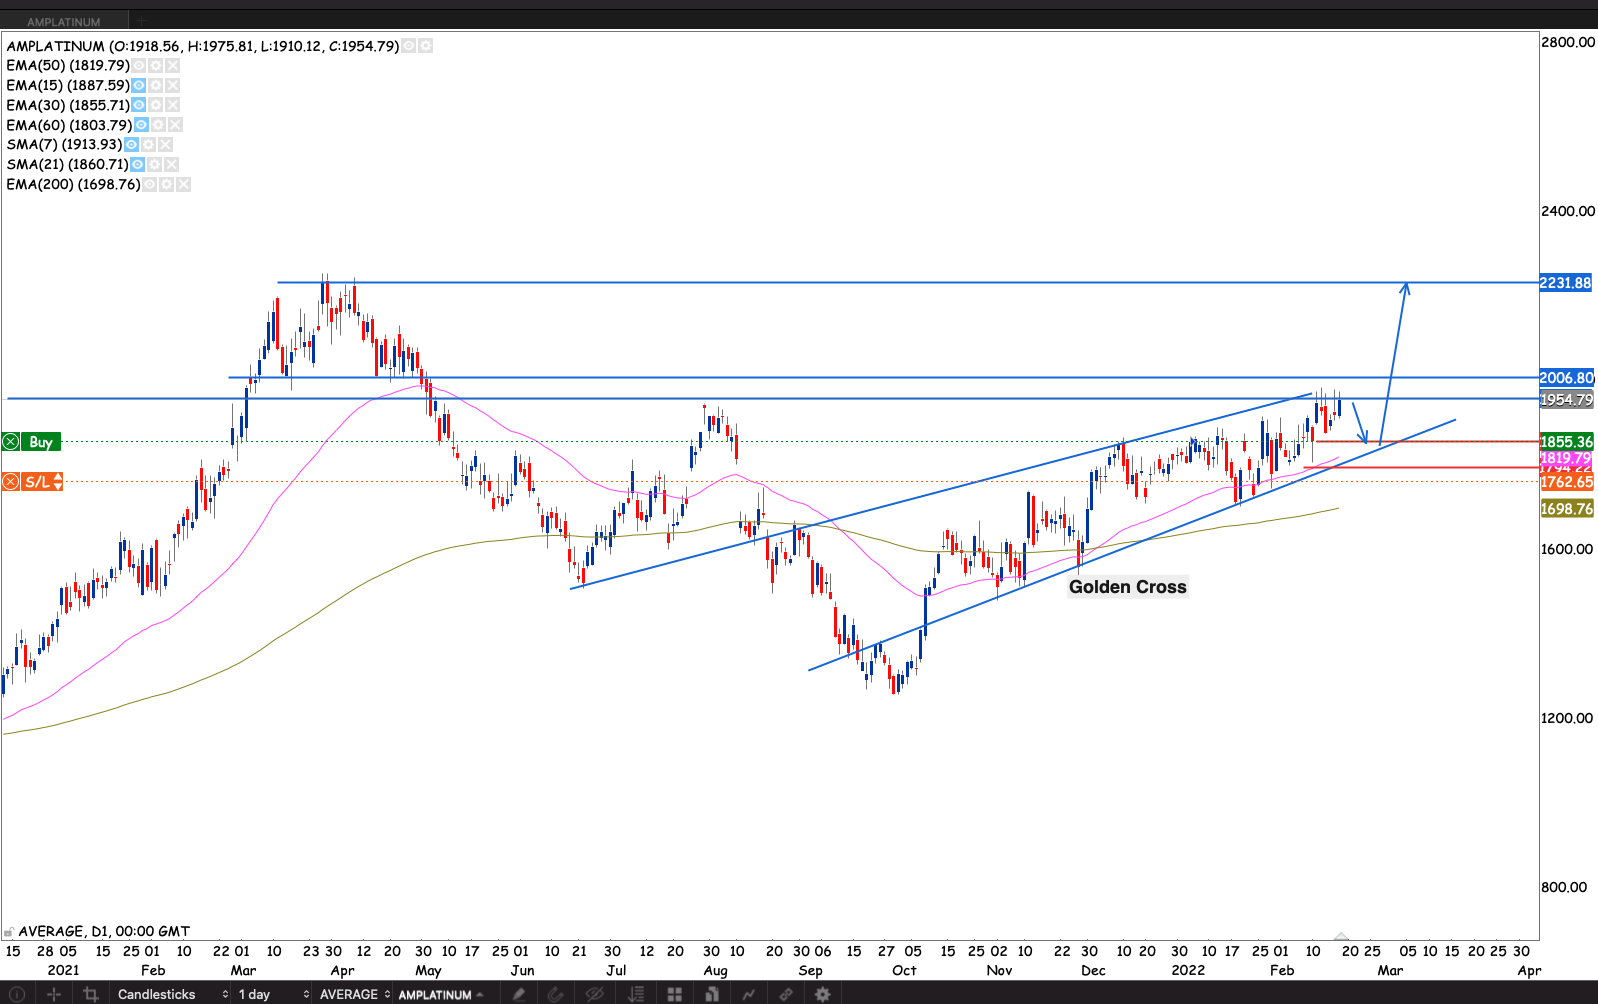
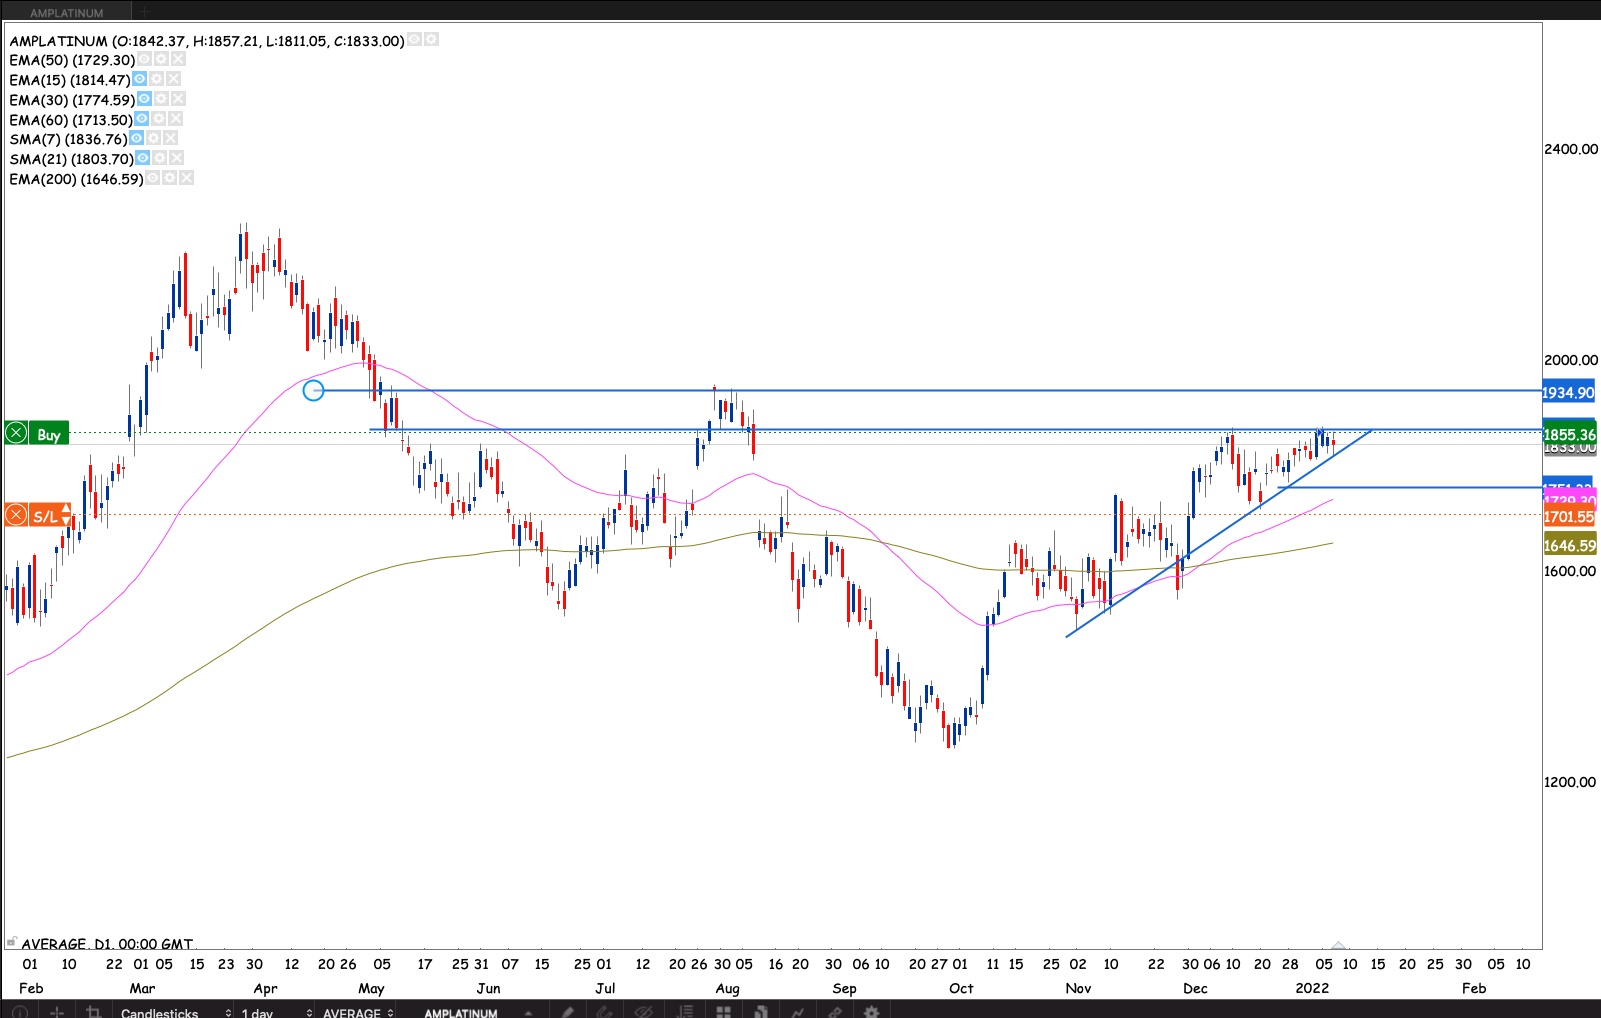
Amplats
Bulliah platinum prices are positive for Amplats stock. I’m watching the R2006 old support. If the market breaks through, I will raise my stop loss and add to my position. The company has results coming to today
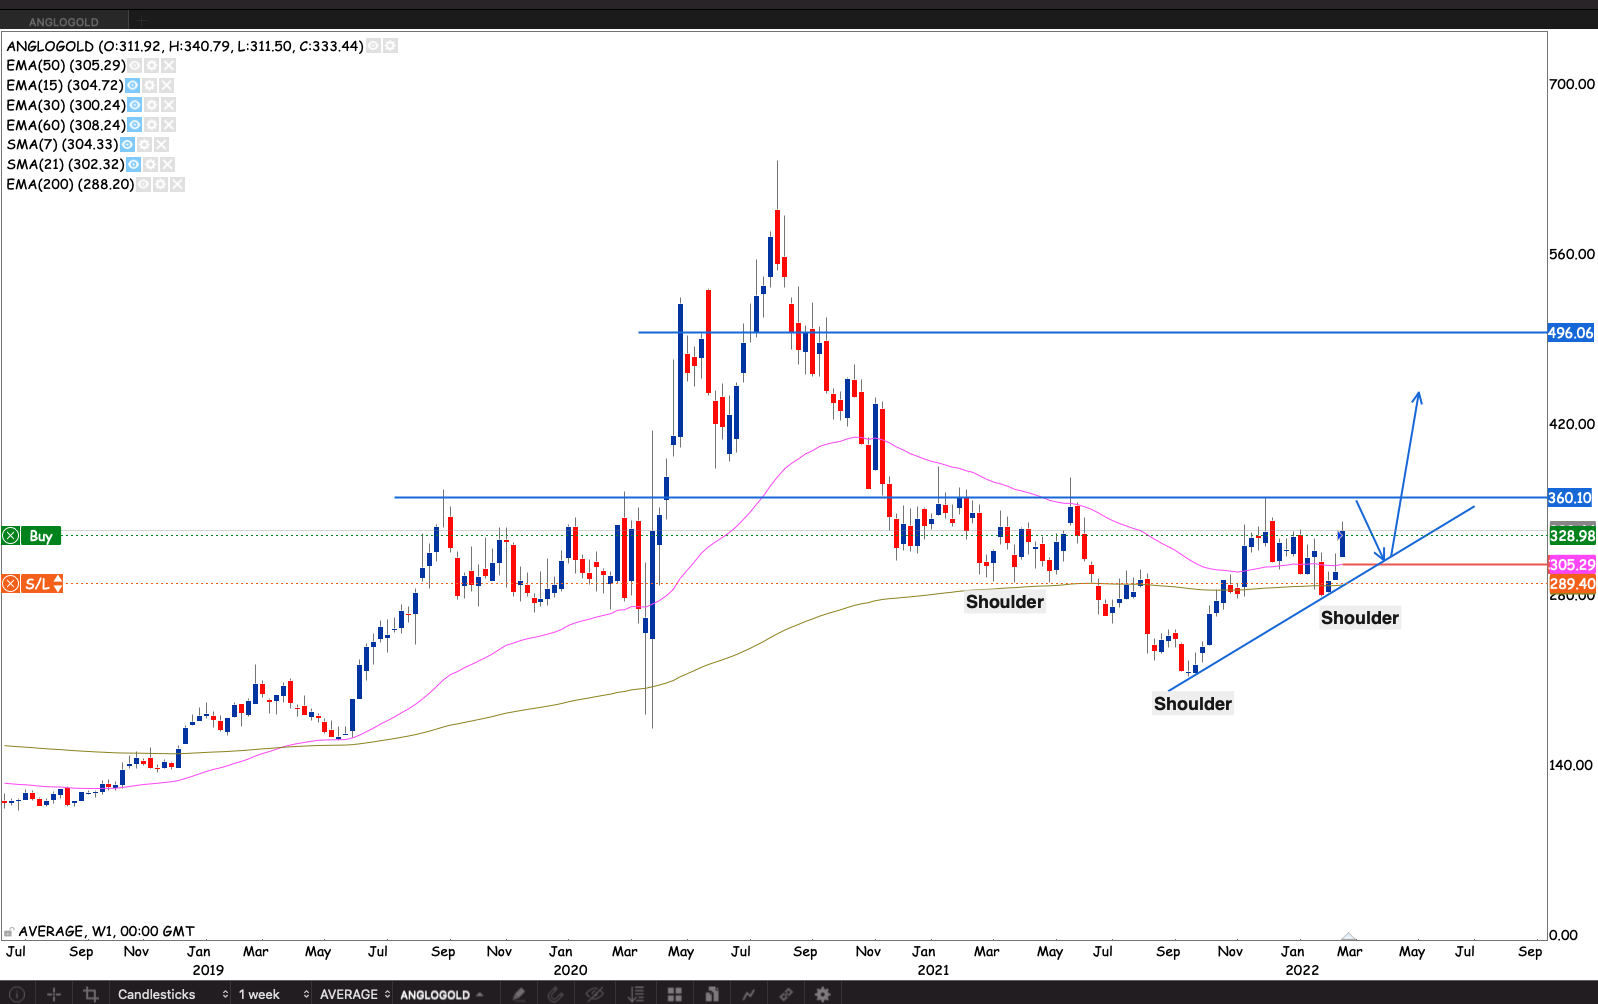
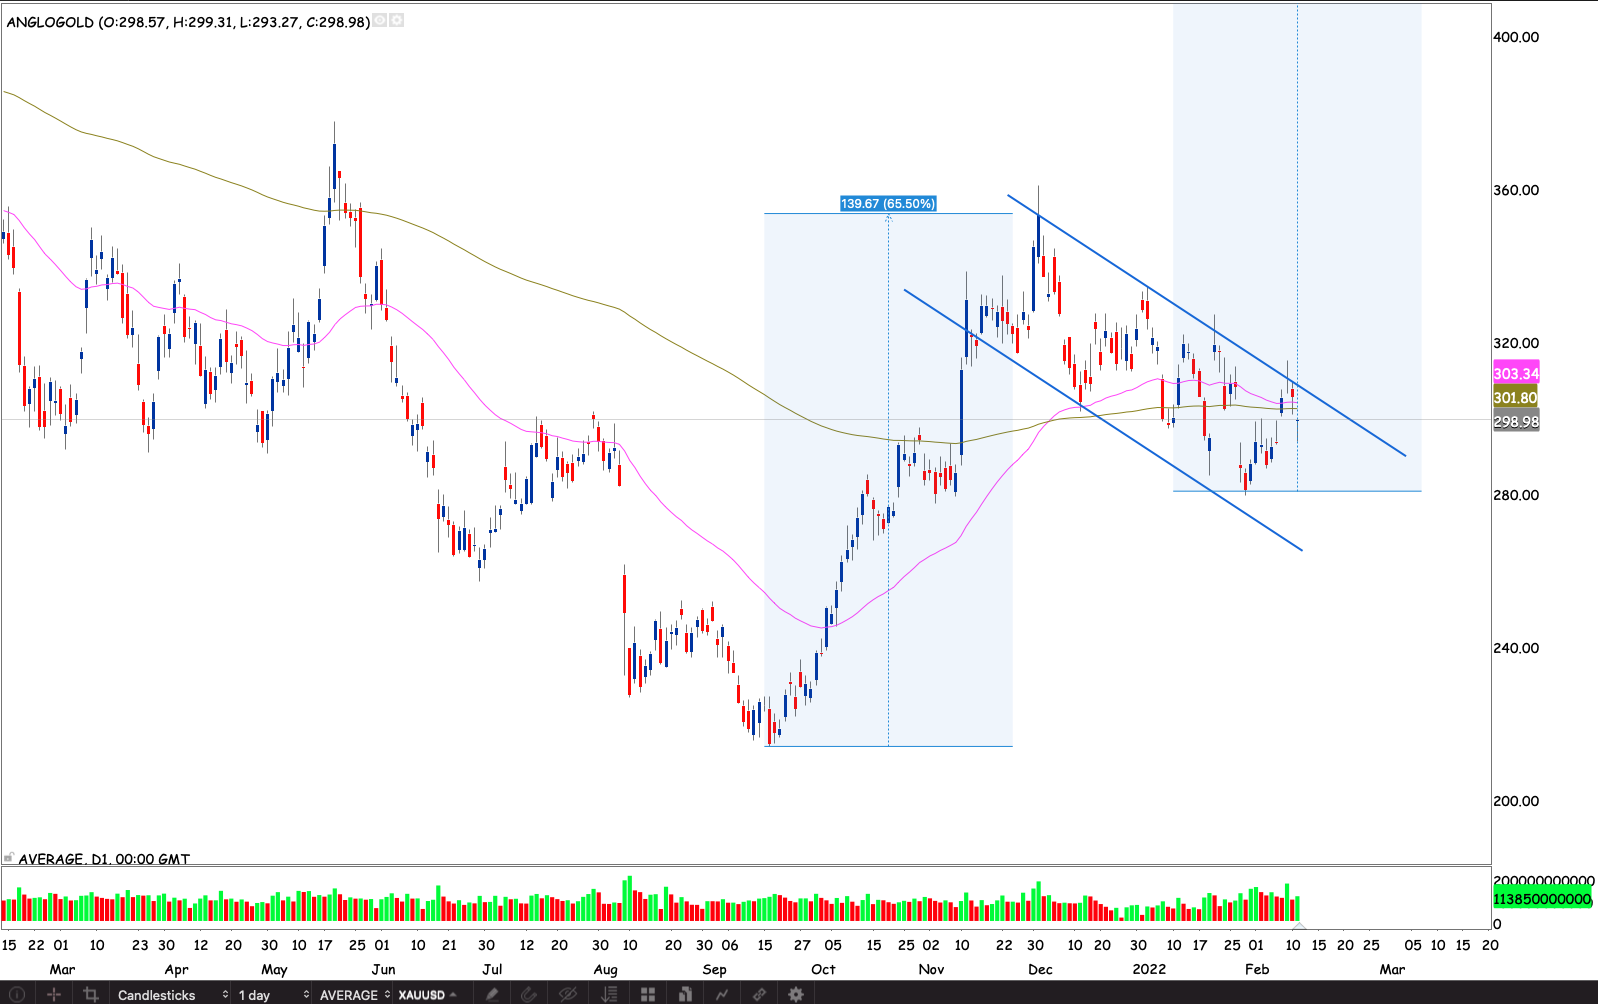
Anglo Gold
The stock broke the R330 resistance but with a doji. Not sure if the market was merely testing R330 or a valid reversal pattern. We have a head and shoulders pattern on the weekly chart. Setting up. With the gold breakout seemingly holding out. I will watch the R360 neckline. Going to hold off on raising my stop loss for now. Just in case the neckline holds up. The company is coming up with results on Friday. Gold was up 13% during the reporting period at the same time the rand weakened by as much as 12% albeit gaining some strength in the last quarter of the reporting period. Still net weak for the period. The results on Friday will be the catalyst that will propel them in one direction or the other.
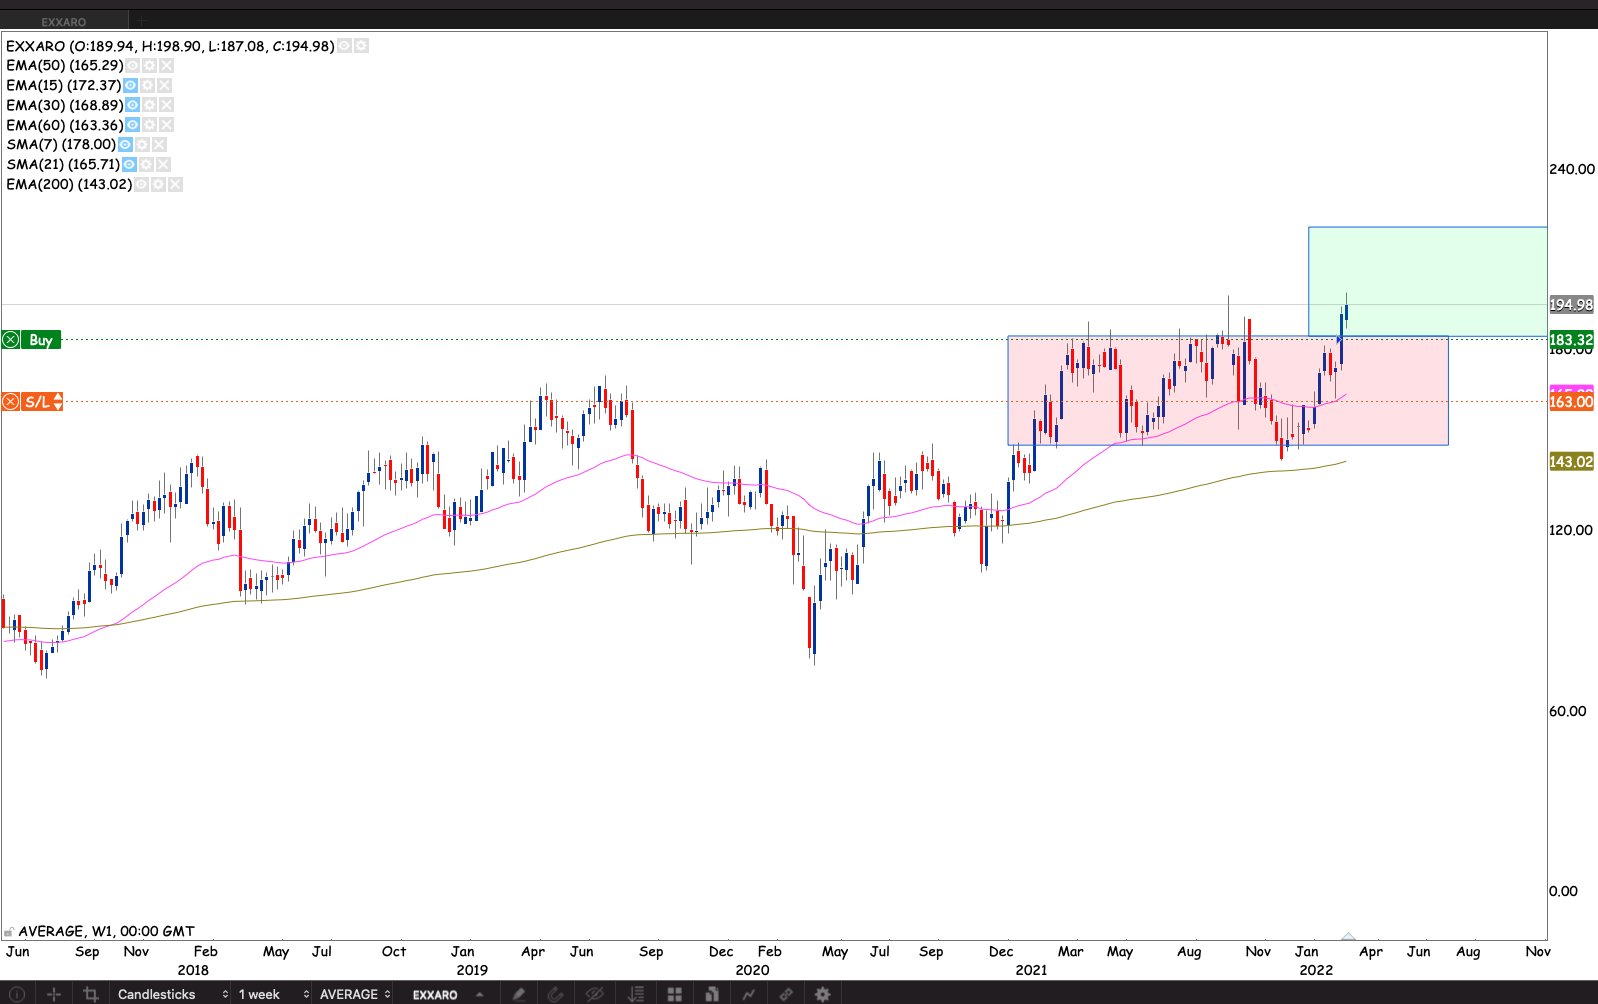
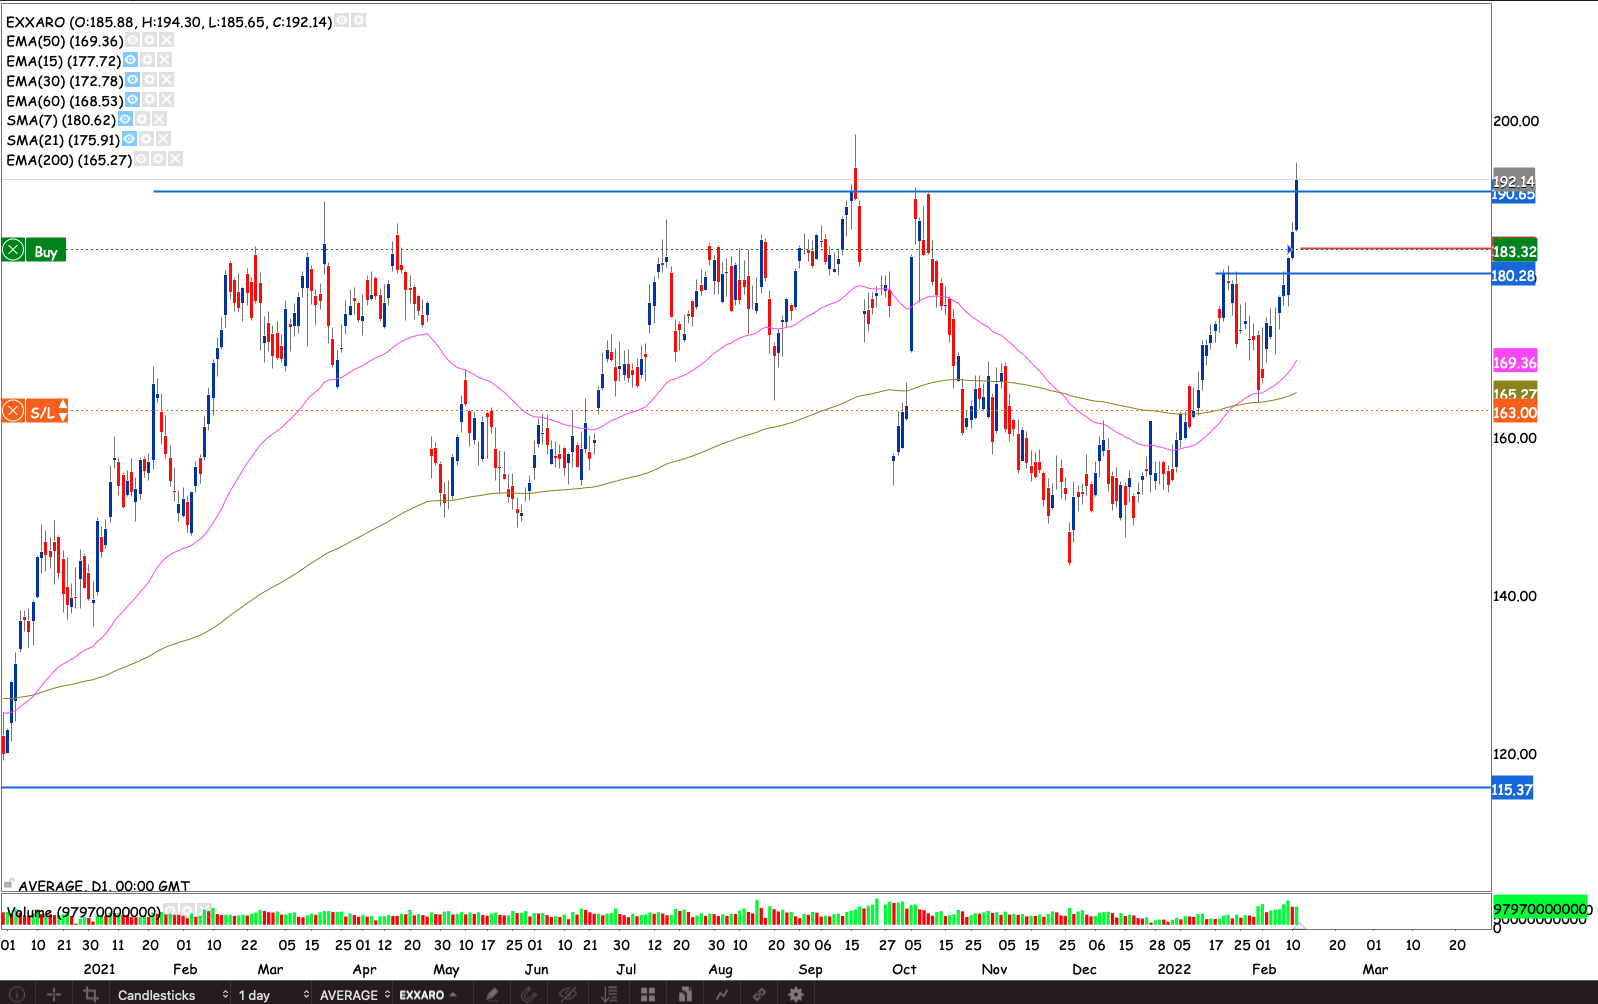
Exxaro
Exxaro finally broke out of its rather wide range. Exxaro has been a tough hold with wide ranges. I will be cautious and patient with raising my stop and adding to the position.
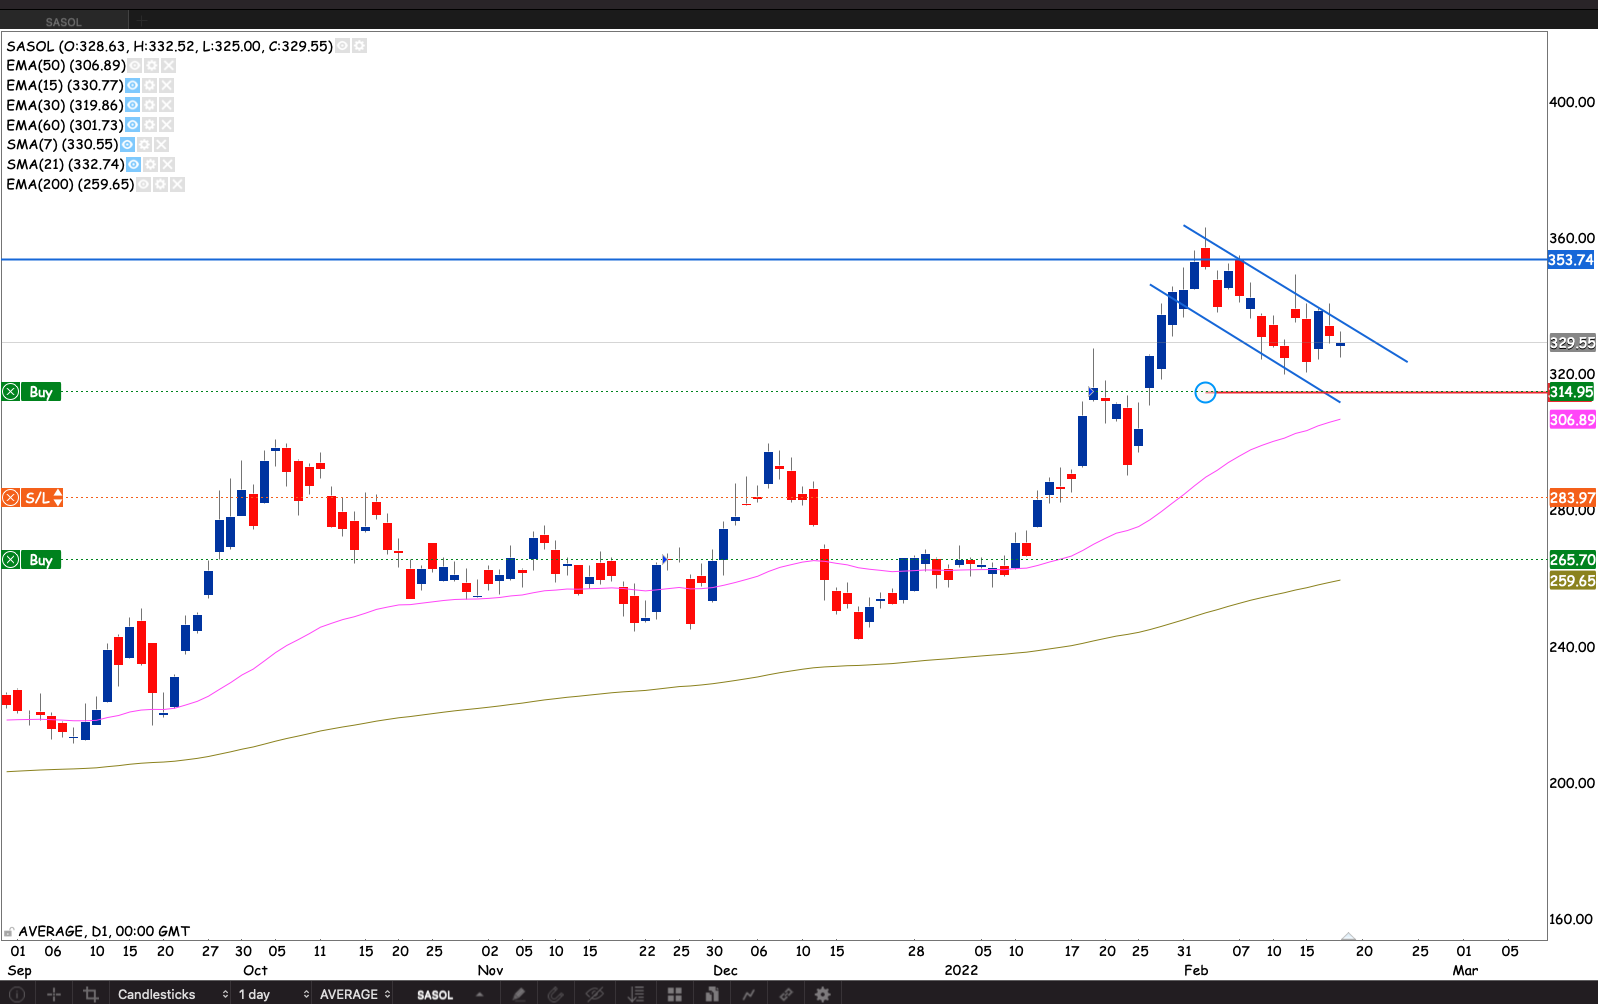
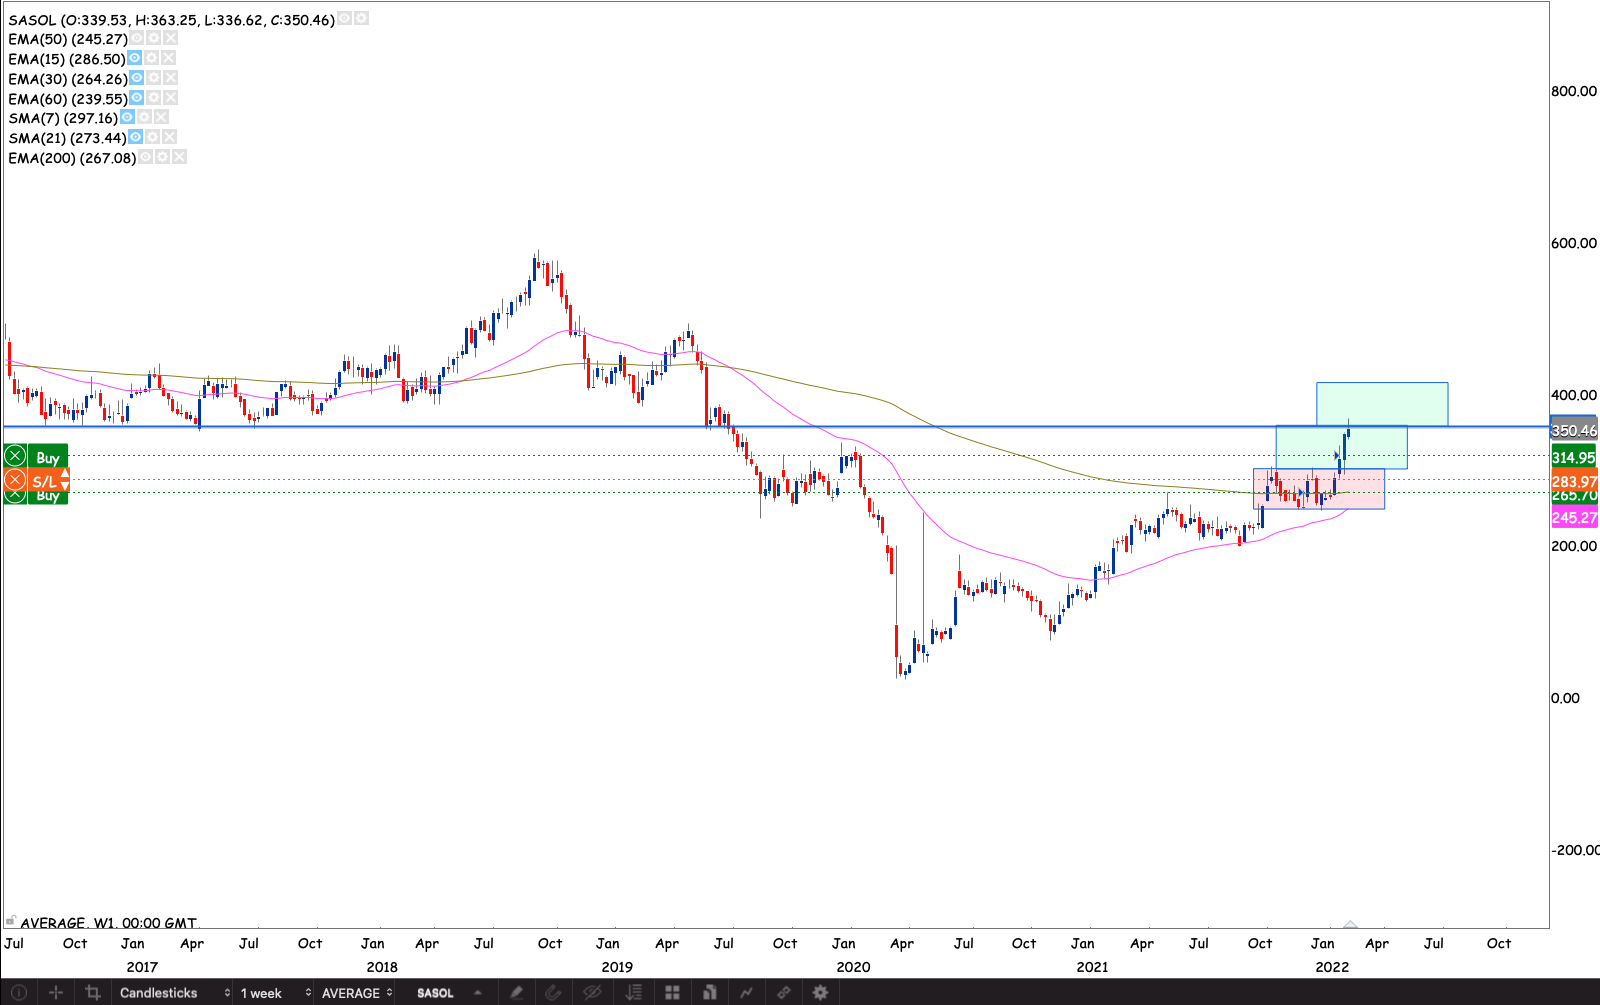
Sasol
We have a nice bullish flag on the stock. However I’m going to wait for the R353 old support to crack. I might be a tough one to break. I’m targeting R314 as a place to raise my stop loss to.
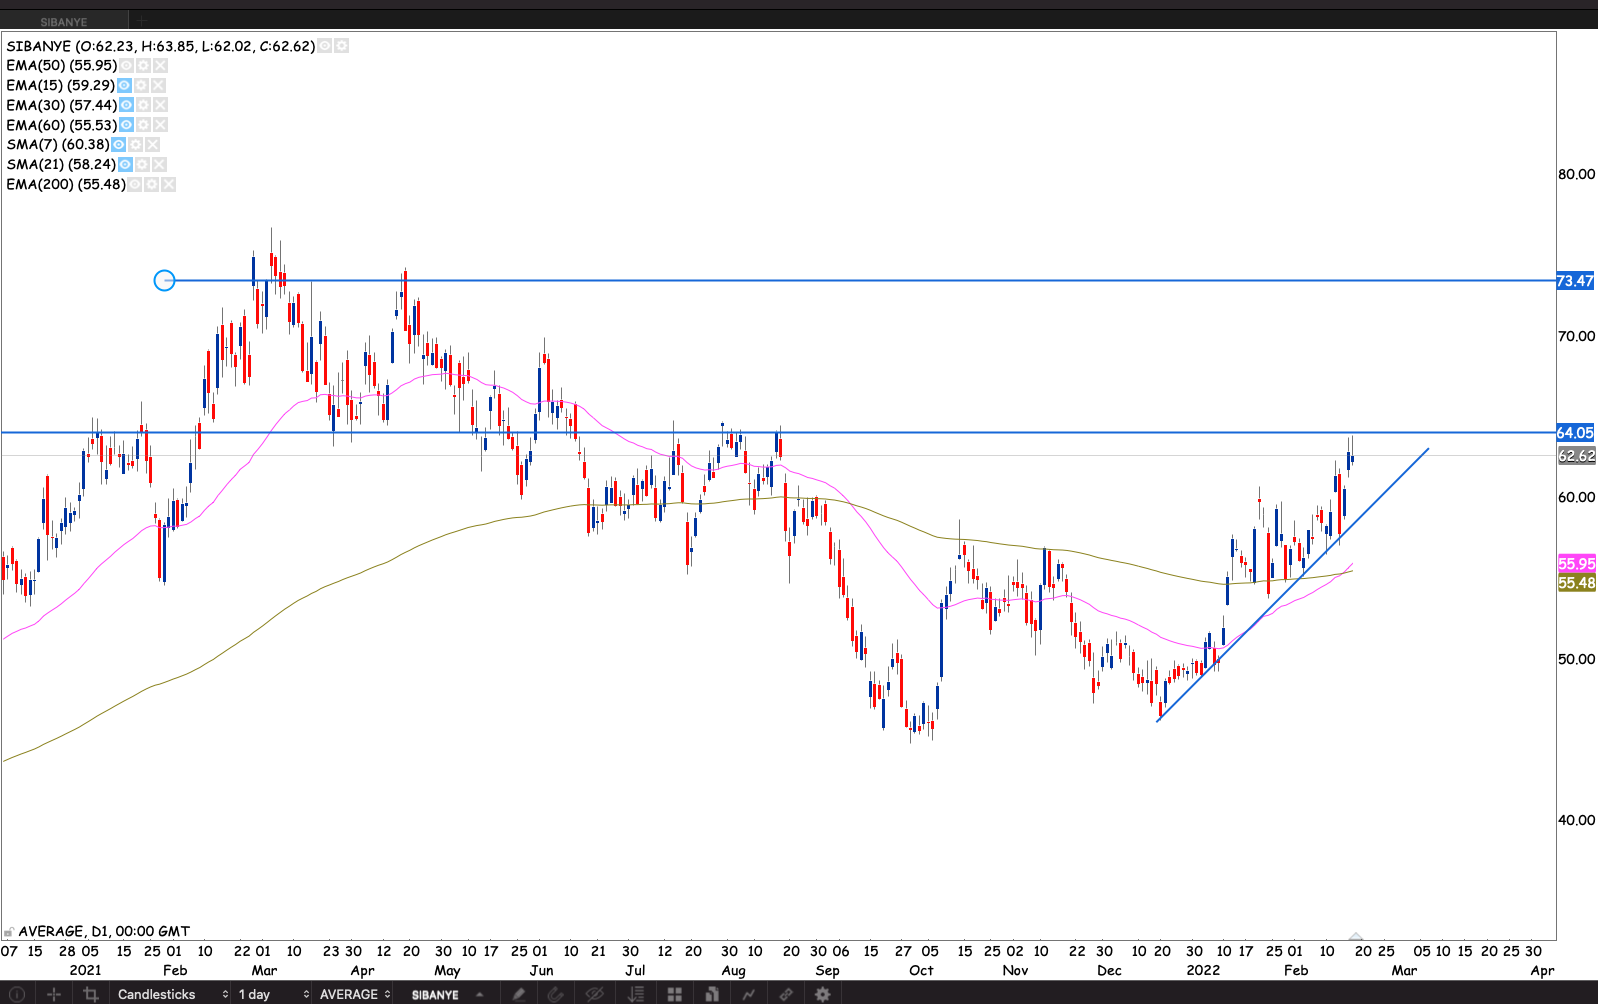
Sibanye
We have a golden cross. I’ve been watching Sibanye for a while now waiting for the golden cross. I suppose it needed a move in gold. I’m watching the R64 old support for an entry signal. My goal will then be to cross R73 with the position still intact having added to it a few times.
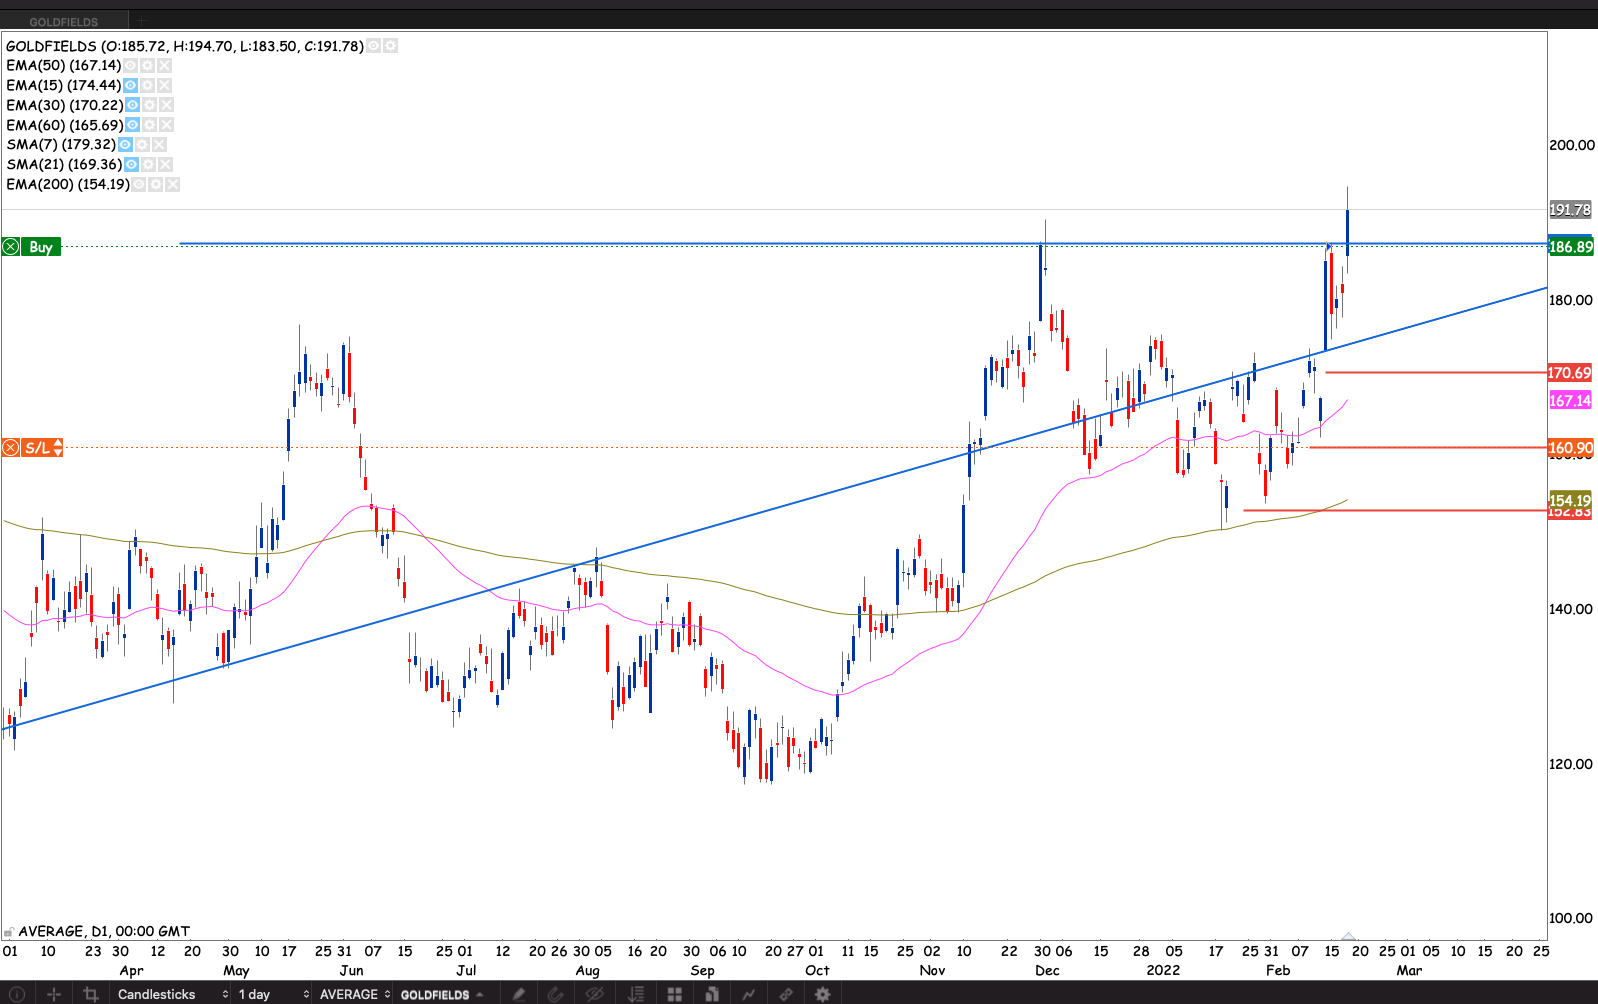
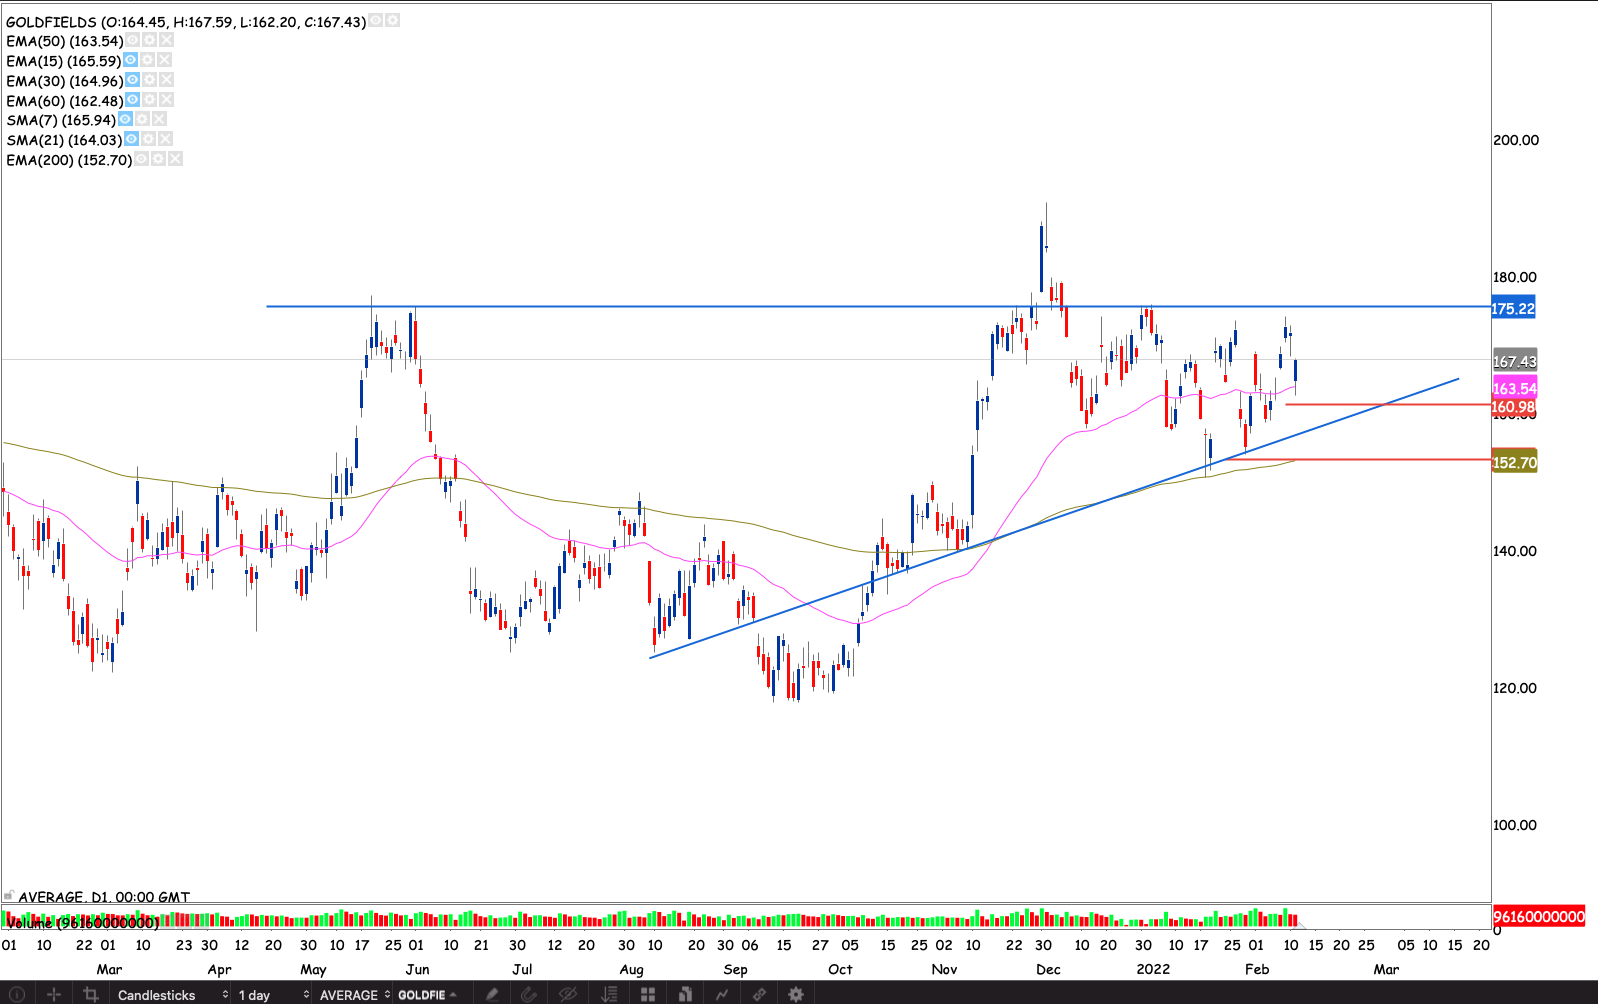
GoldFields
The stock made a new 52 week high after bouncing off the 50 week EMA. Opening the week with a gap and drive. With gold looking bullish I’m positive on the trade but will hold off on raising my stop and adding to the position. I will monitor the price for reaction in the week
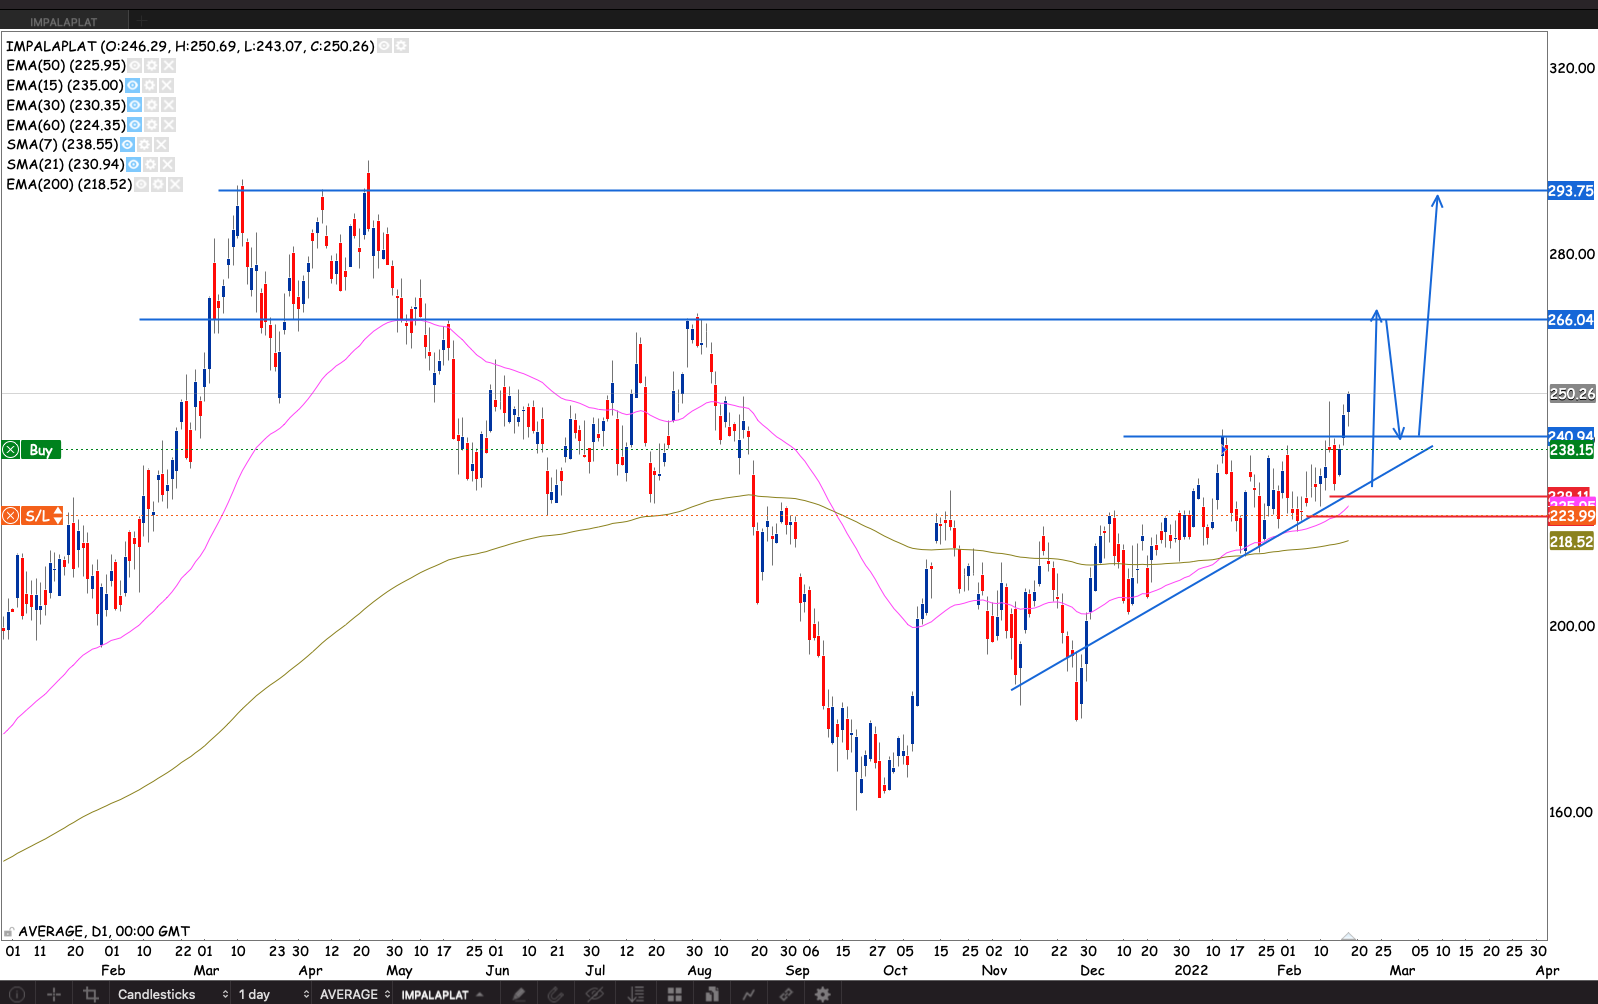
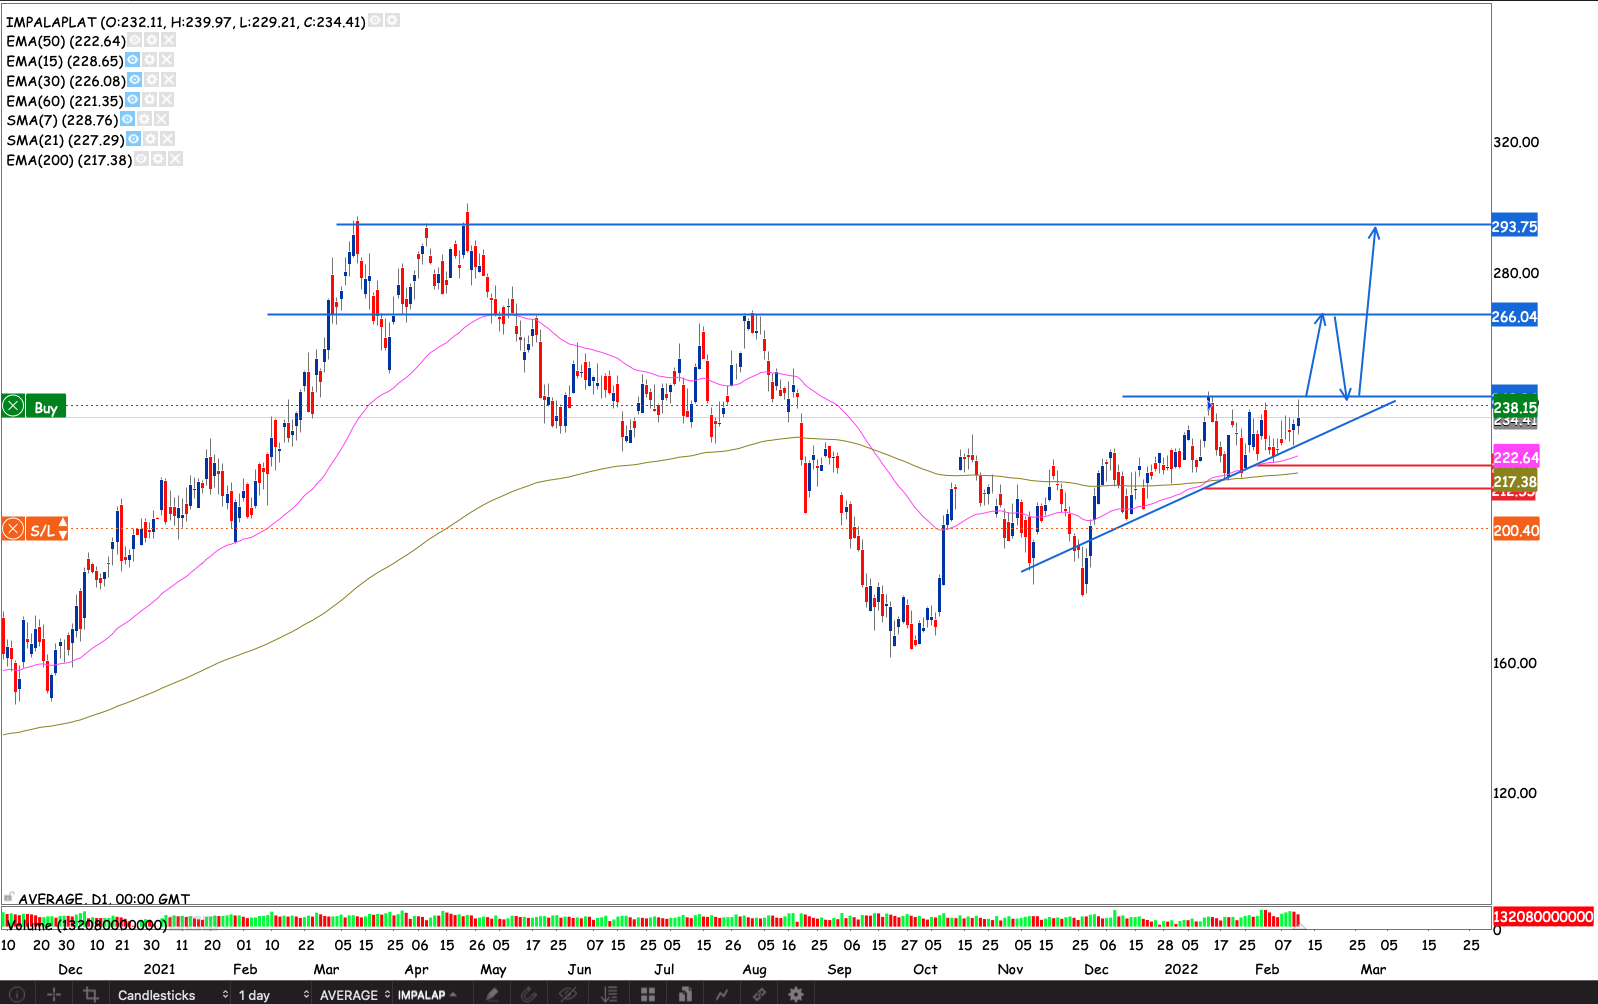
Impala Platinum
The stock broke from an ascending triangle pattern. Hasn’t looked back since. There’s an overhead resistance at R266. If the market takes out this level. I will raise my stop and add to the position. My goal is to be holding a risk free position when/if the market breakt R293
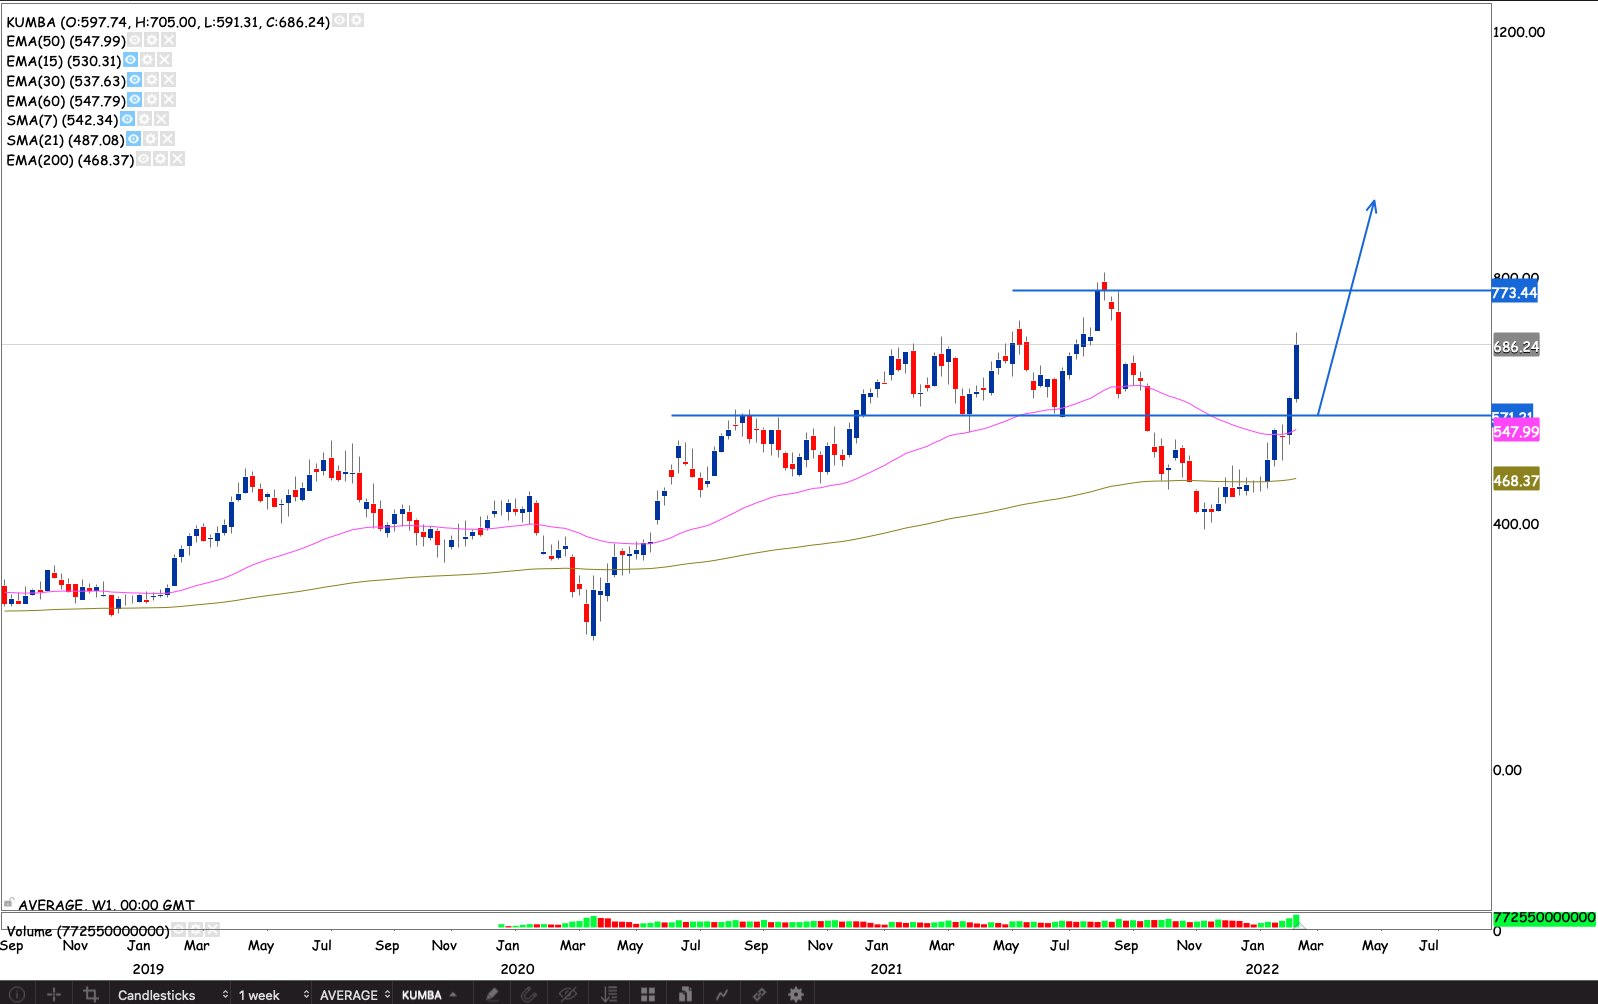
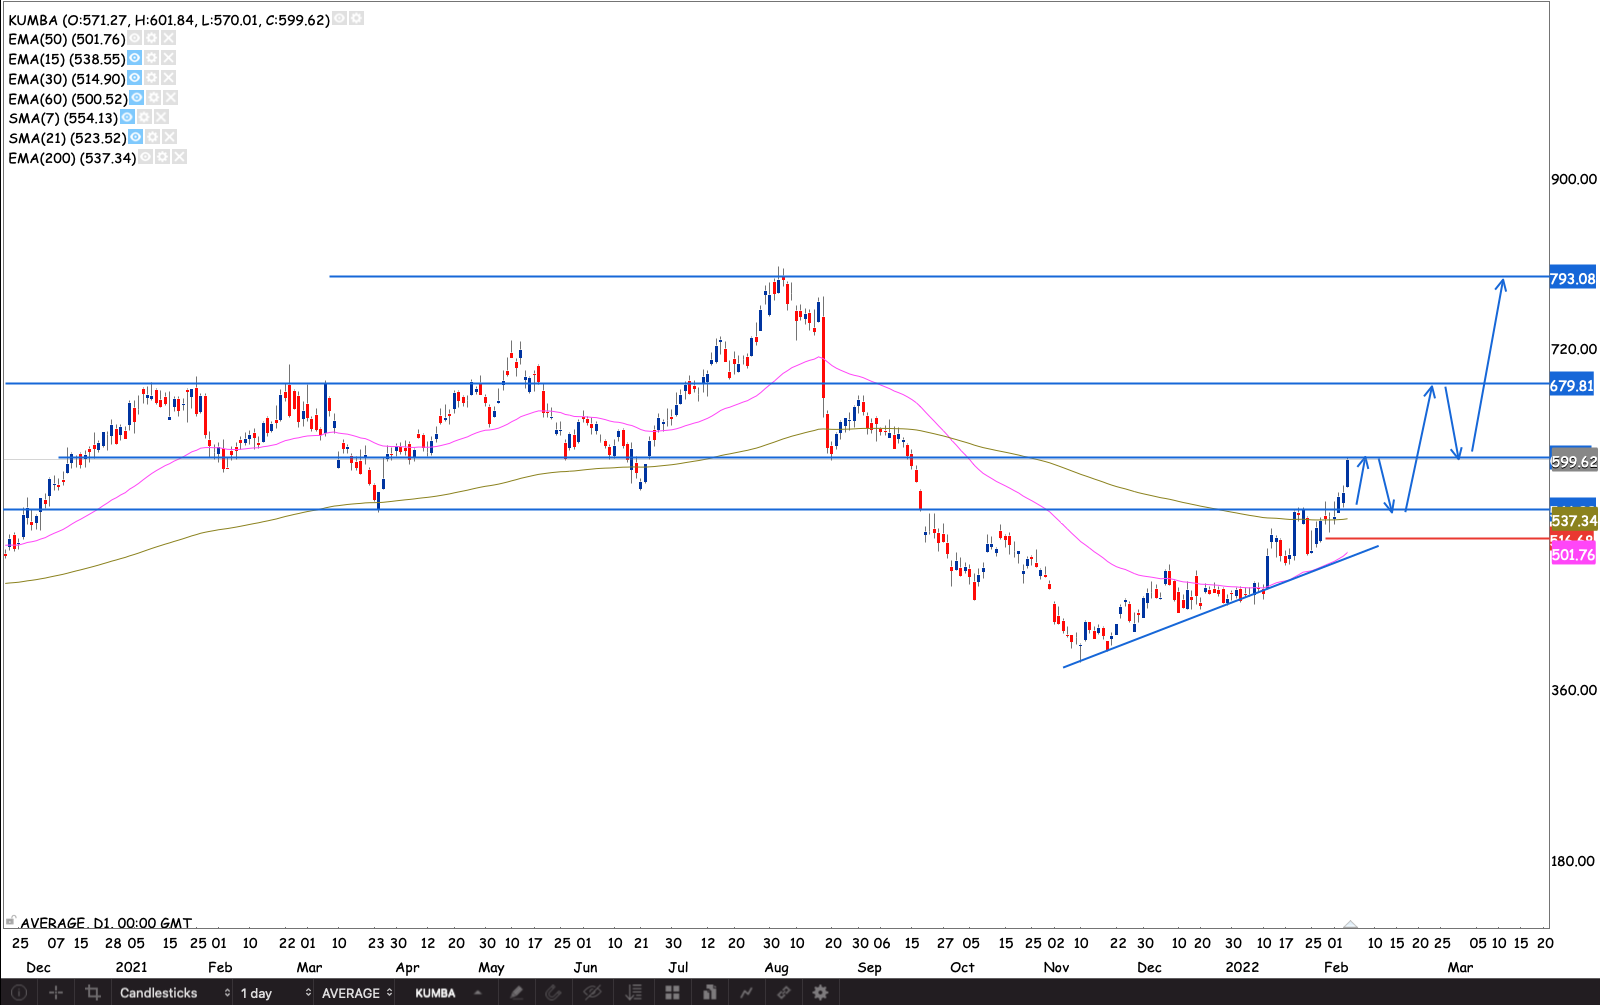
Kumba
Iron Ore prices have been surging recently. Causing a turn in the Kumba stock. It left the 200 week and 50 week EMAs behind in the last few weeks. We now have a golden cross on the daily chart. Market remembered the R691 resistance as Iron Ore prices experienced a bit of a pull back. I’m expecting the market to trendline as a result. Perhaps forming a cup and handle pattern or an ascending triangle.

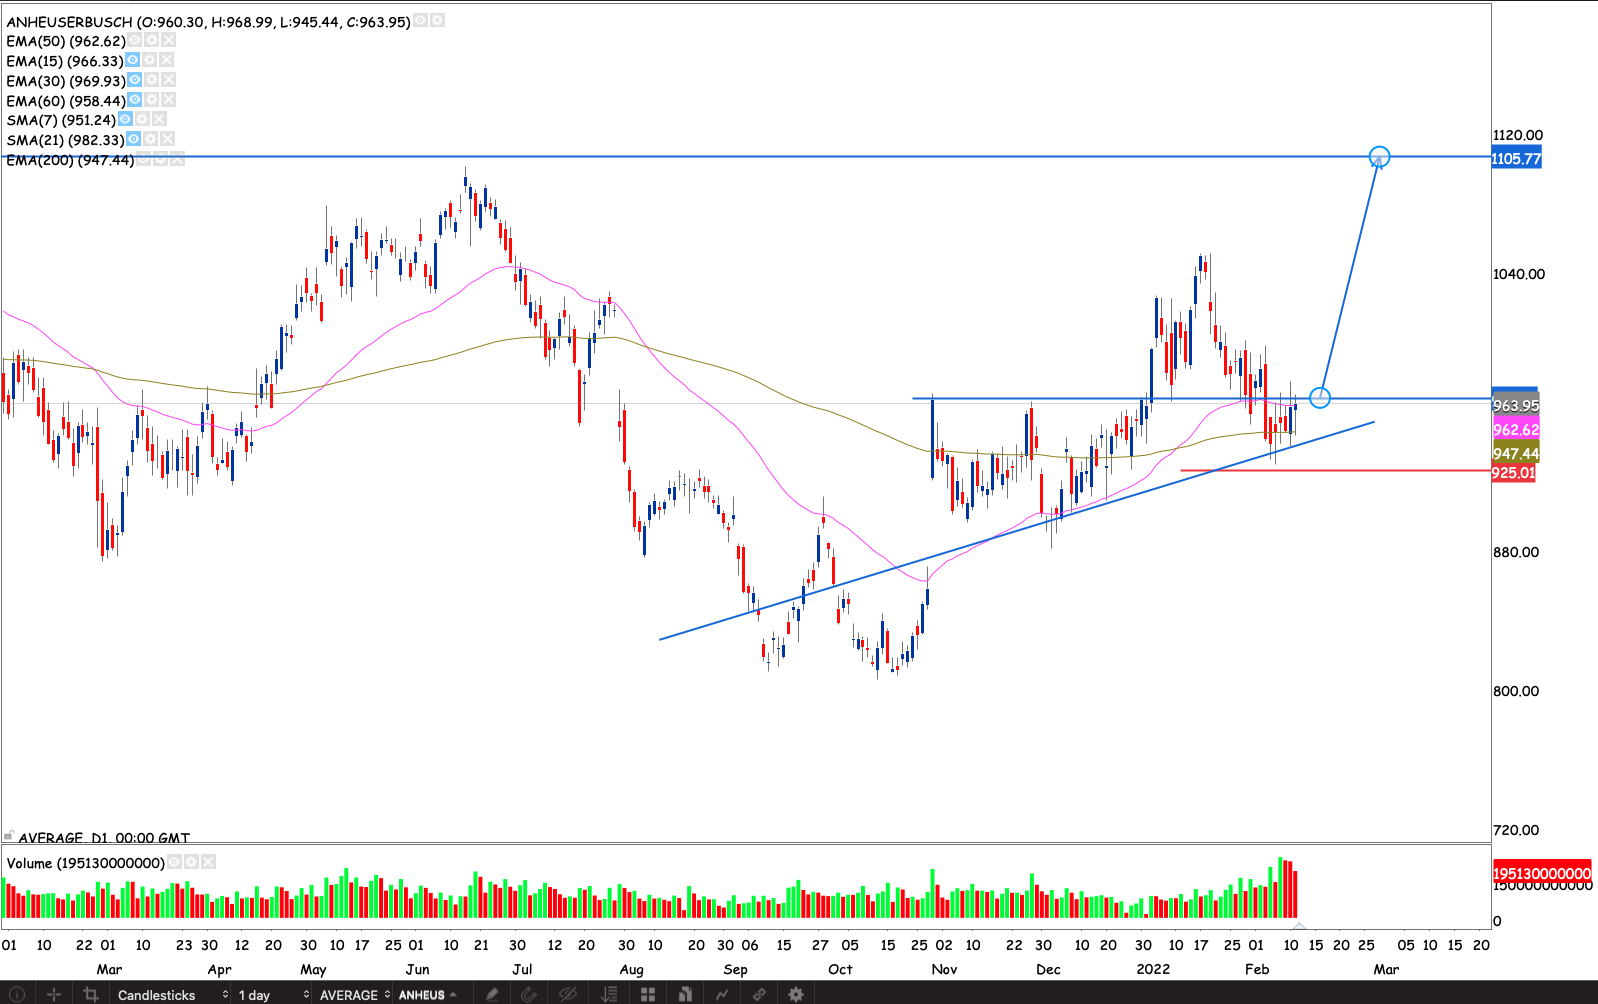
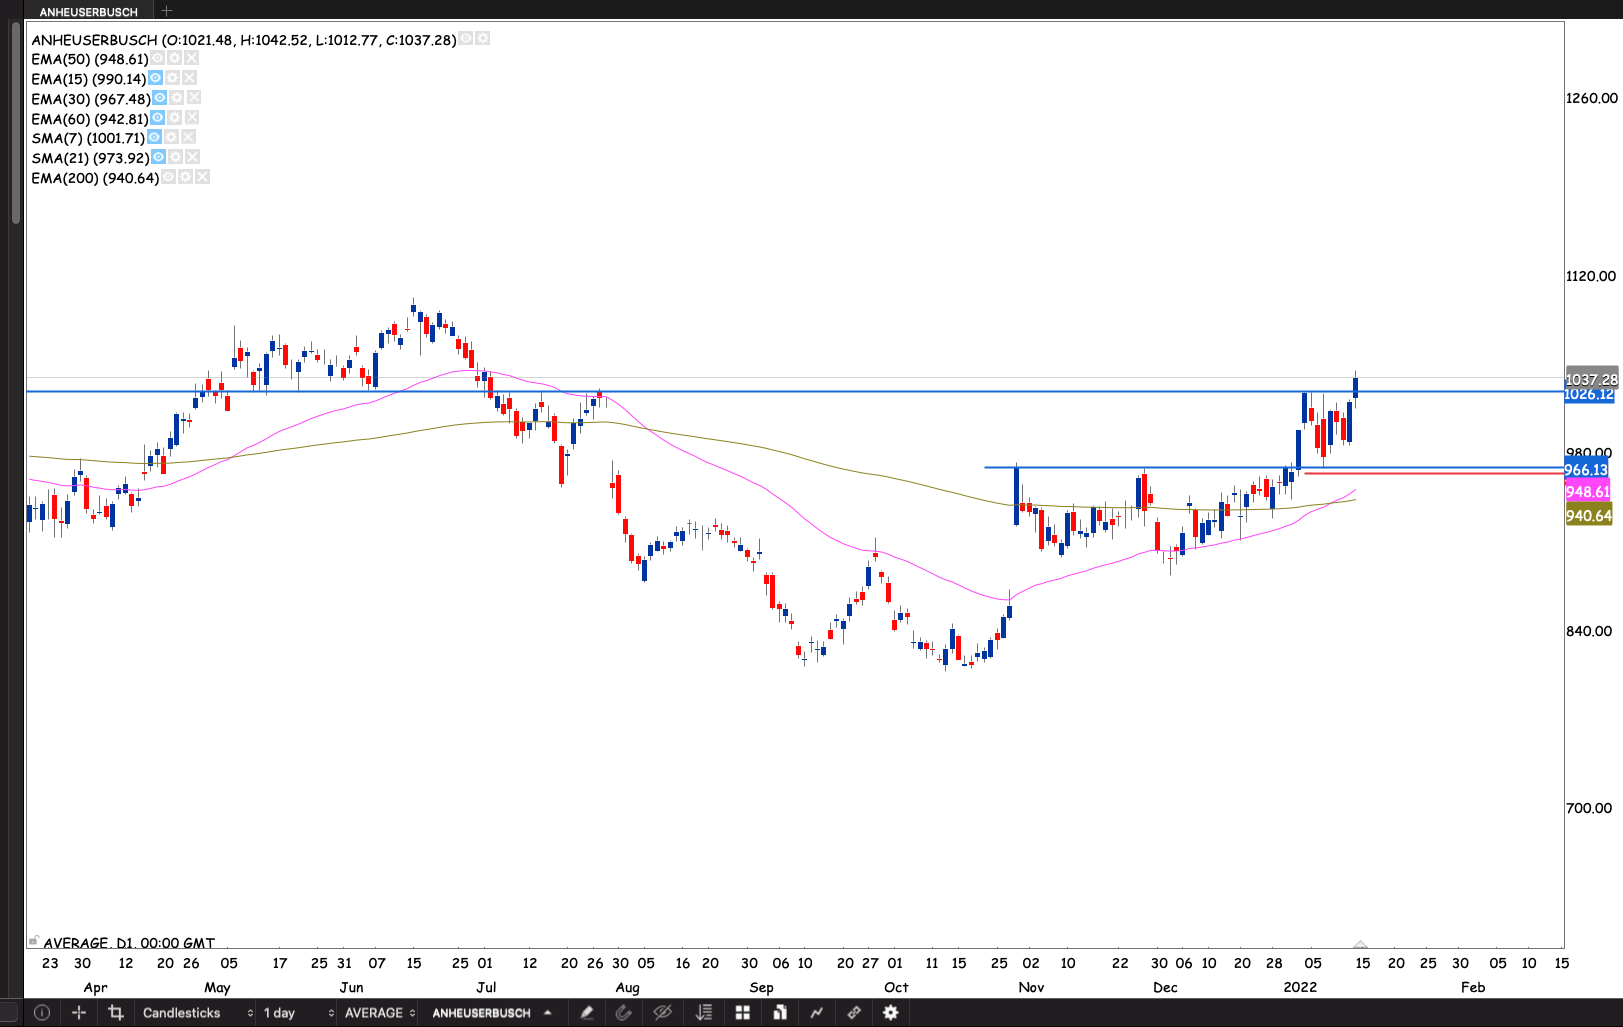
AbInBev
The stock held the uptrend line support. First rally post the golden cross, usually quickly find some selling. Usually from the bulls that have been sitting with a loss for a period and are happy to take a small profit. With the golden cross and uptrend support holding at the back. Closing Friday with a nice bullish engulfing the 200 day EMA. If the stock closes through R966. I will build a position with an initial stop loss at R921.80. The company has results coming this Friday. Those will be interesting to look at.

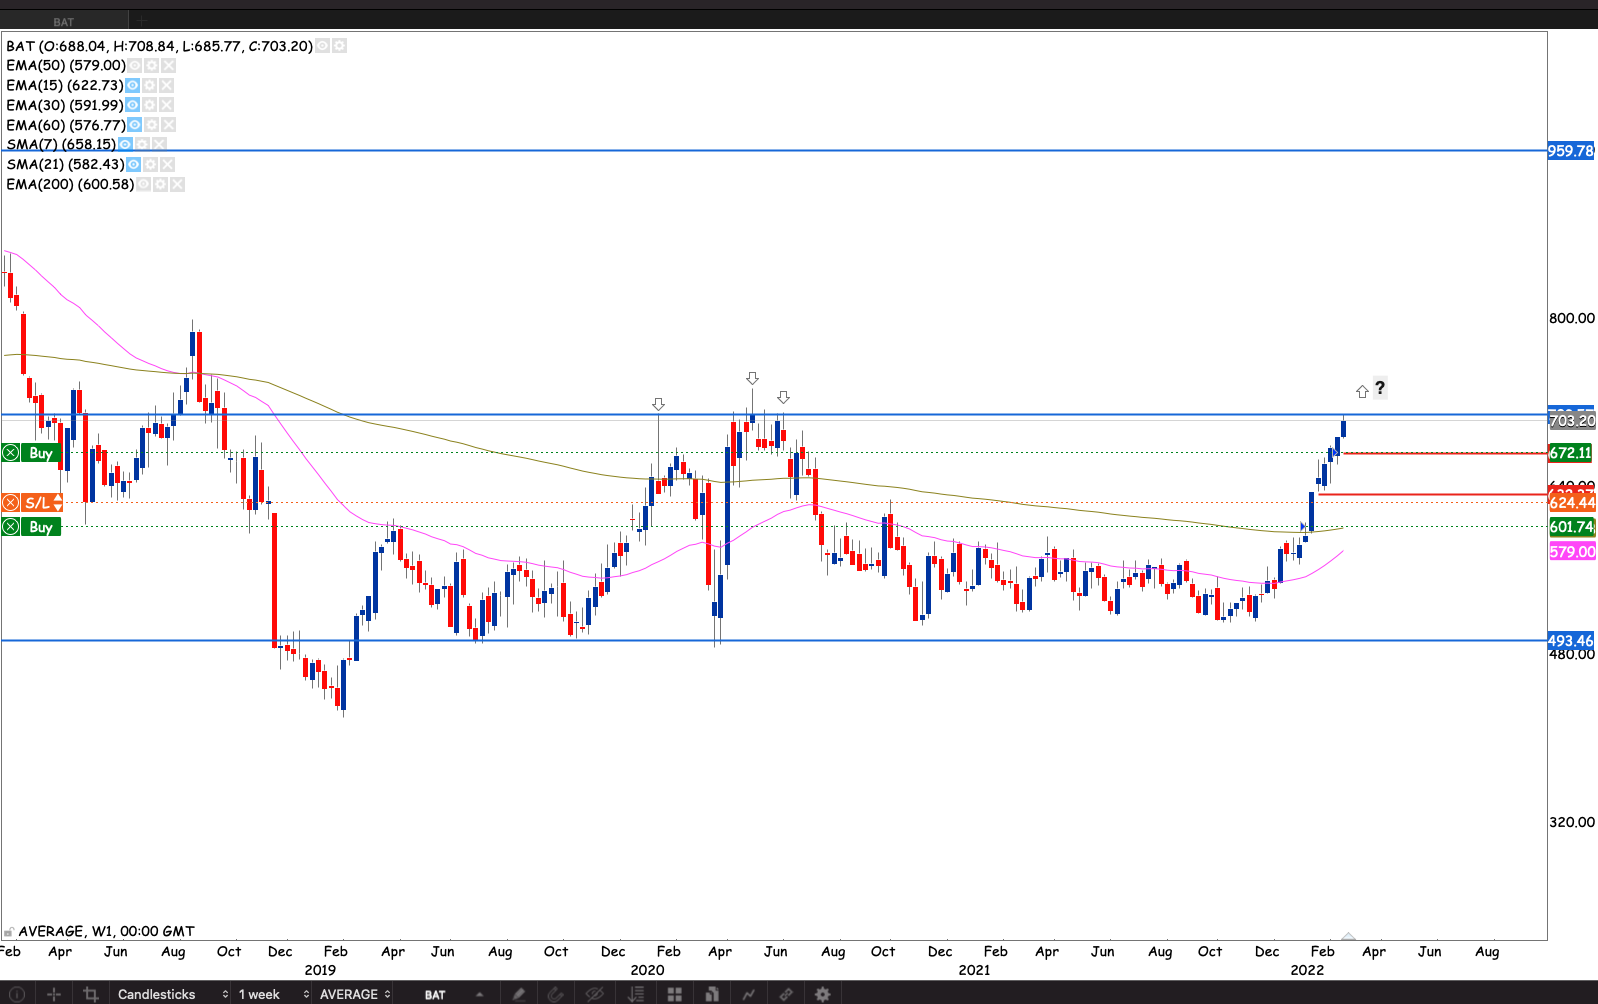
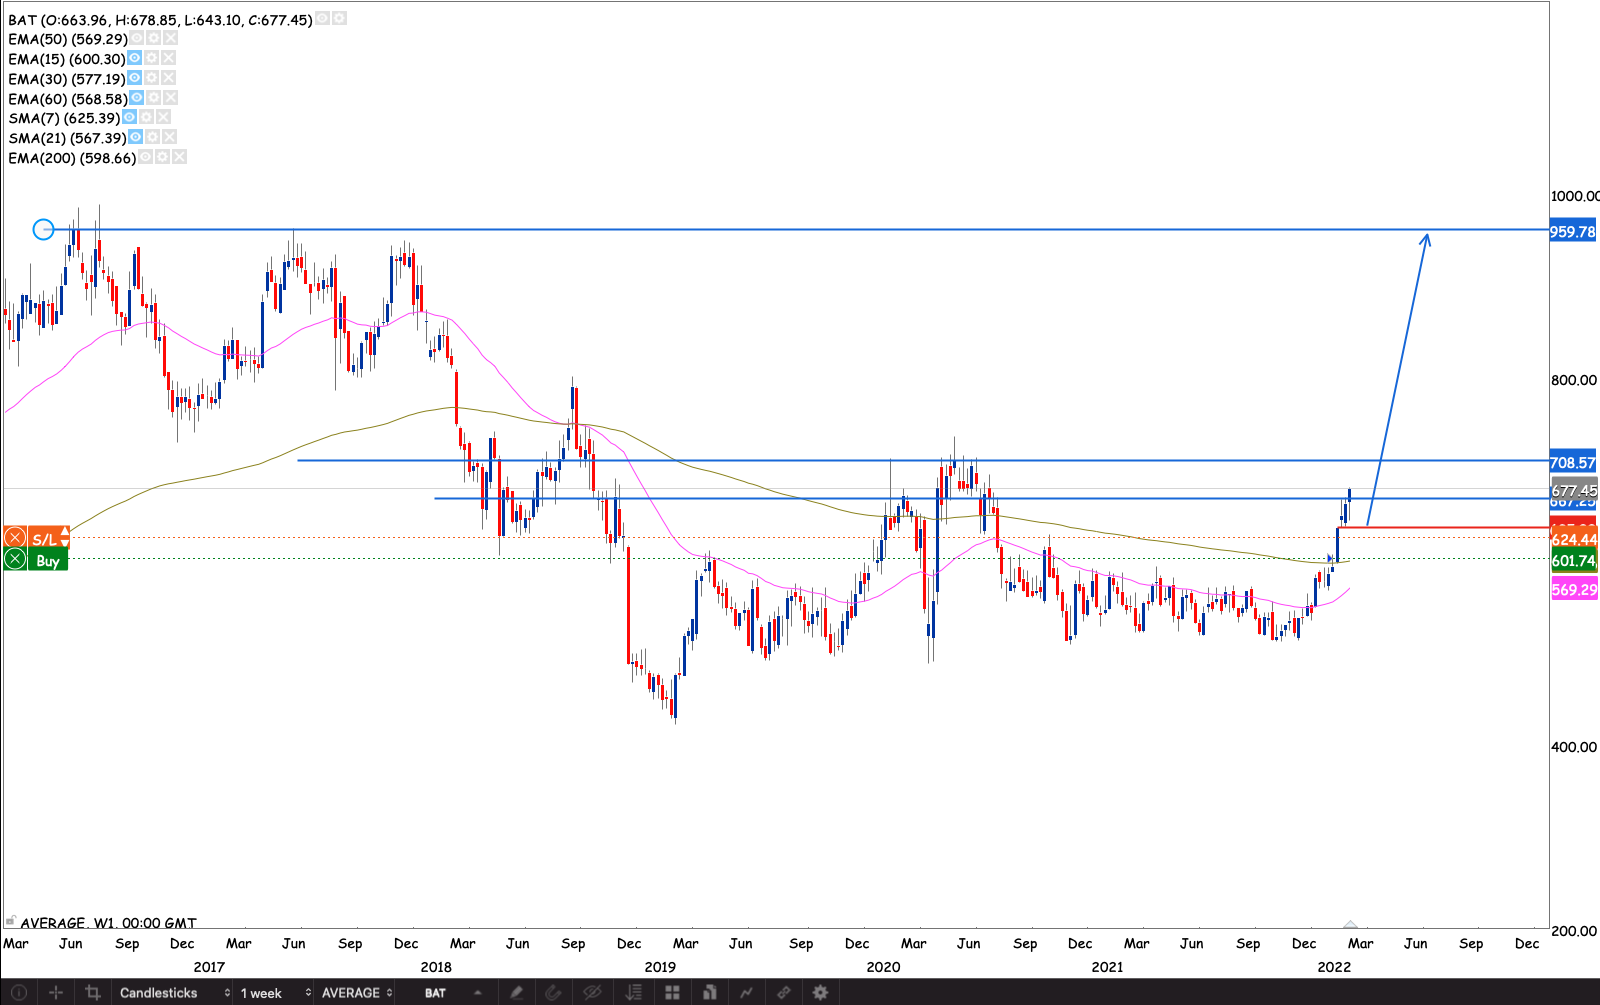
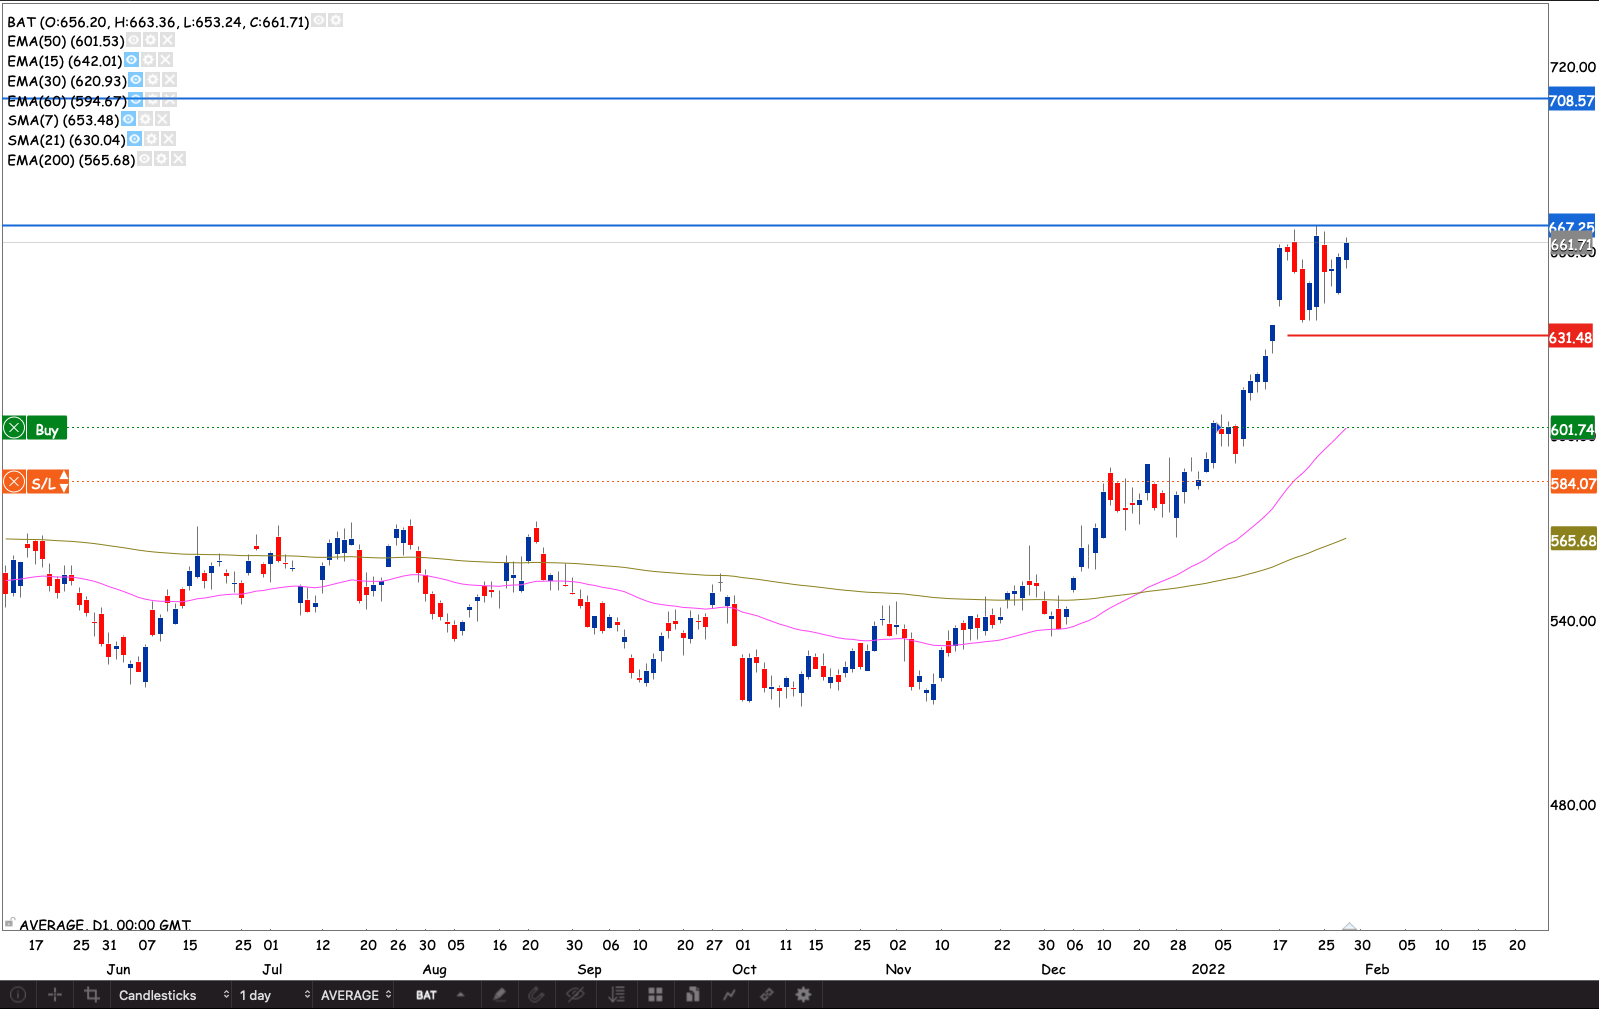
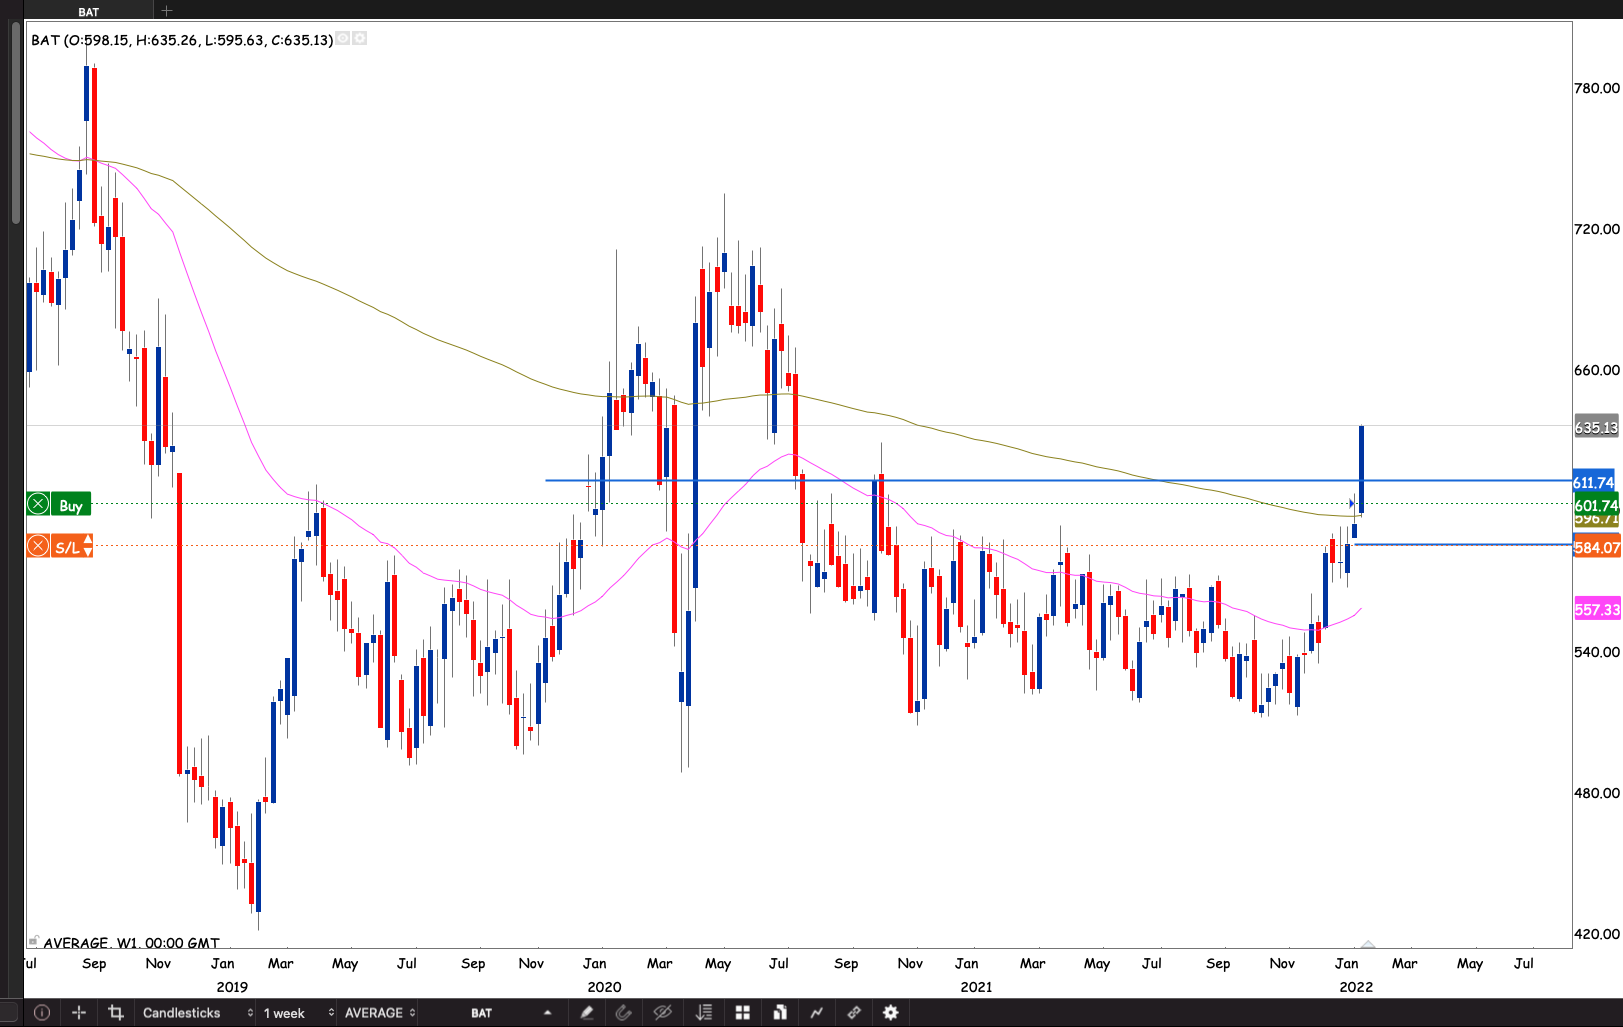
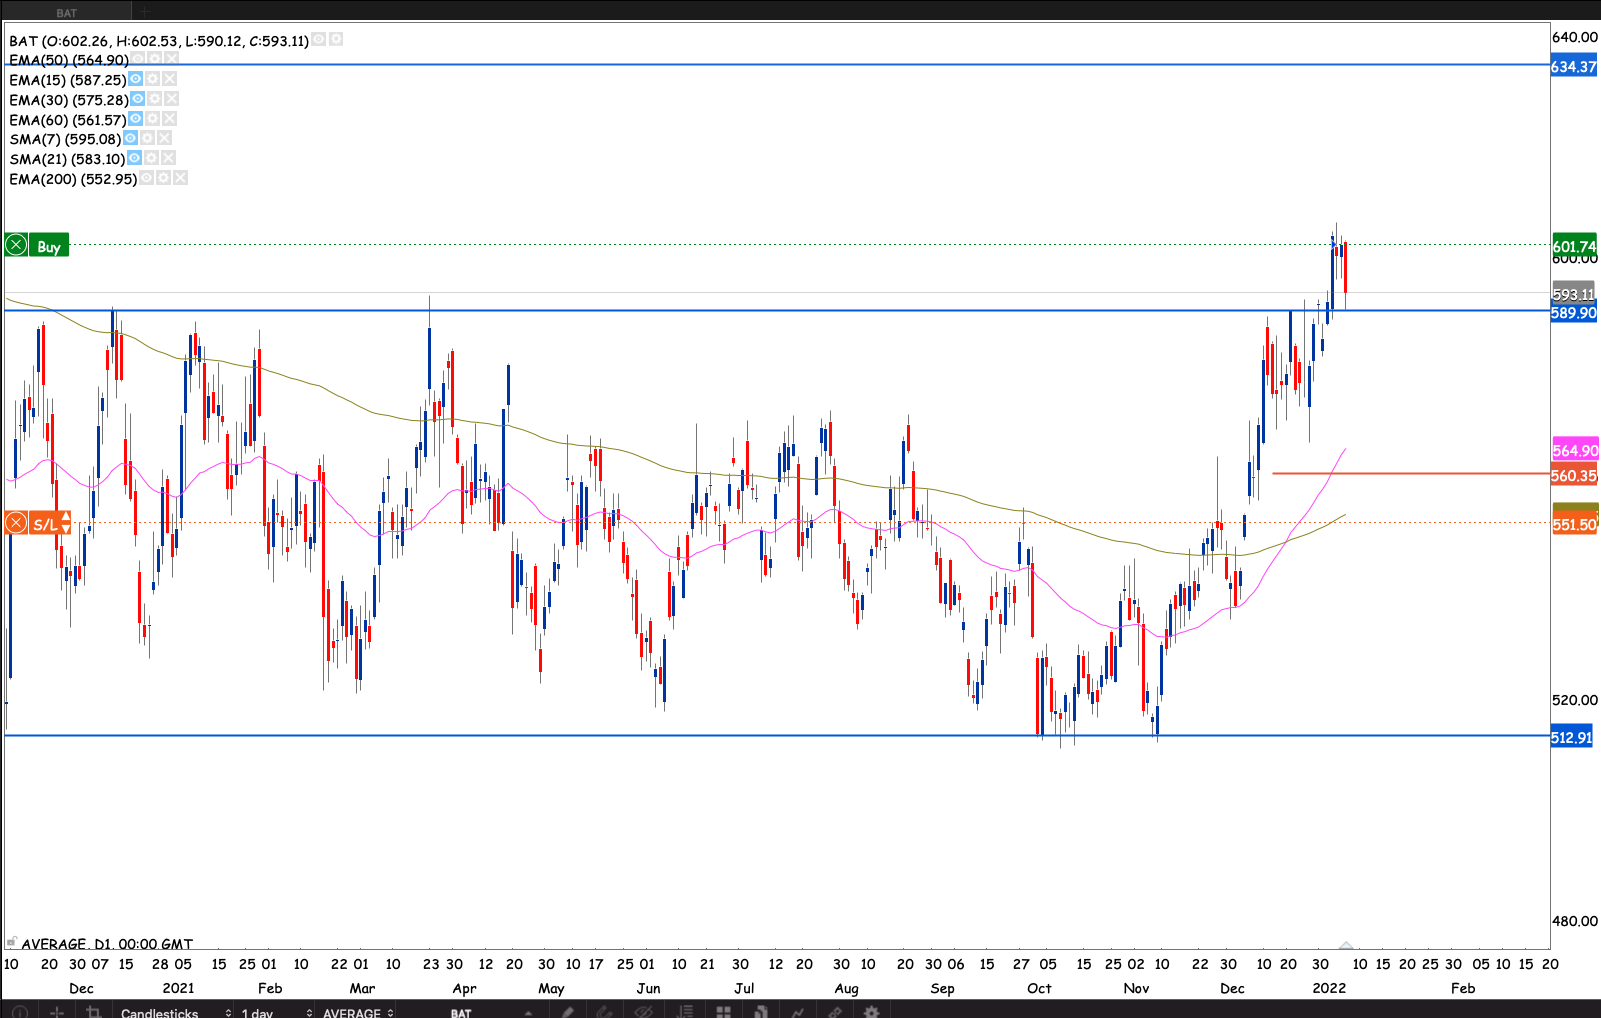
British American Tobacco
This week will be an interesting week, because historically R708 has been a very strong resistance. Will be looking to see if the share buy back will be enough to finally break R708. If so I will raise my stop and add to the position. Because that means we in R708 and R959 range
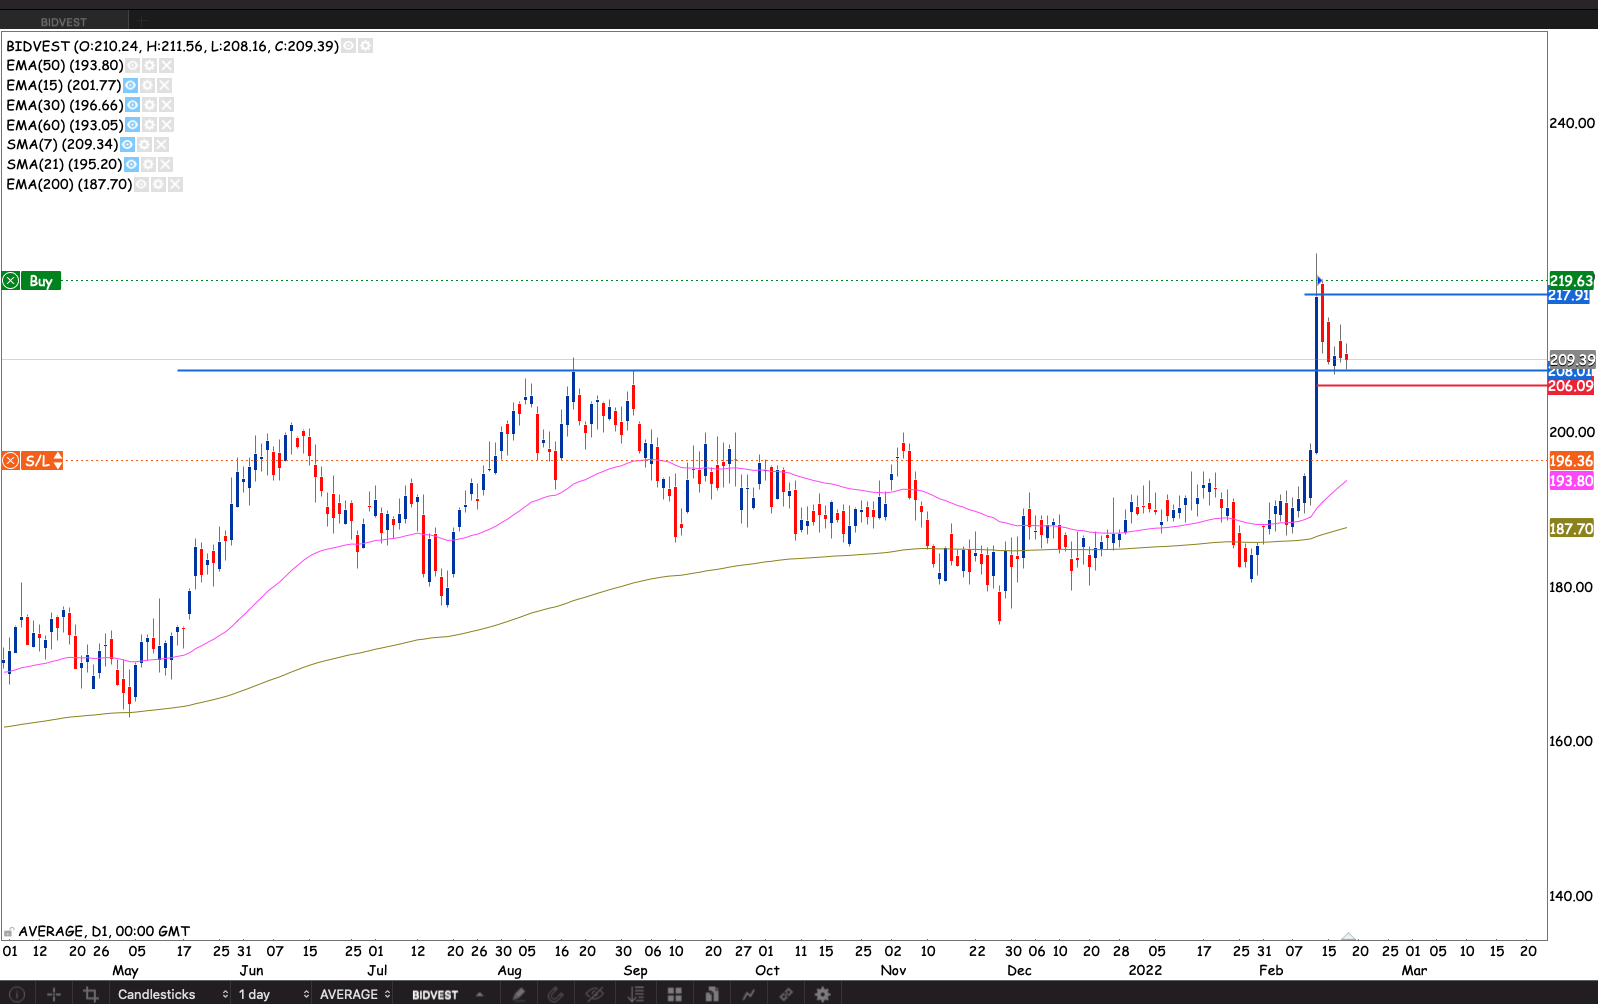
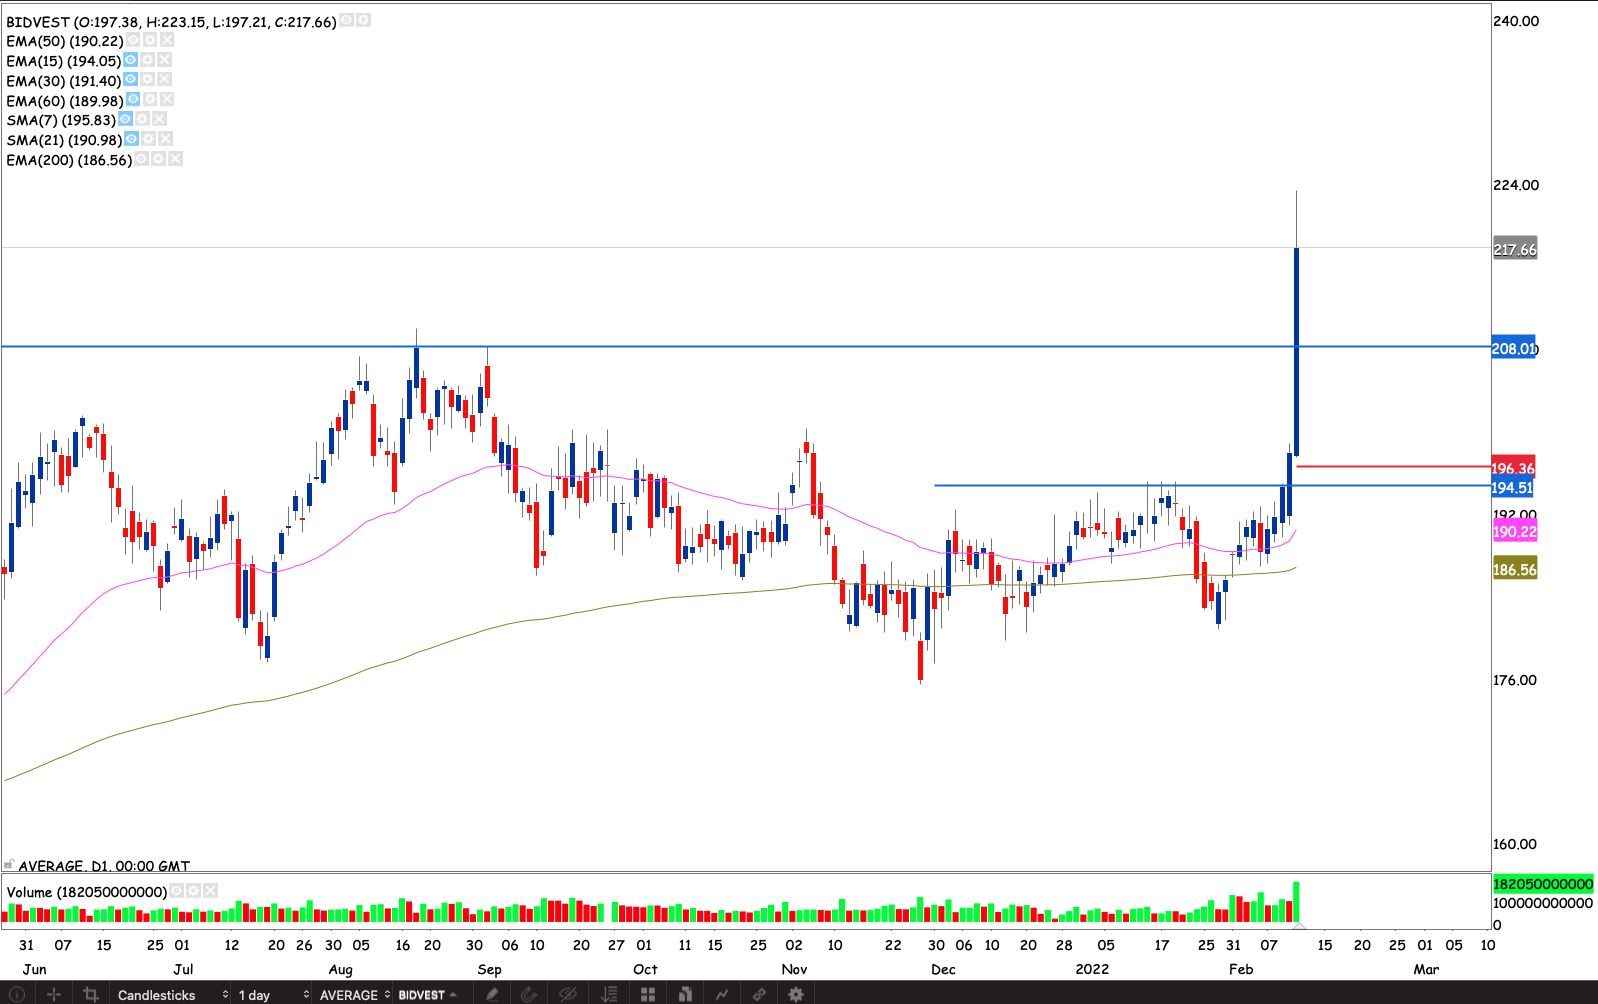
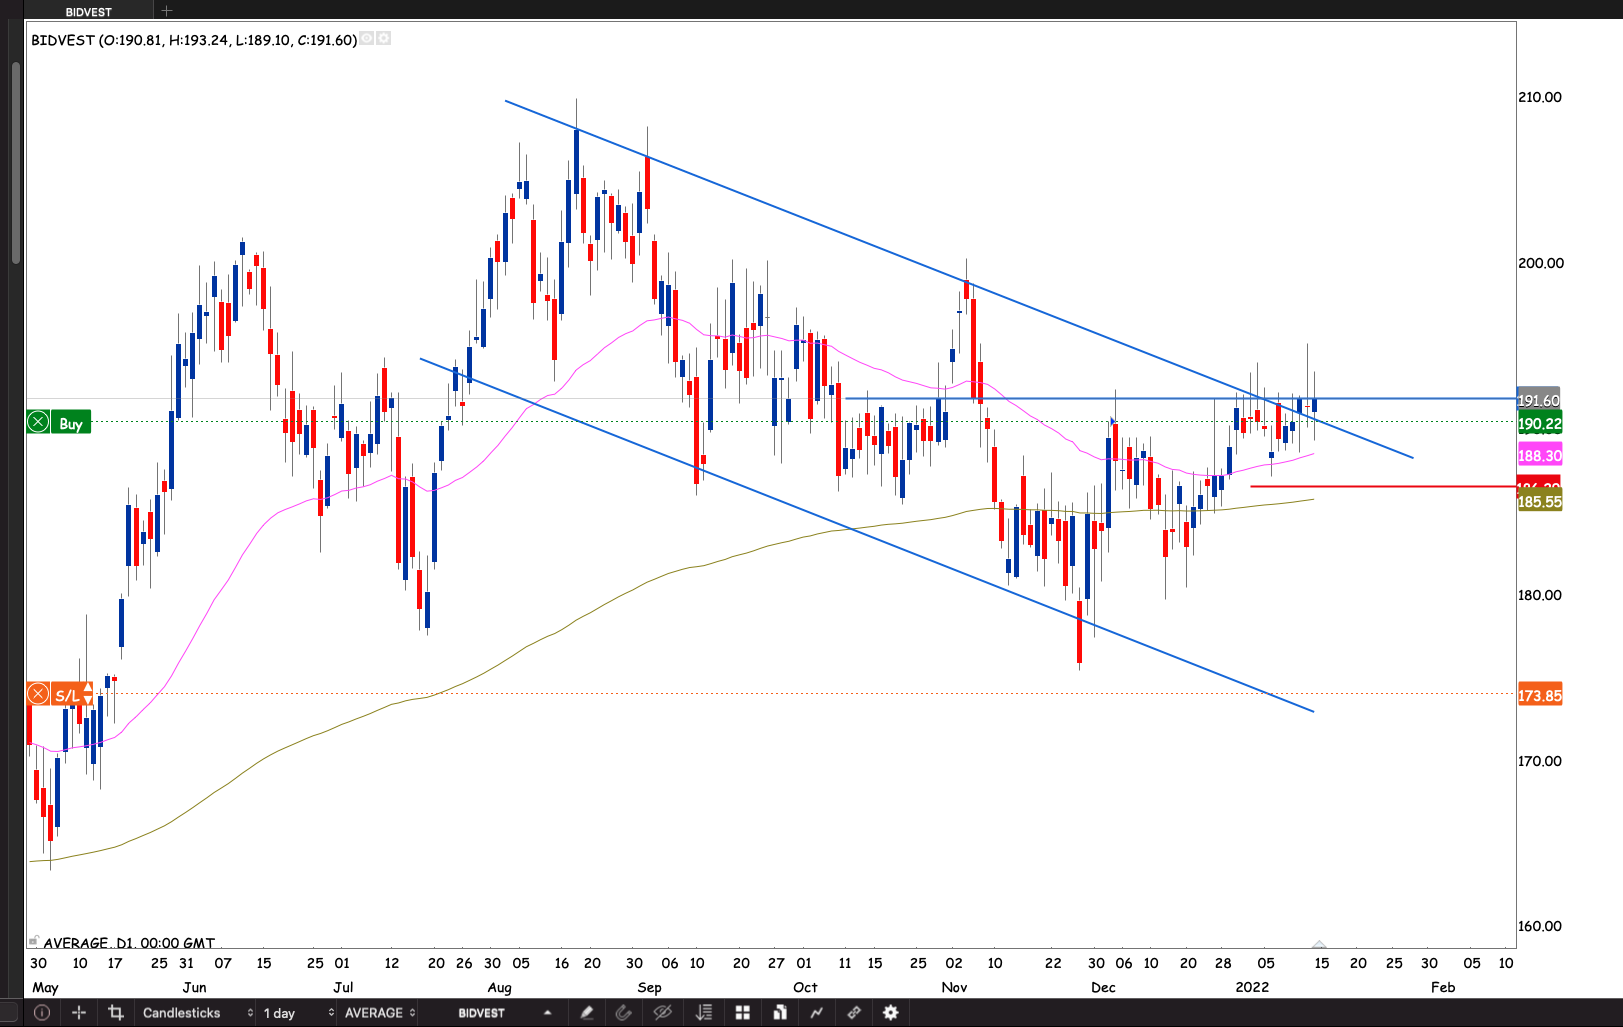
Bidvest
The stock had a strong breakout after the company came out with a trading statement on increased earnings on their interim results. HEPS is expected to increase by up to 40%. It came back to retest the R208 resistance. I suspect old bulls were stuck with a loss for a while and are happy to take a small profit or break even. I expect the R208 level to be old.
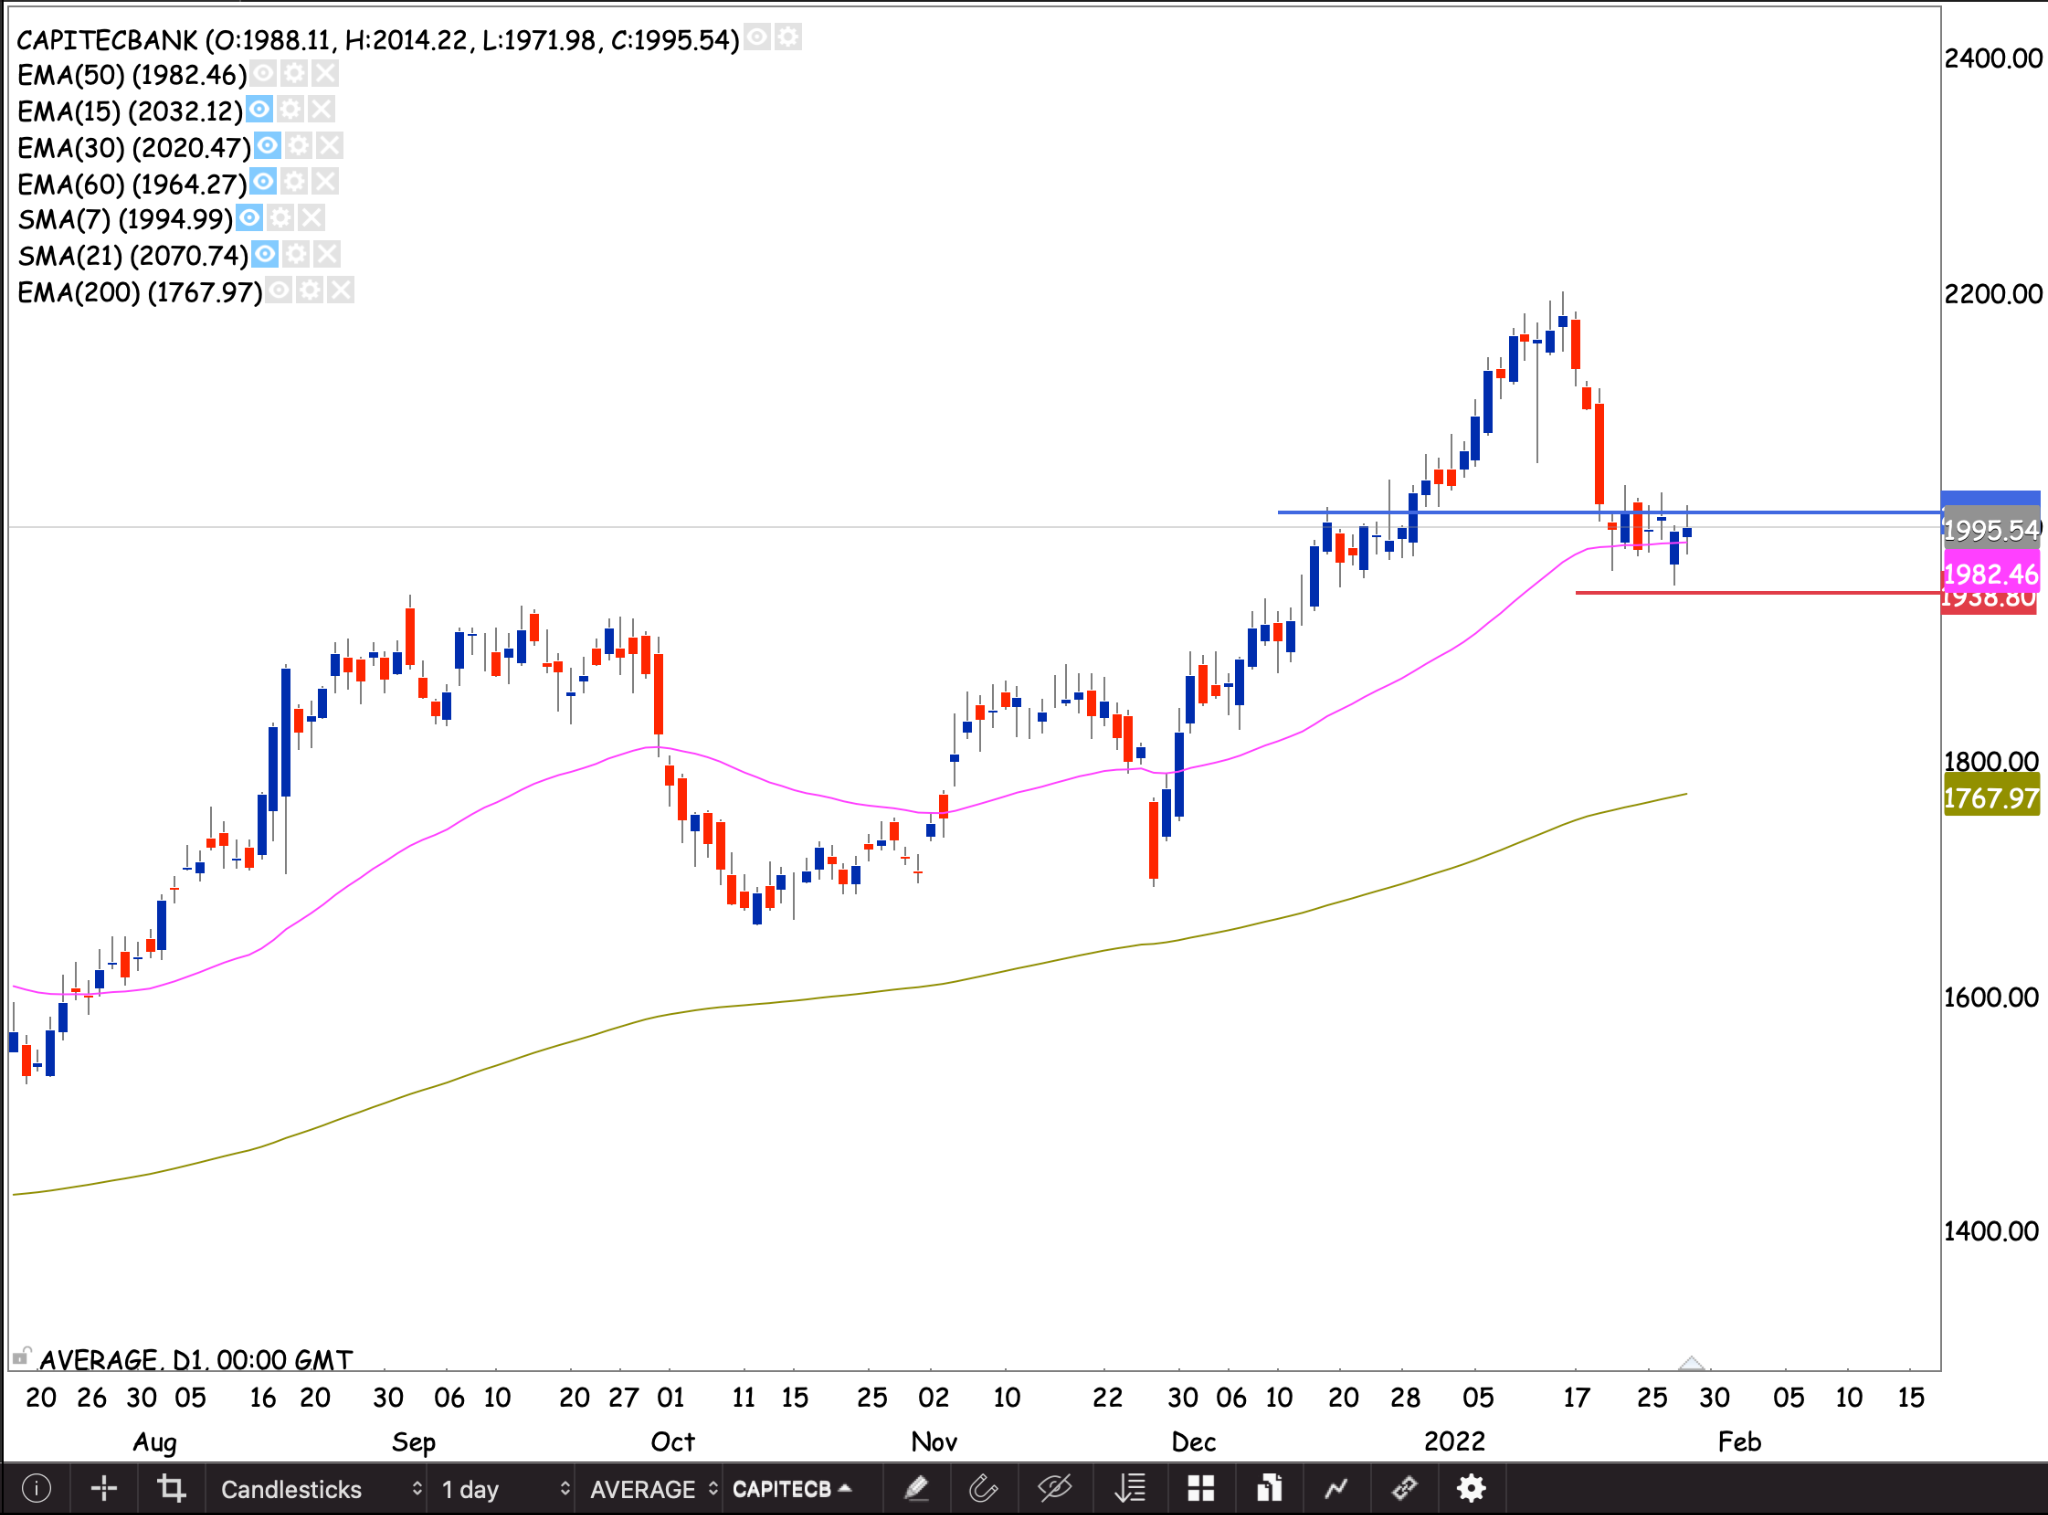
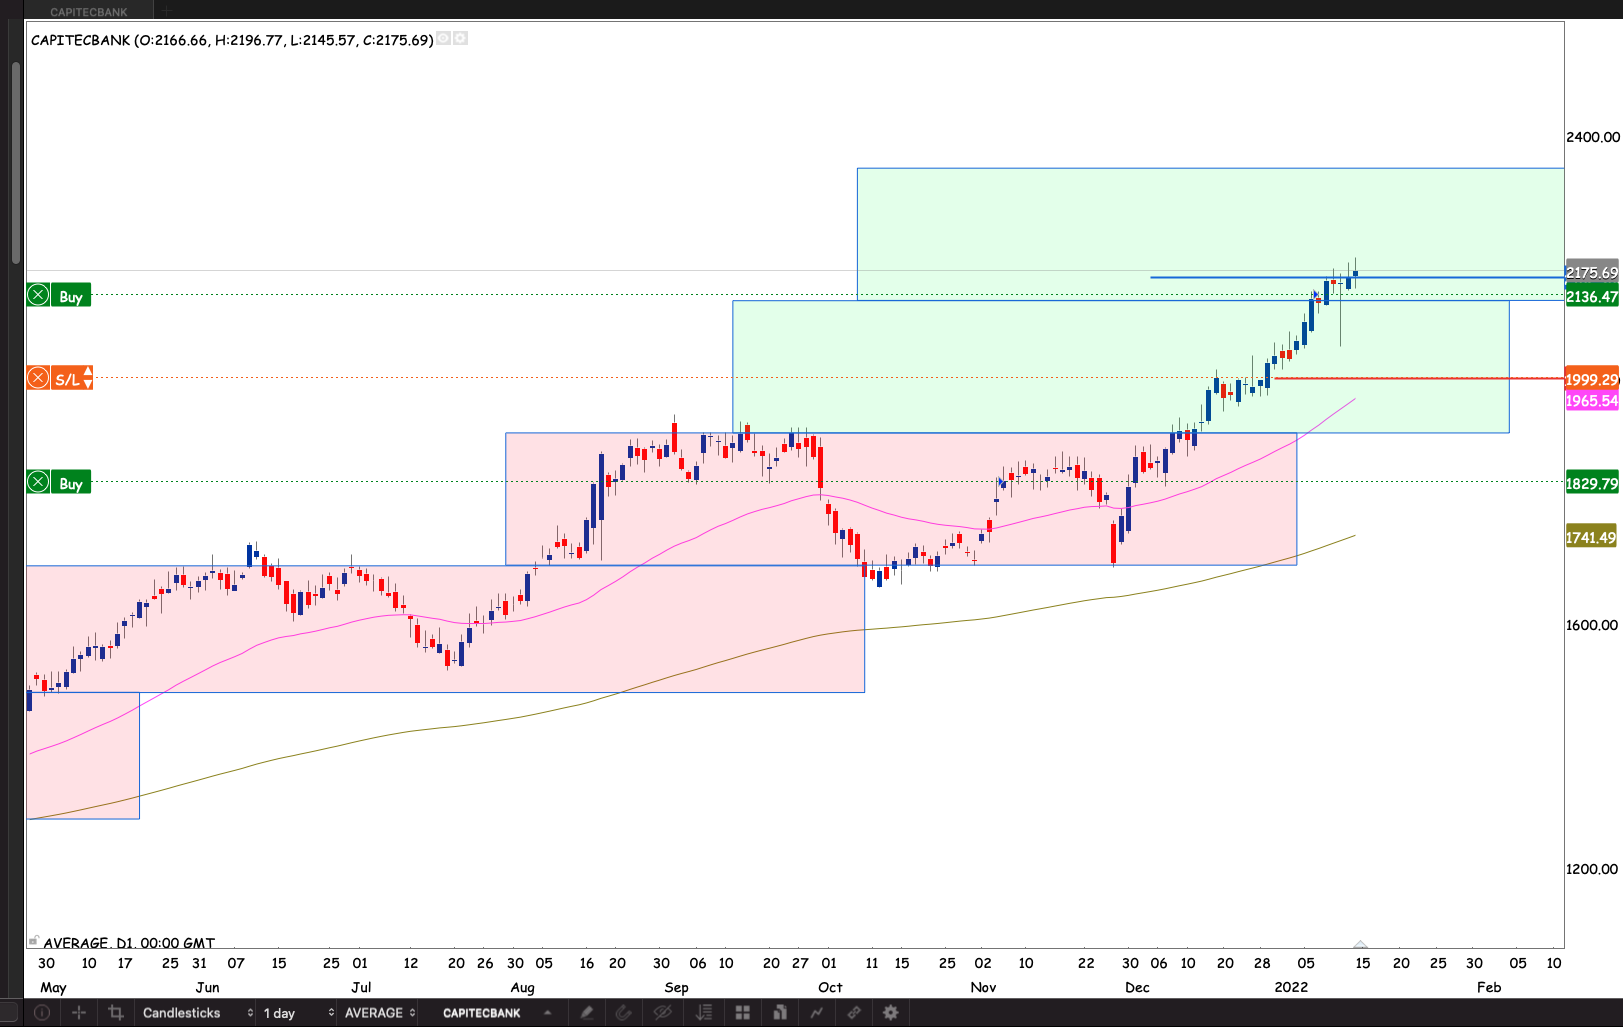
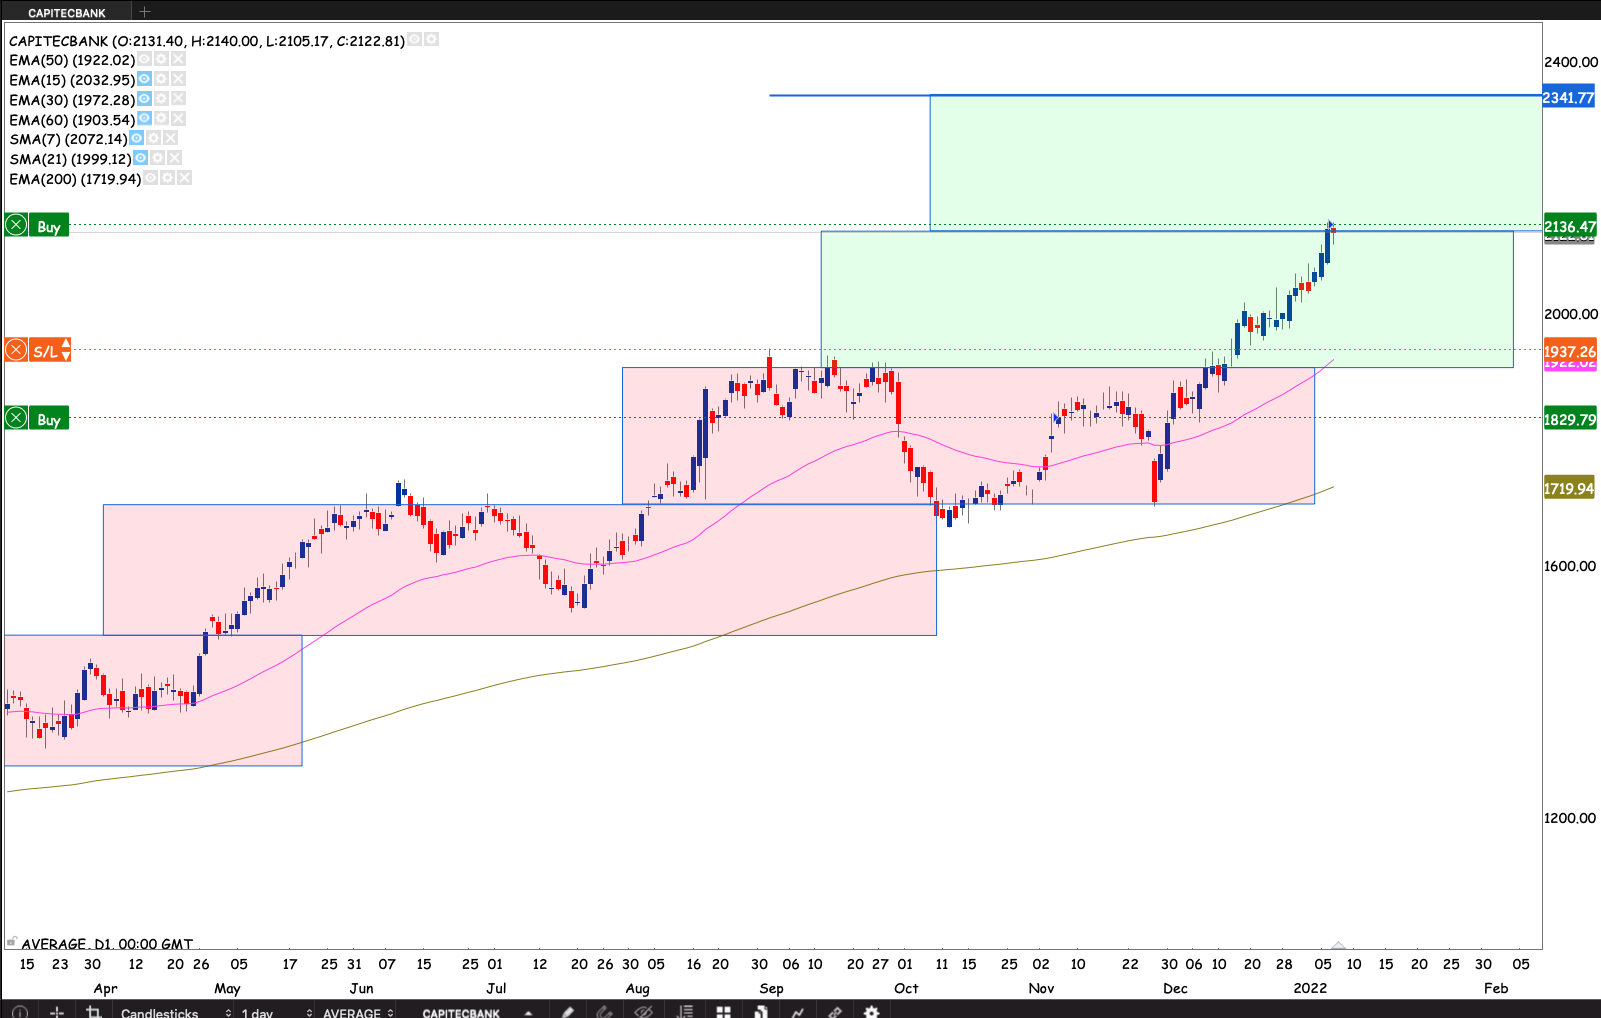
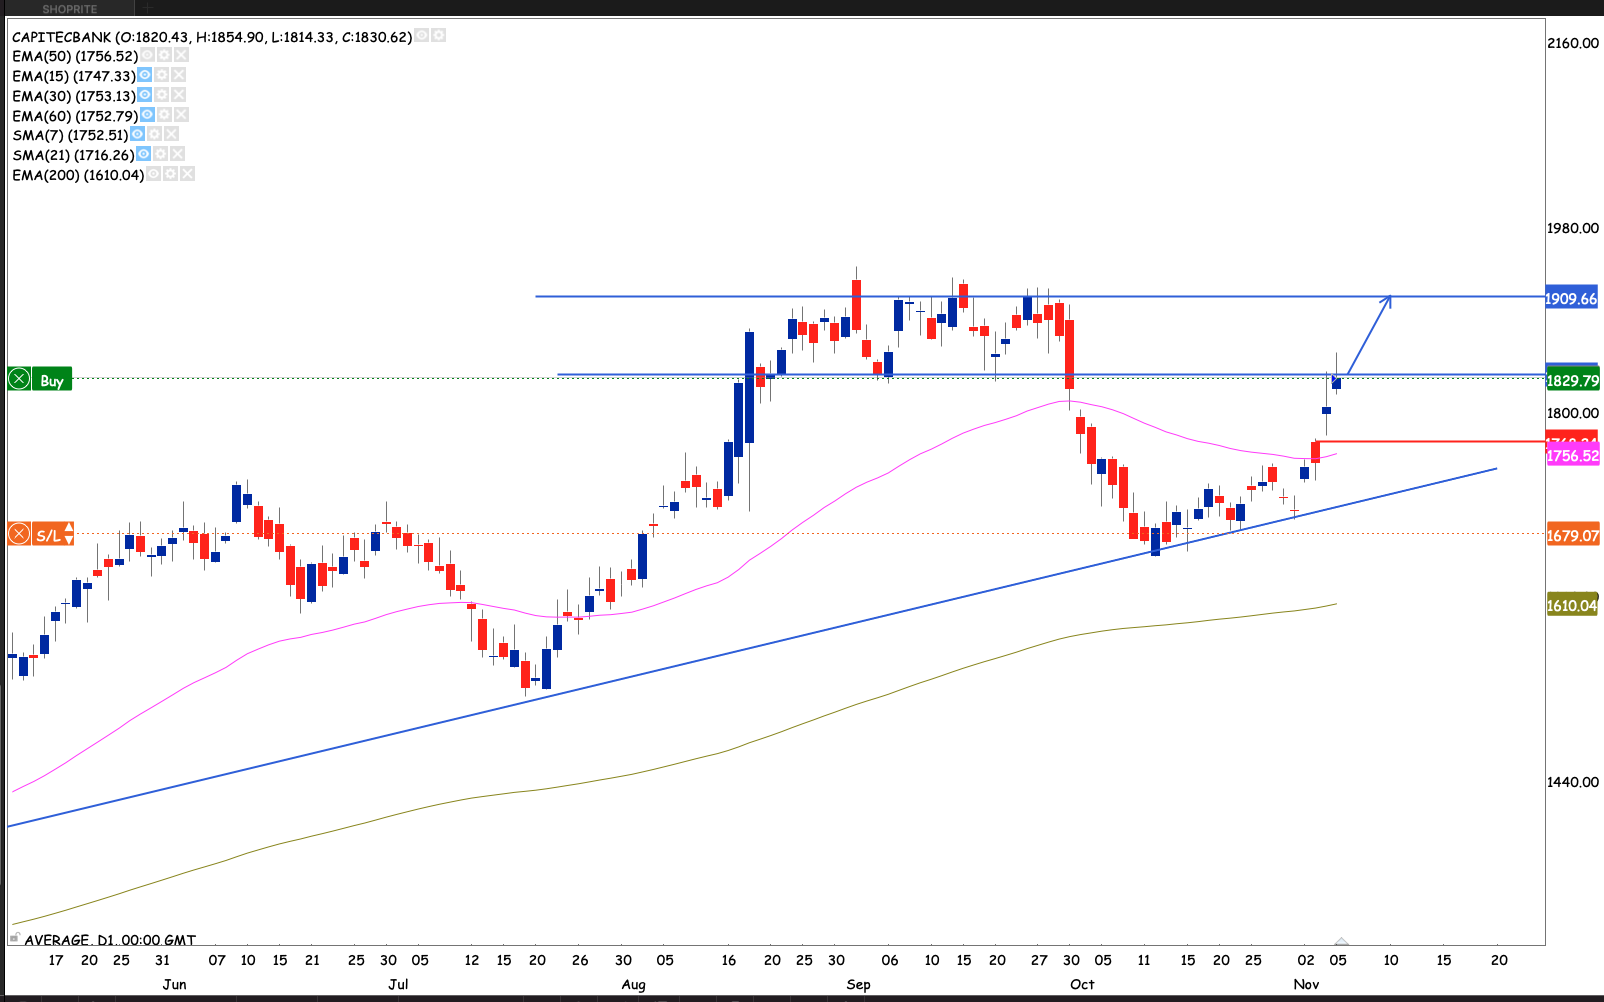
Capitec
The bank came with an update expecting an increase in HEPS for between 80%-82%. Market was rather flat on the news. The stock has been in a symmetrical triangle pattern for some time now. Now that the market has had the weekend to digest the trading update. I will be interested to see how the market responds this coming week. I am waiting for a breakout from the triangle pattern to raise my stop and perhaps add to my position.

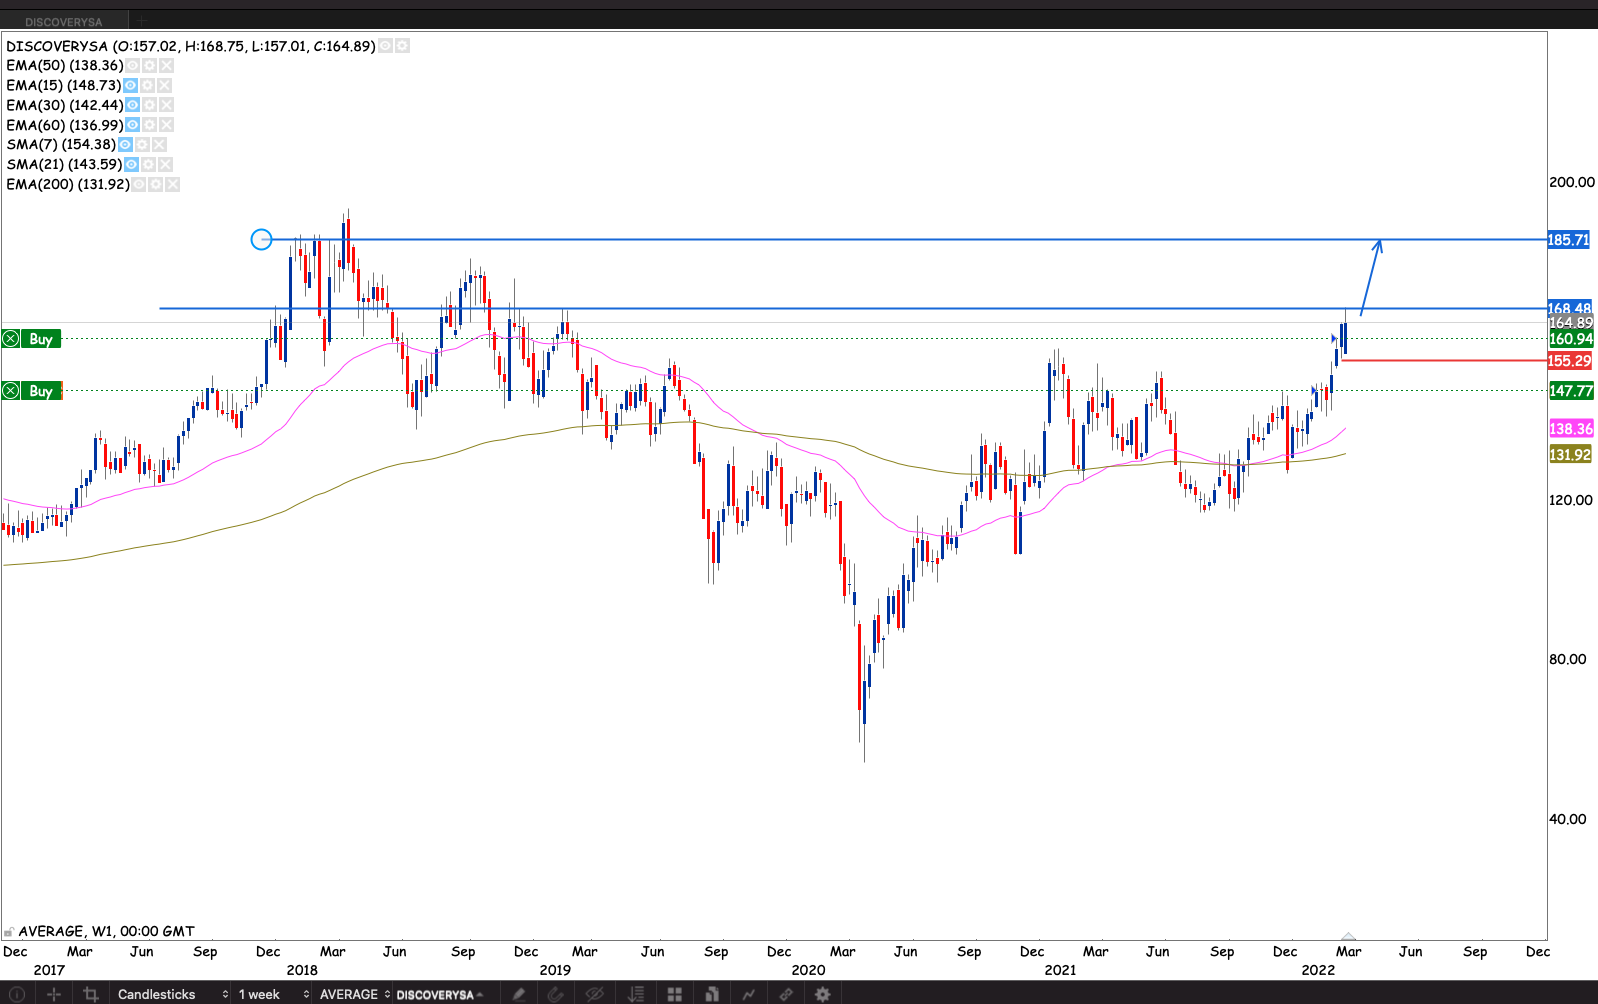
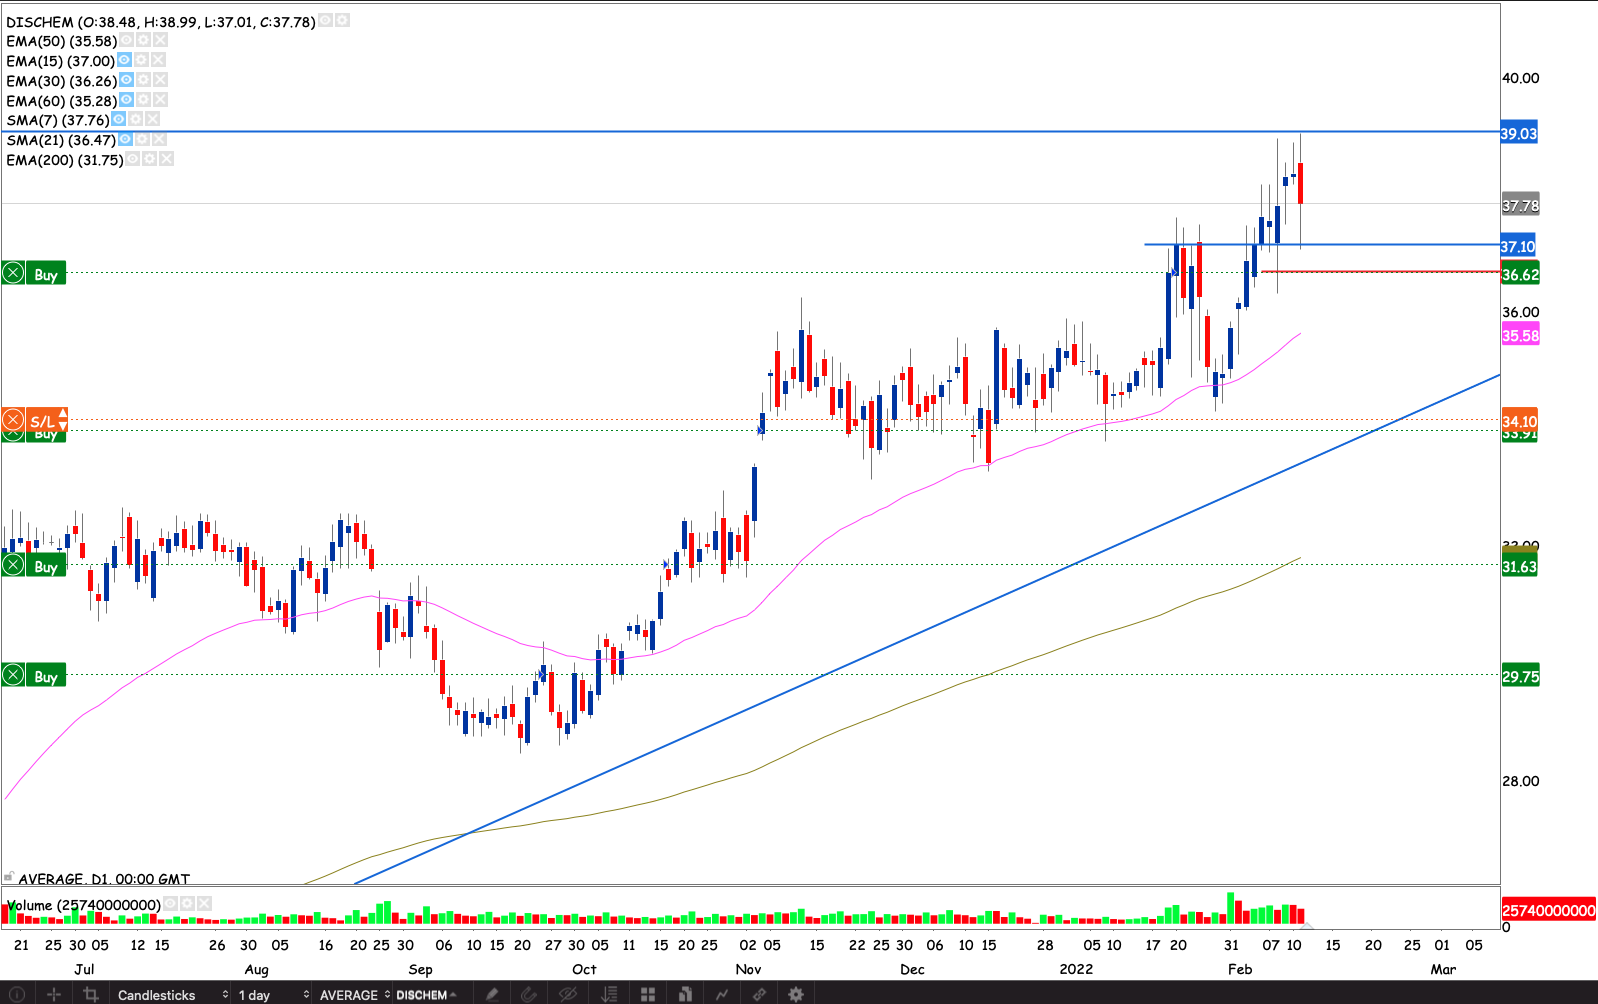
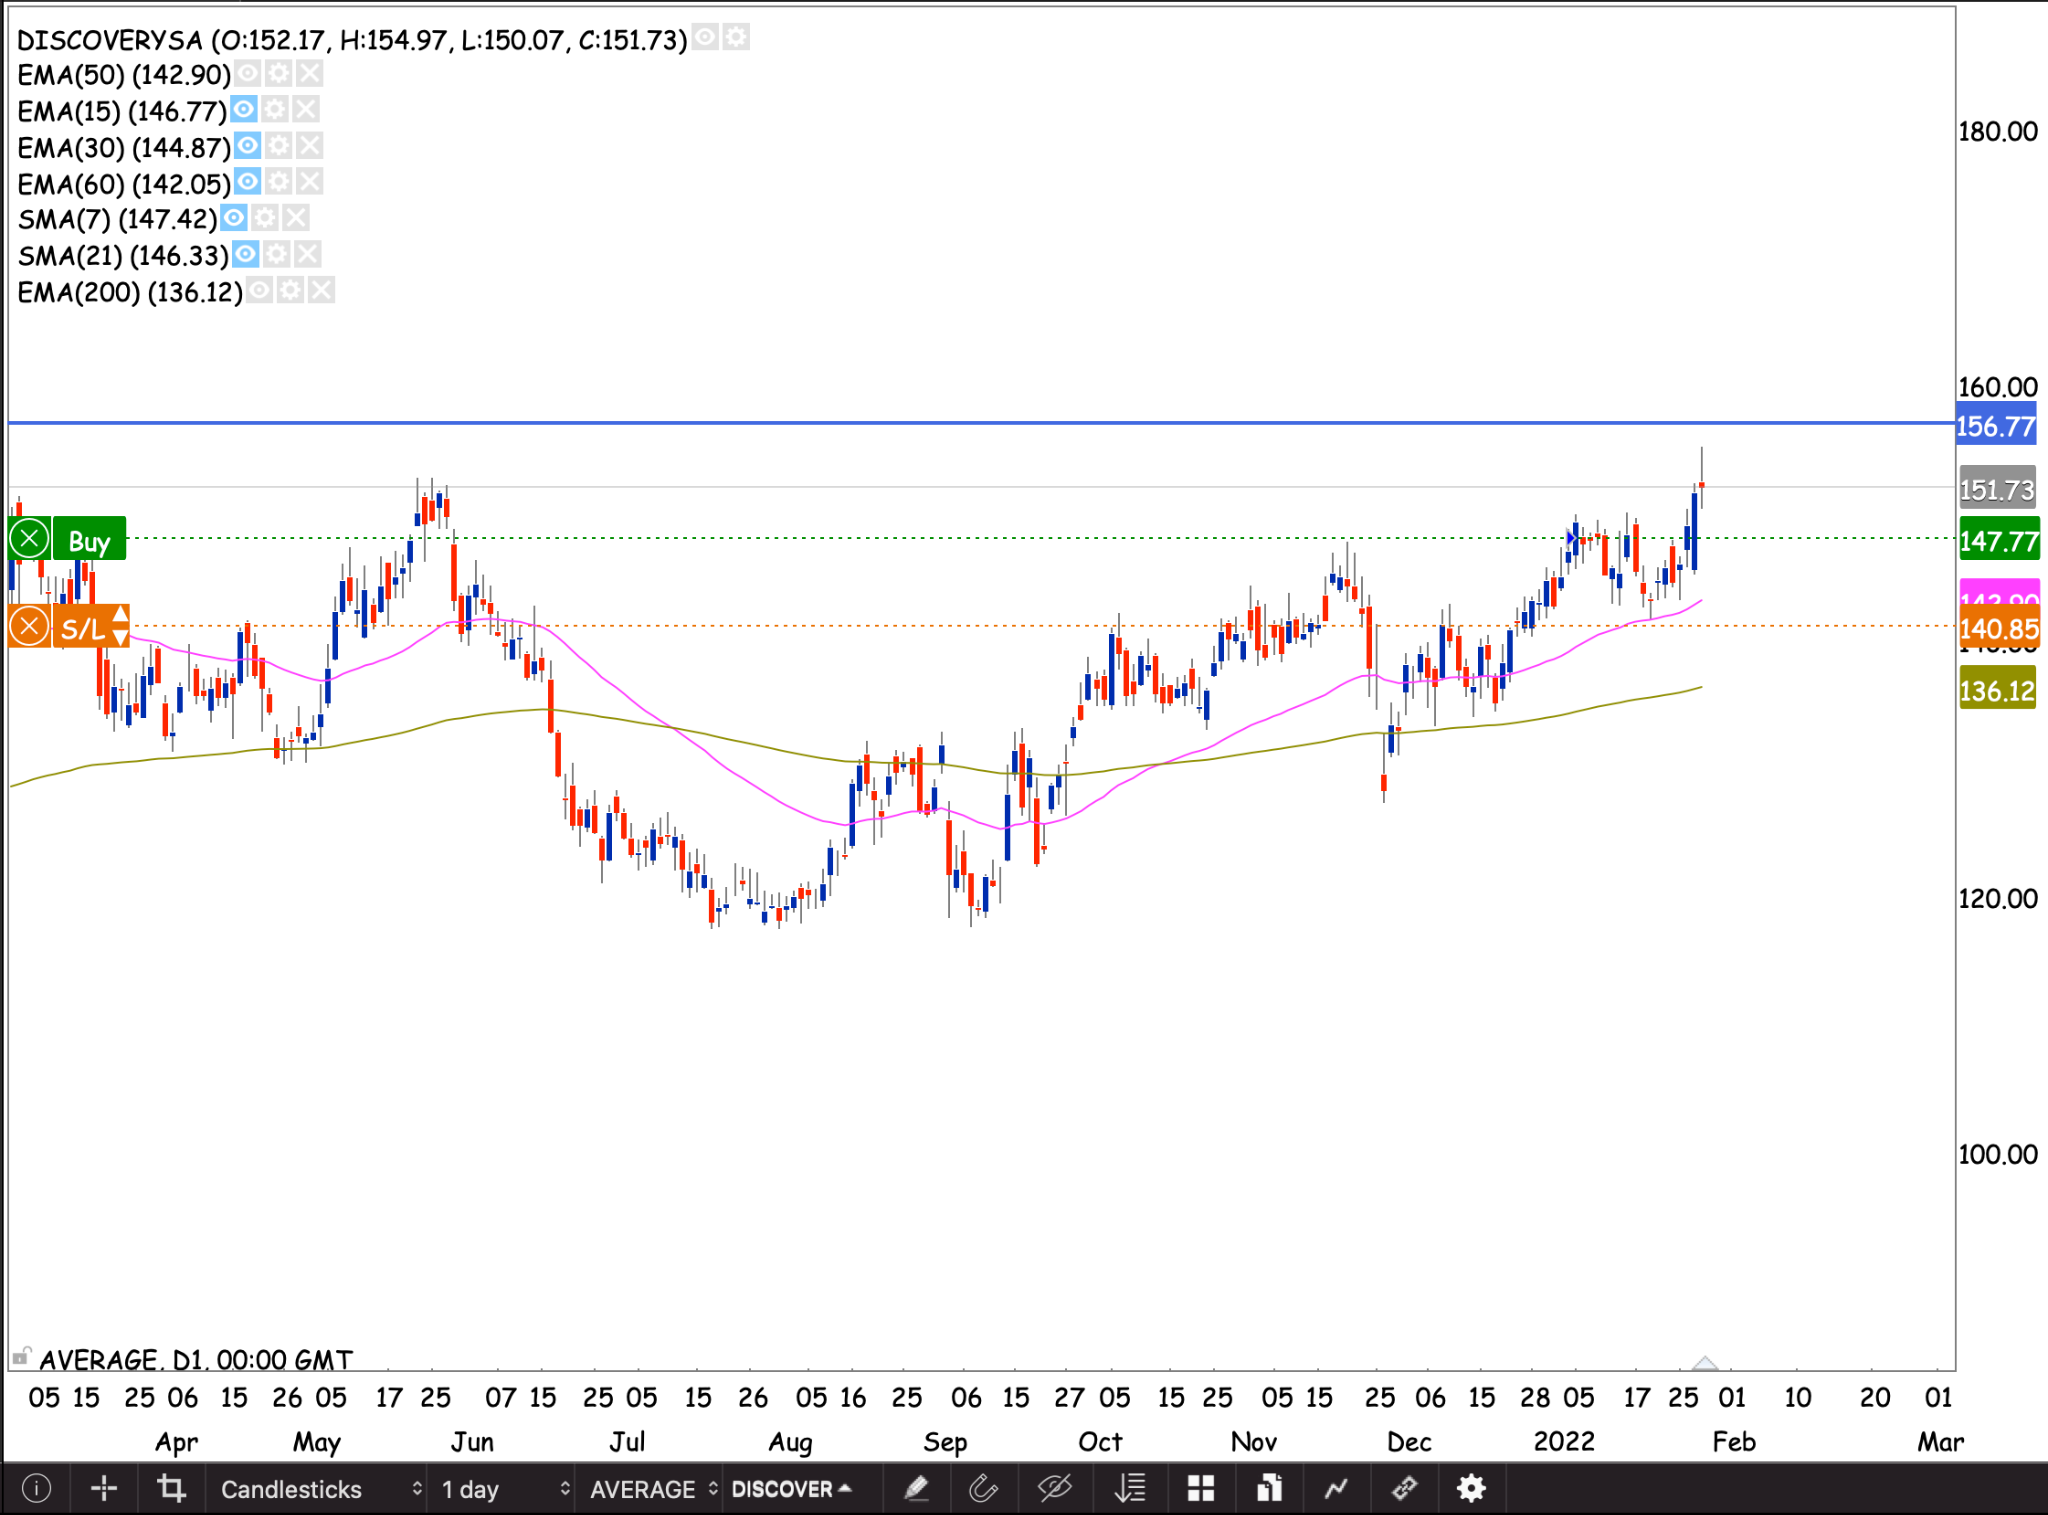
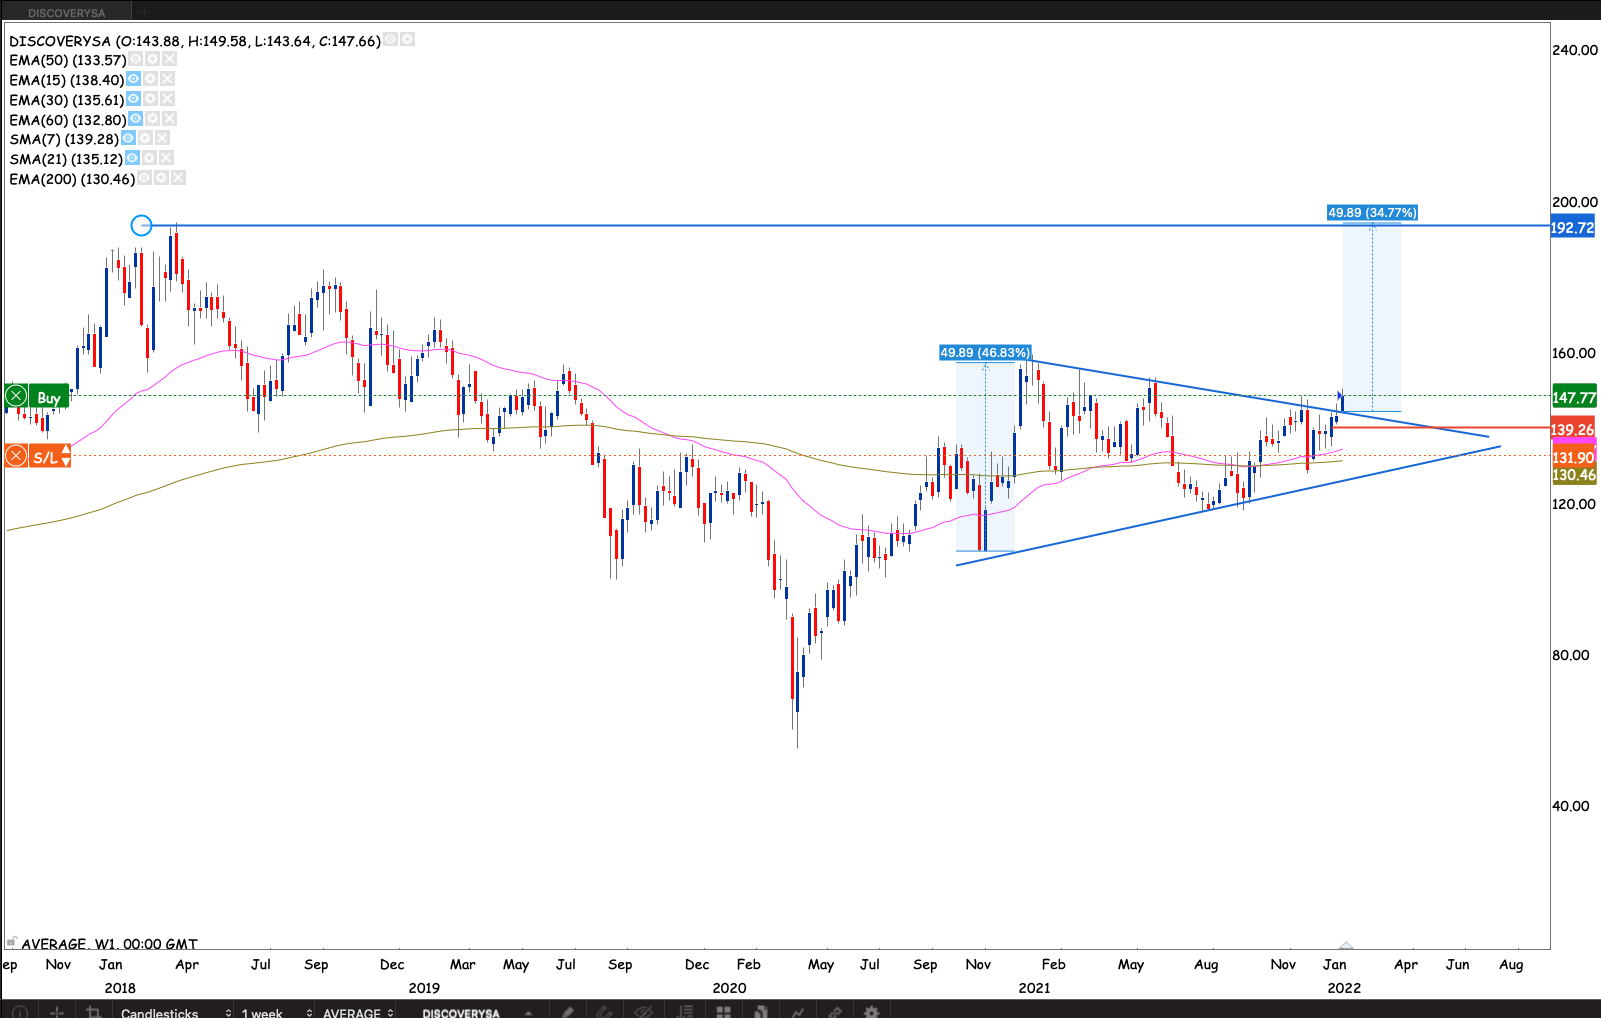
Discovery
The market memory phenomena came through again. Discovery, remembering the R168 price, found some selling after breaking from a symmetrical triangle pattern. I’ve been building a position in this stock. If the market breaks R168 I will raise my stop loss. Watching for opportunities to add to my position. If the market is to break R185, my goal is still holding and sitting with a risk free position.
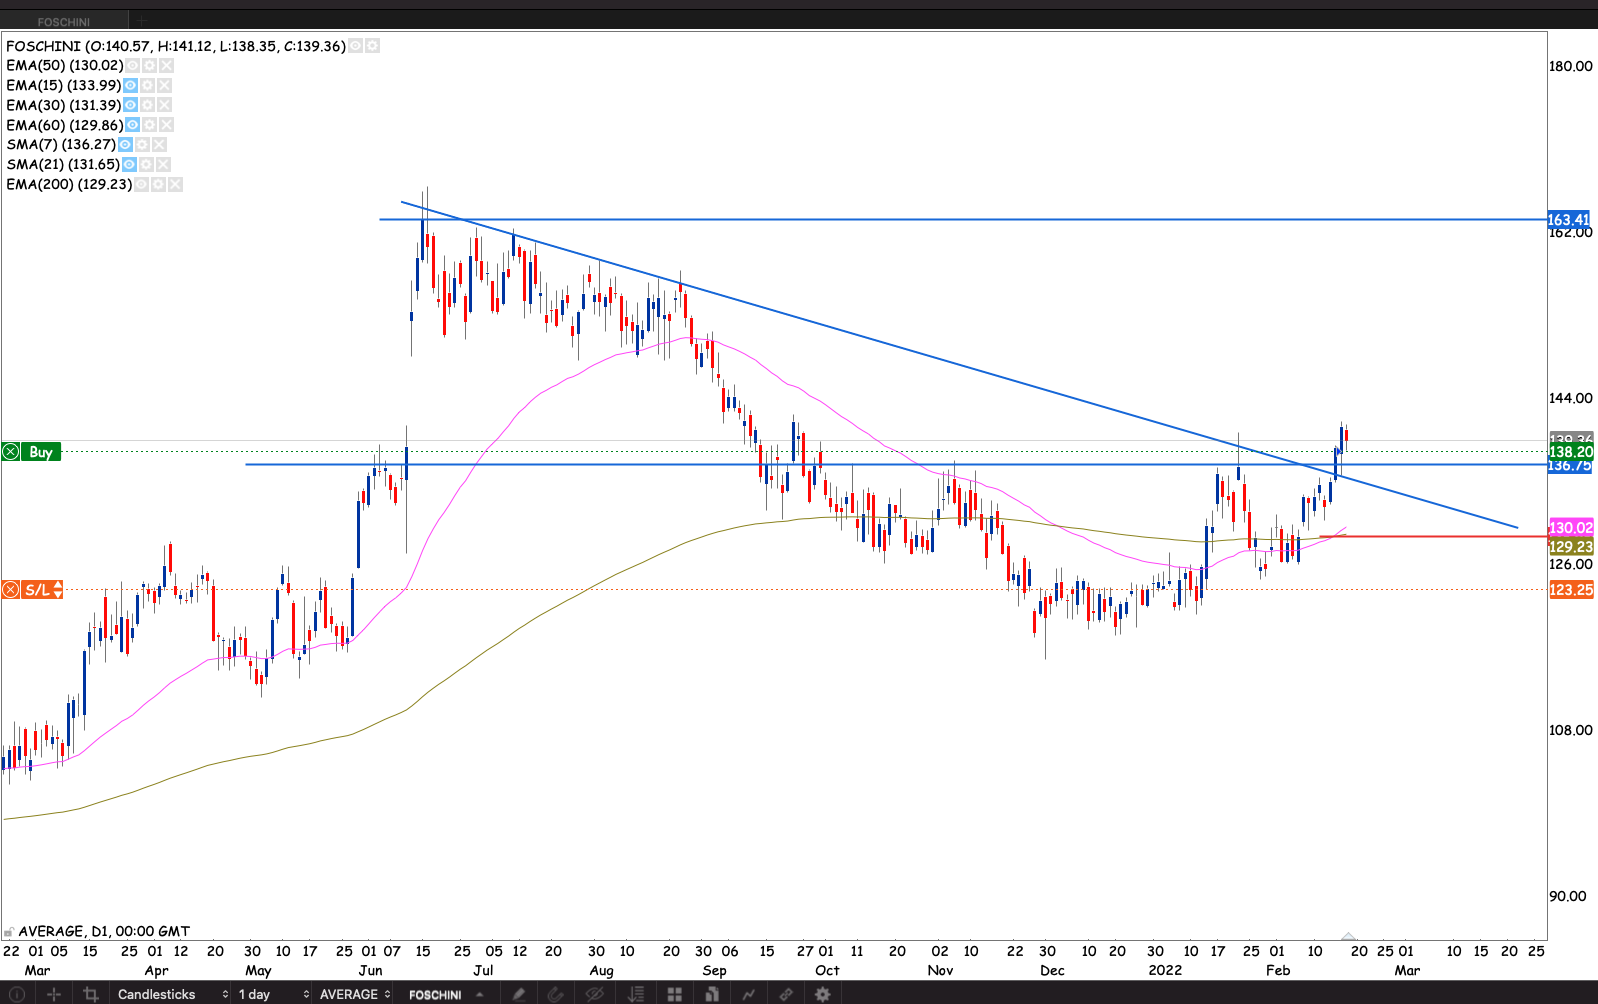
Foschini
The stock finally broke the R136 resistance and the down trendline resistance. With a golden cross at the back. And few overhead resistance to speak off. We could see a quick run up on the stock chasing the R163 prior highs.
Mr Price.
Mr Price entered what could be a R217 – R273 range. The company has results coming in May, and has made good acquisitions. If they come with strong numbers that would be a catalyst to breaking R237. For now the stock us tugging R217

Remgro
The stock moved to a higher box. It’s still struggling with entry. I will monitor price action and reactions on the higher box. I’m targeting R138 as a level to place a stop loss.

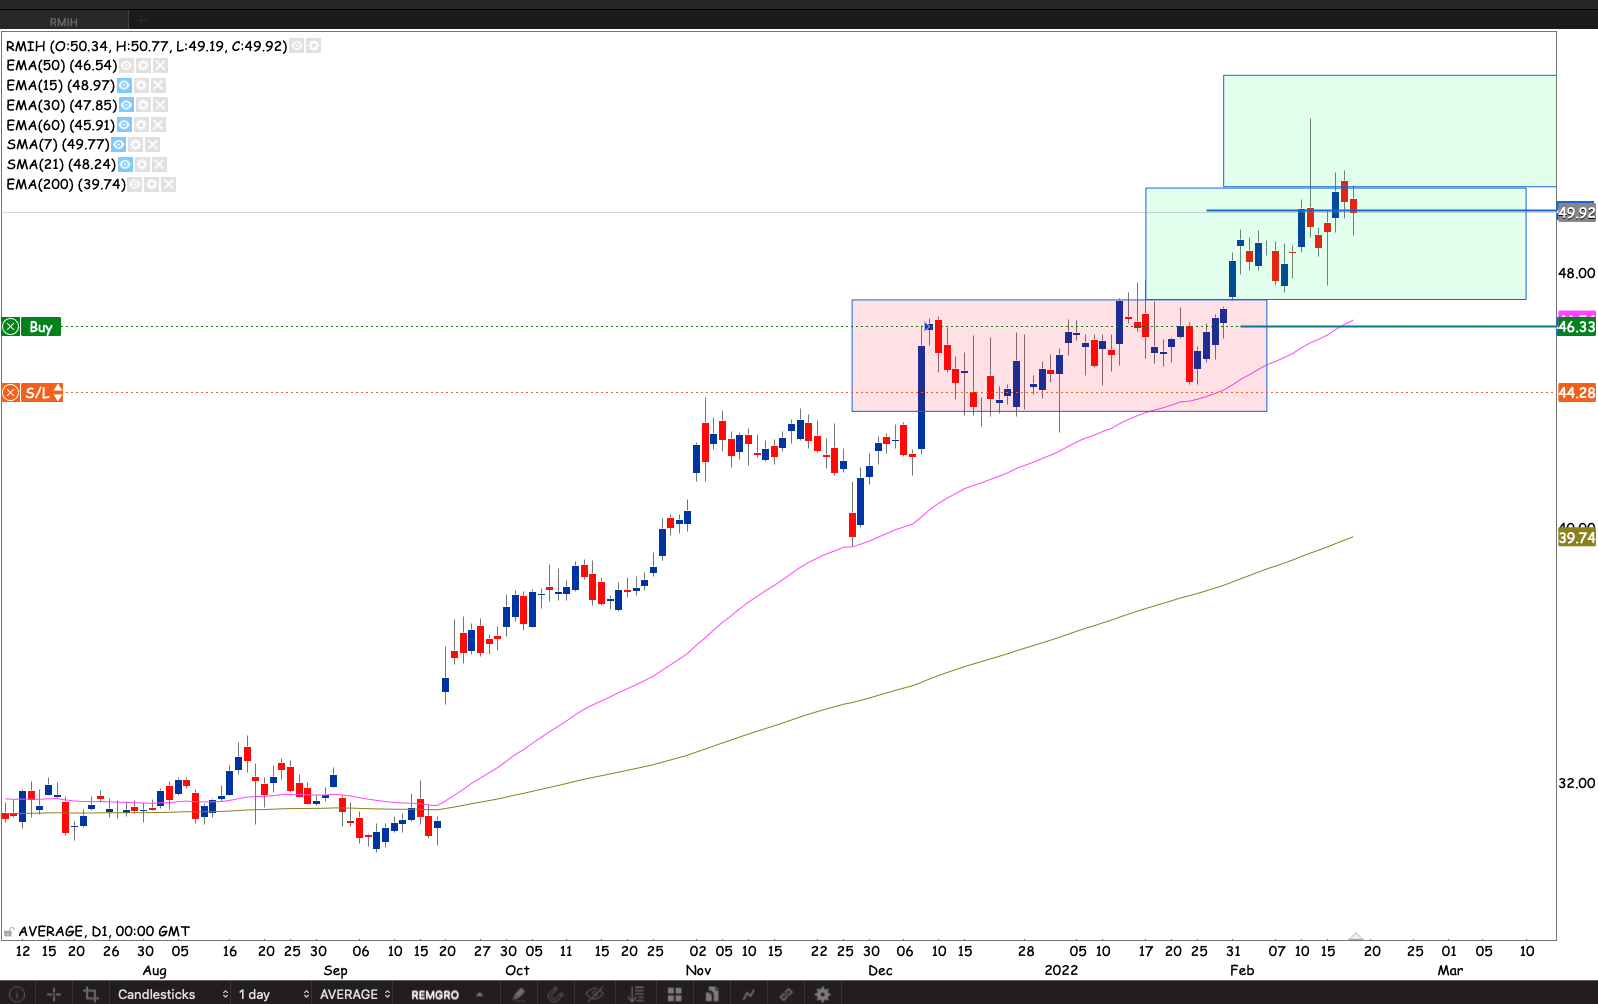
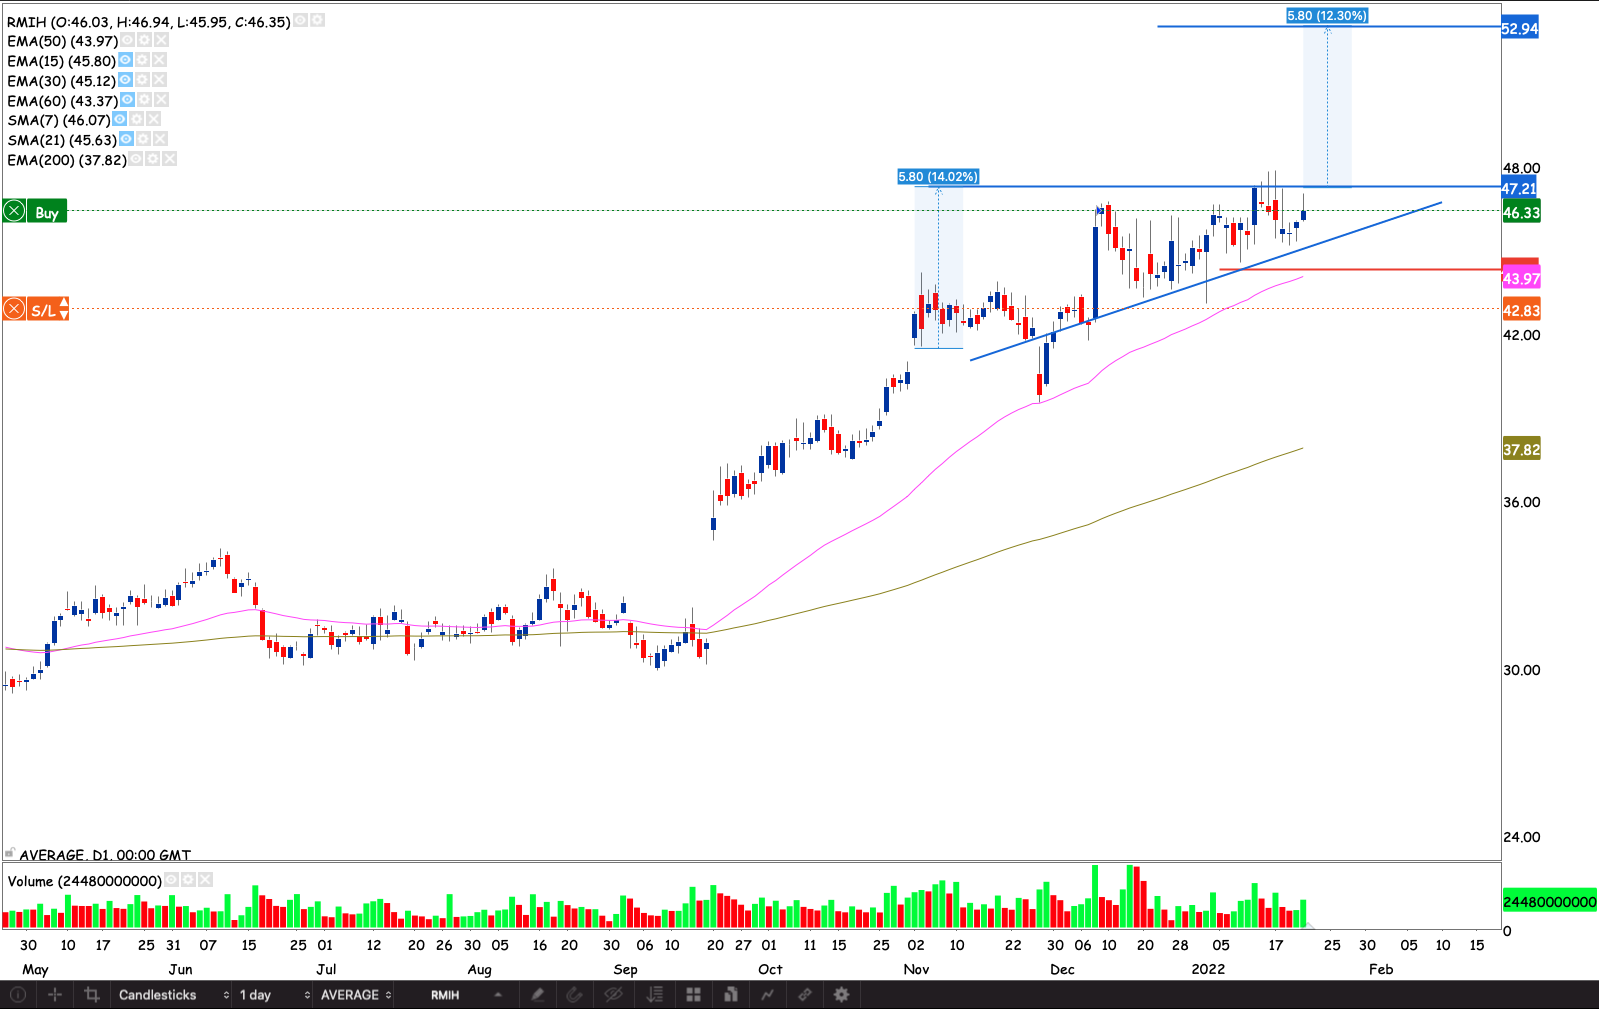
RMI
The stock flirted with the doors of the higher box without any success so far. If the market fails to penetrate to the higher box. Then we could see a retest of the 50 day EMA. However if the market breaks into the higher box I will raise my stop loss R46.30 just below the 50 day EMA. I don’t want my stop right in front of it
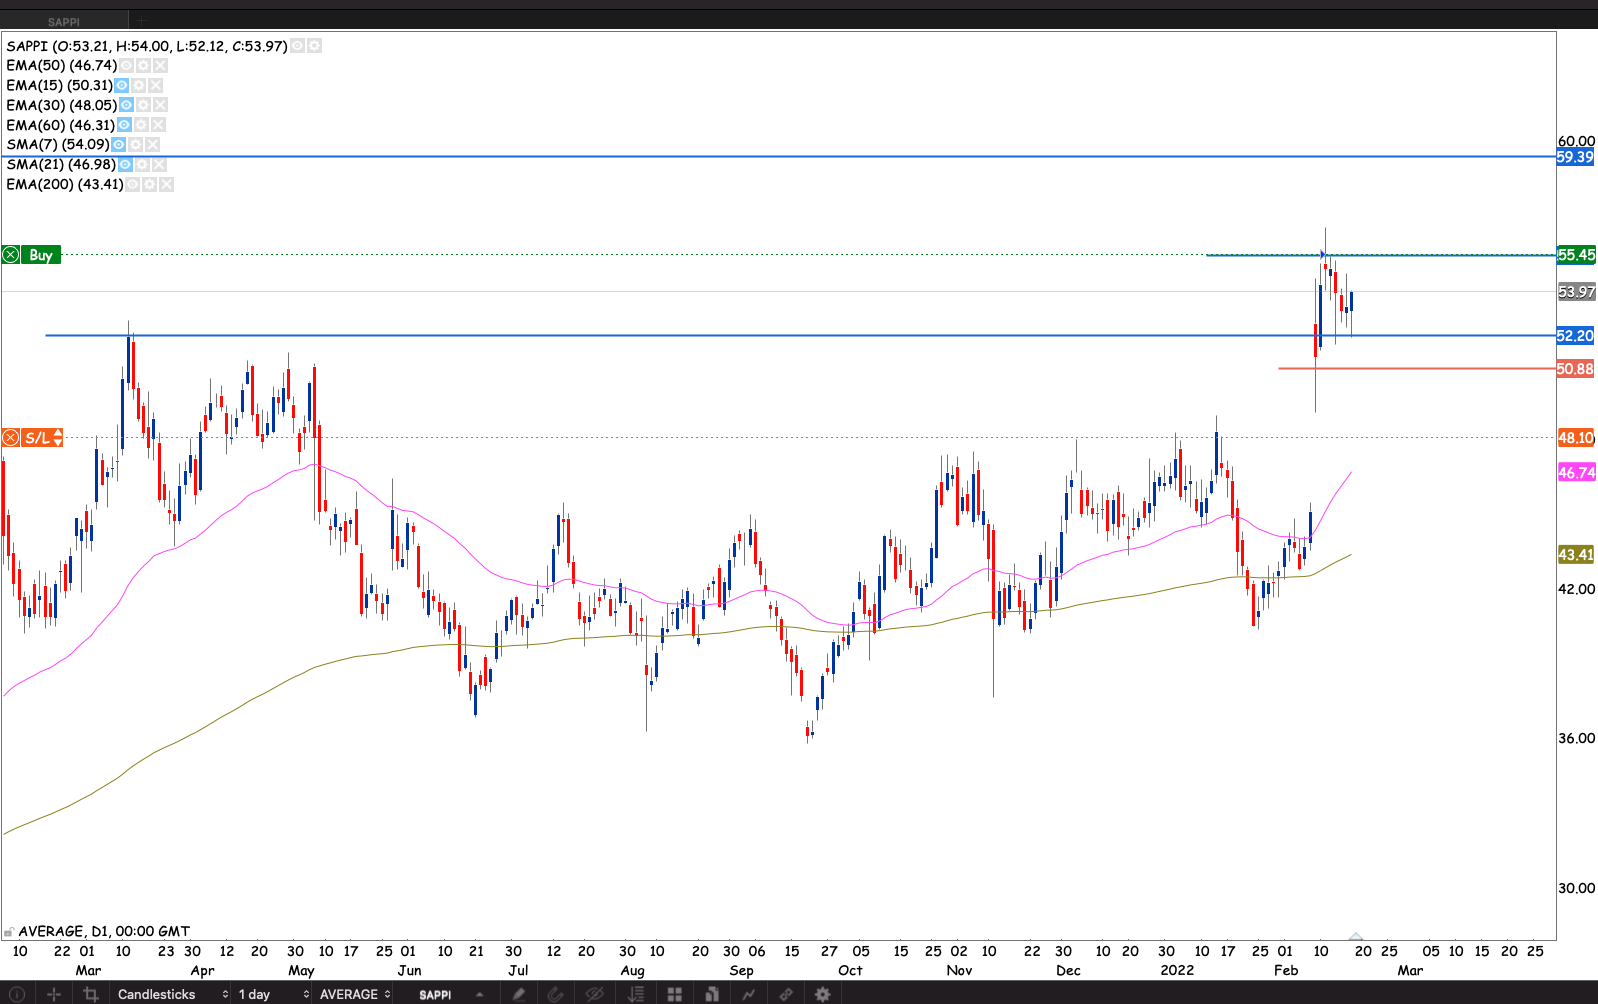
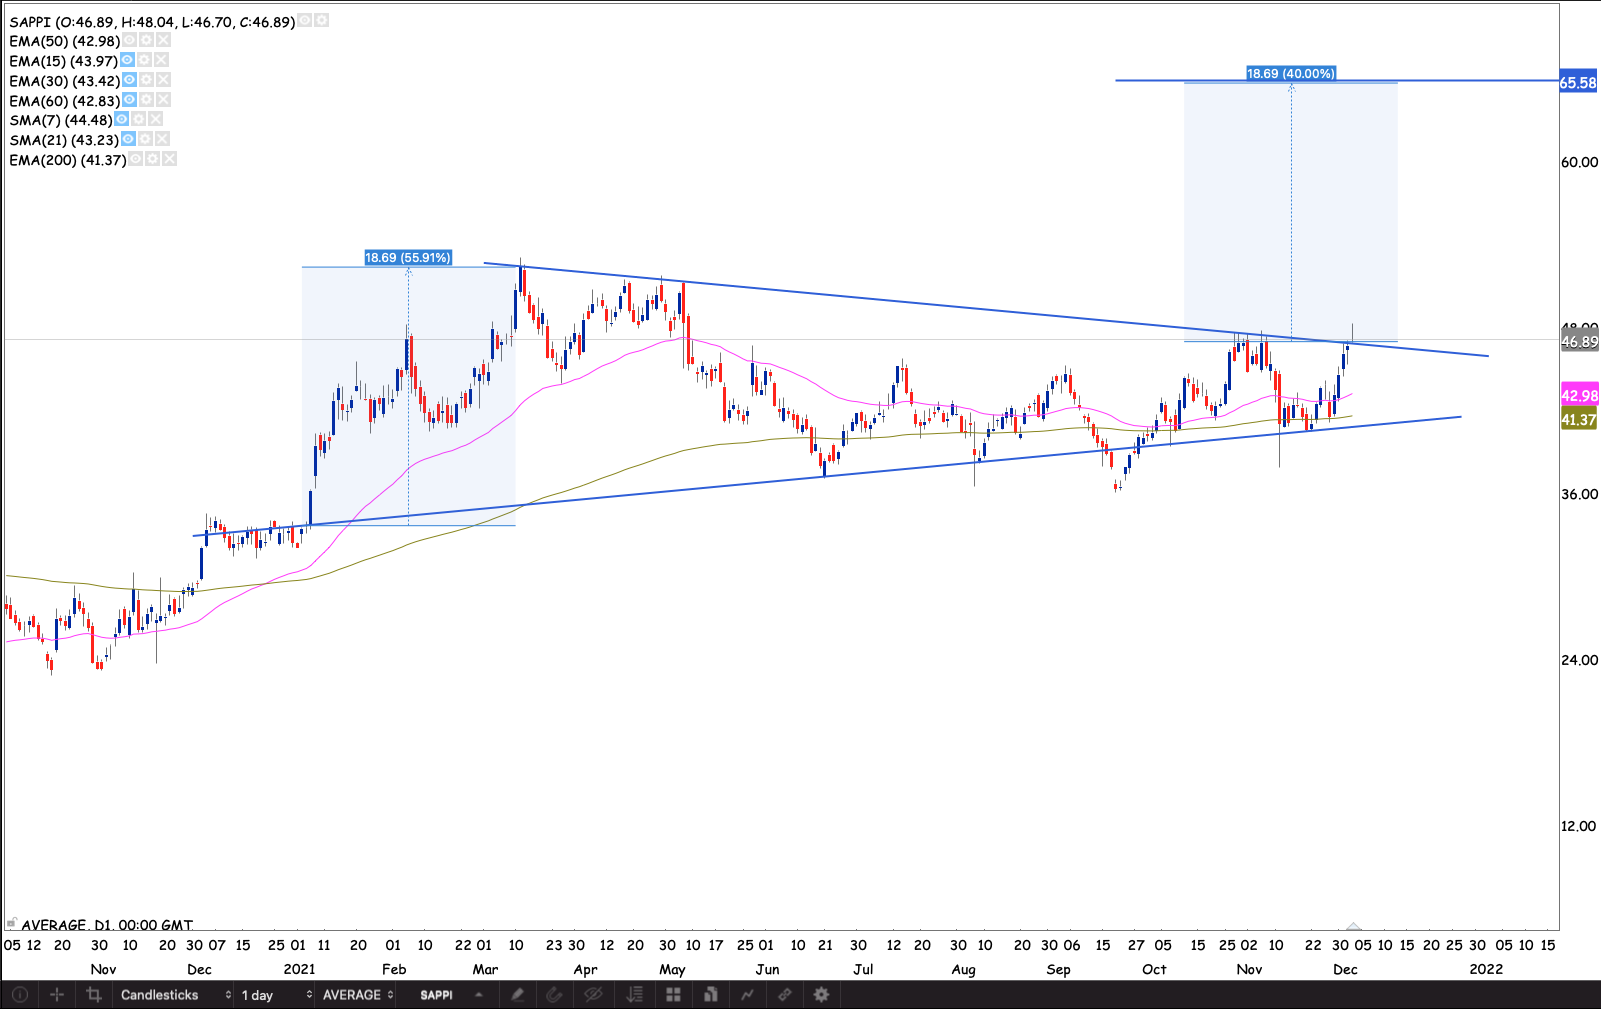
Sappi
The stock gapped higher at the back of first quarter results. Came back to the R52.20 resistance from above and held it. The next important level for the stock is R59.40. I will be looking for entry opportunities between now and then. But for now I wanna be cautious with raising my stop loss. Till volatility has normalized.
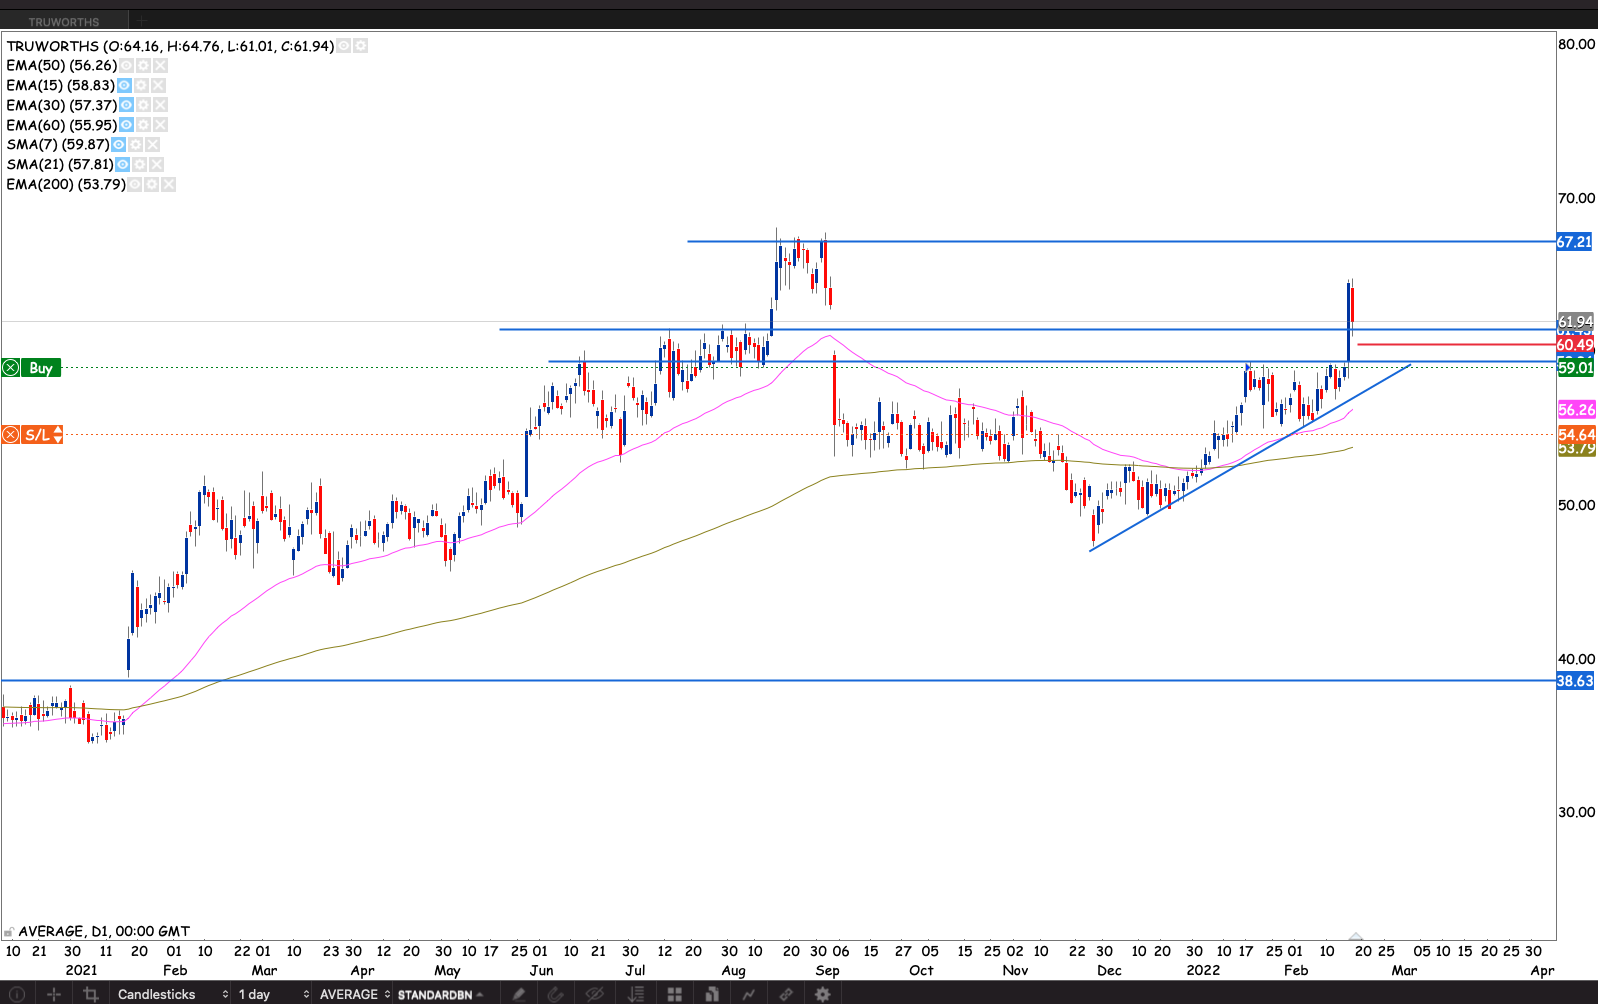
Truworths
The component some knock it out the pack number, dividends up 29%, earnings up 46% and a share buy back. The market absolutely loved the results. I’m expecting the market to continue to rally. I’m waiting for a close through R67.20 resistance to raise my stop loss and to my position.
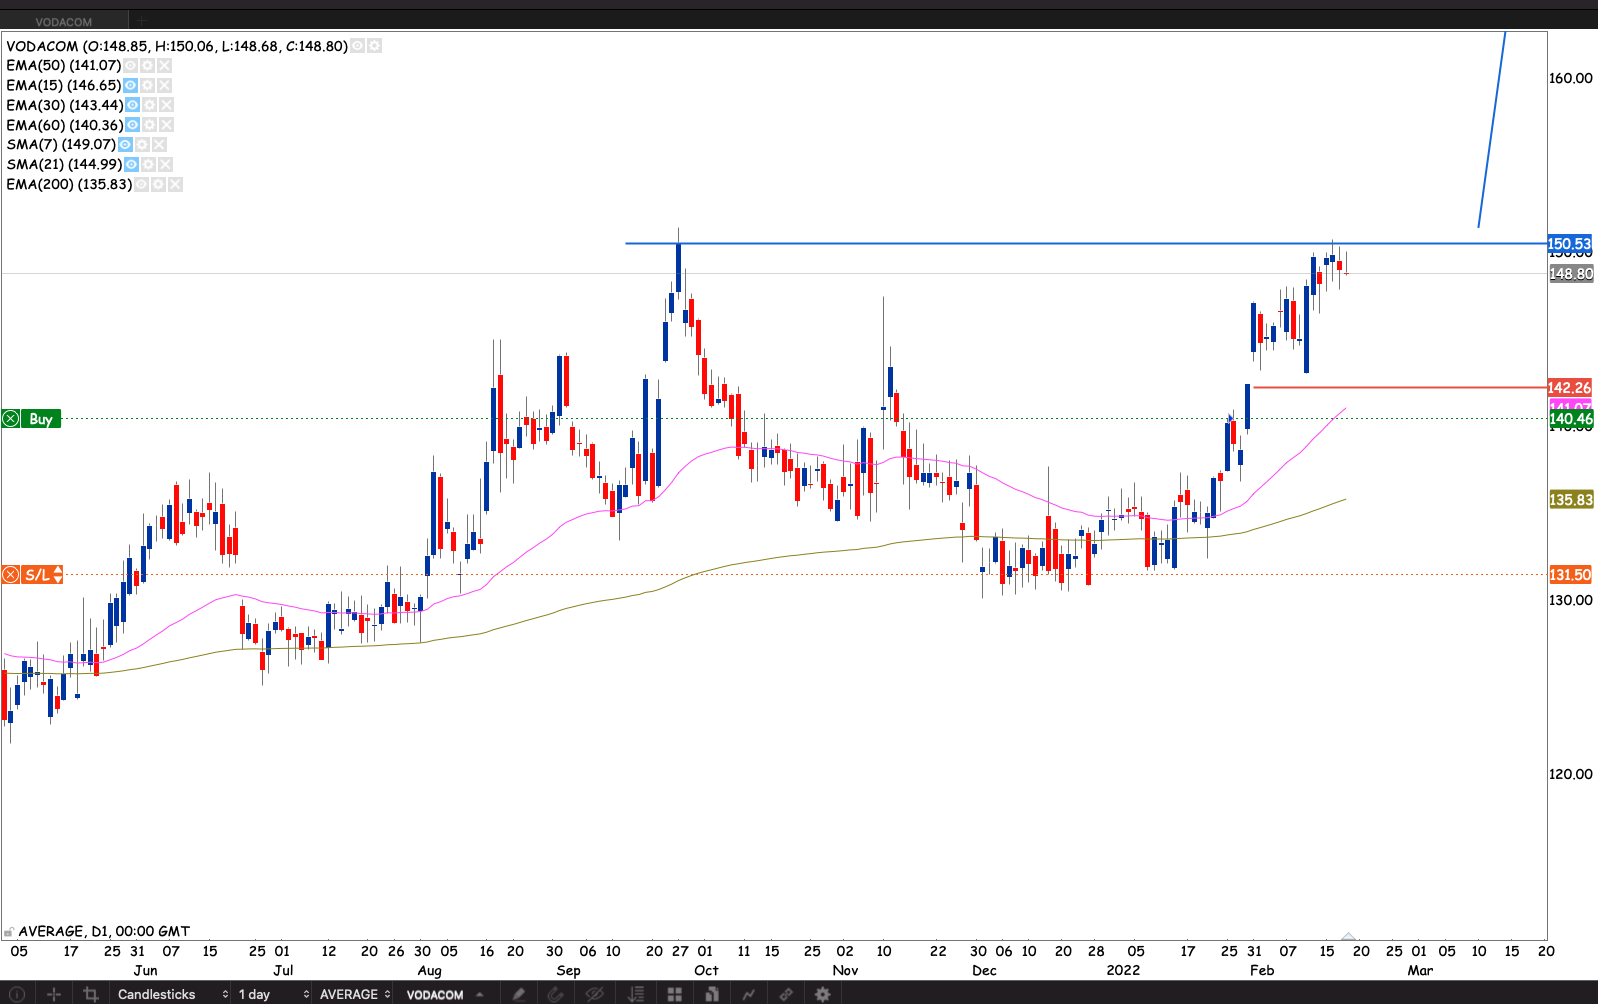
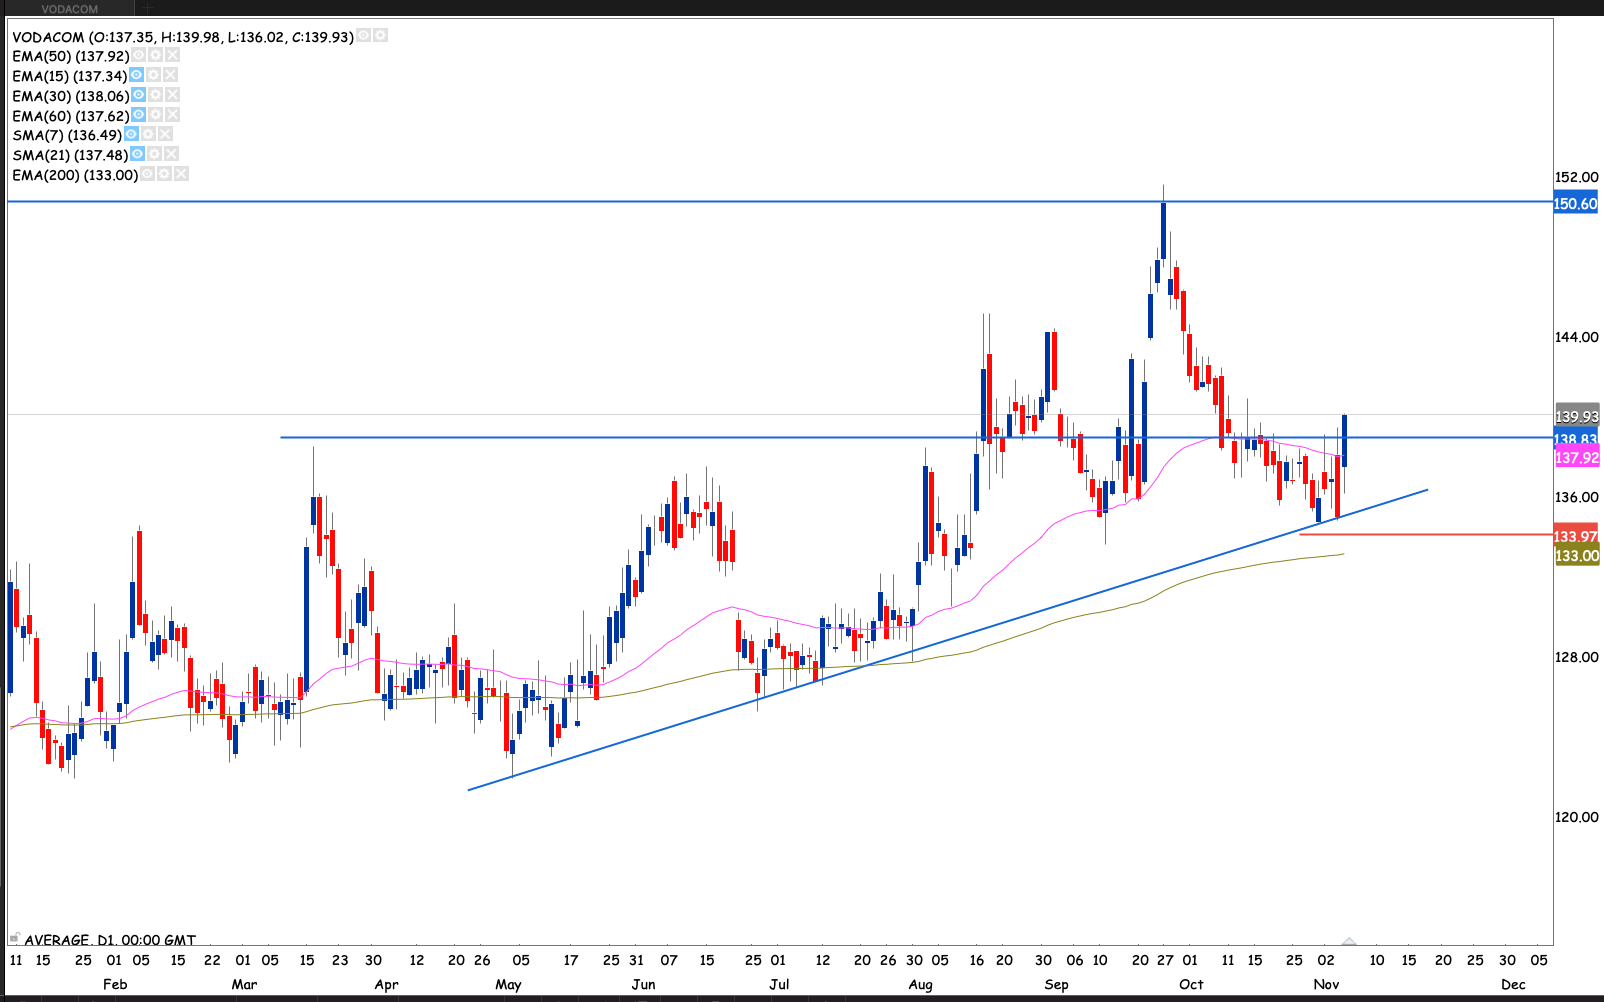
Vodacom
The stock legged MTN for some miles. However it woke up from the dead post results. So far the market still remembers R150.50. If the market can take out this level I will raise my stop loss and add to my position.
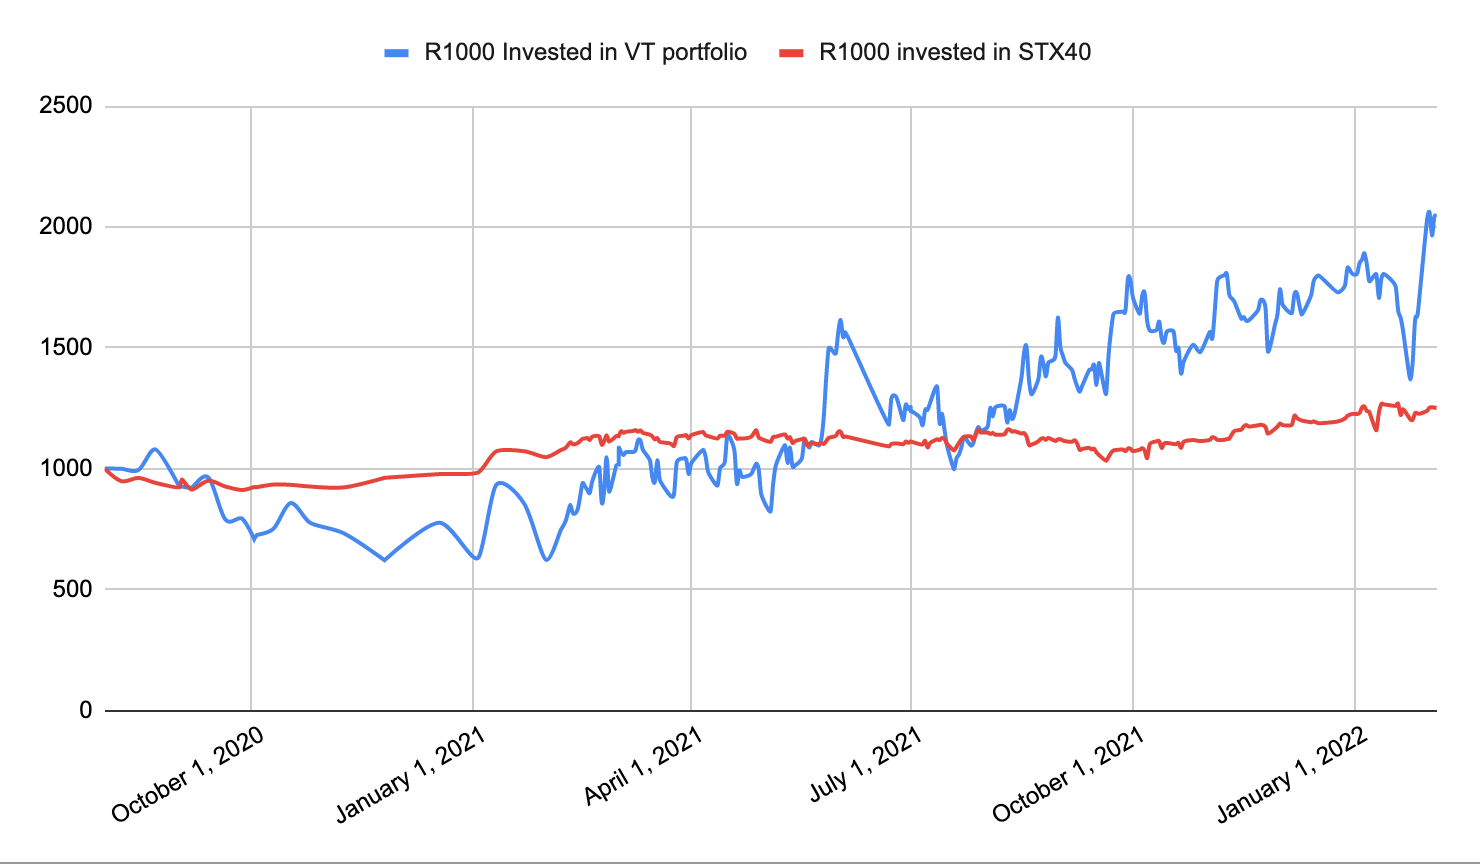
Portfolio Summary on 20 February 2022
Capital invested: R10 303.77
Current Balance: R8 657.26 -15.98%
Current Equity (Balance including paper P&L): R23 516.02 +128.23%
Current P&L : +R14 858.76
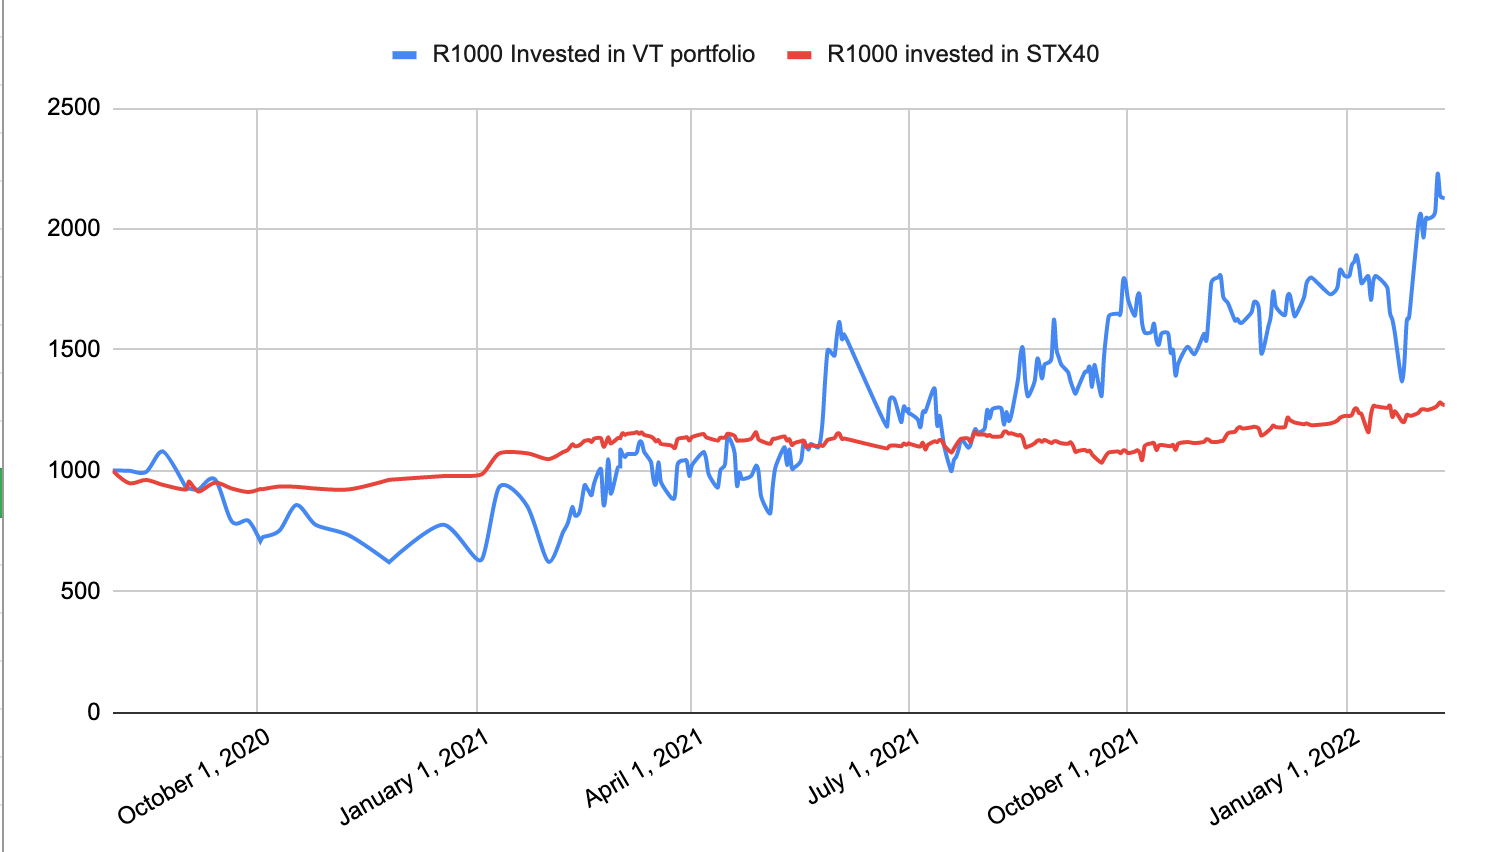
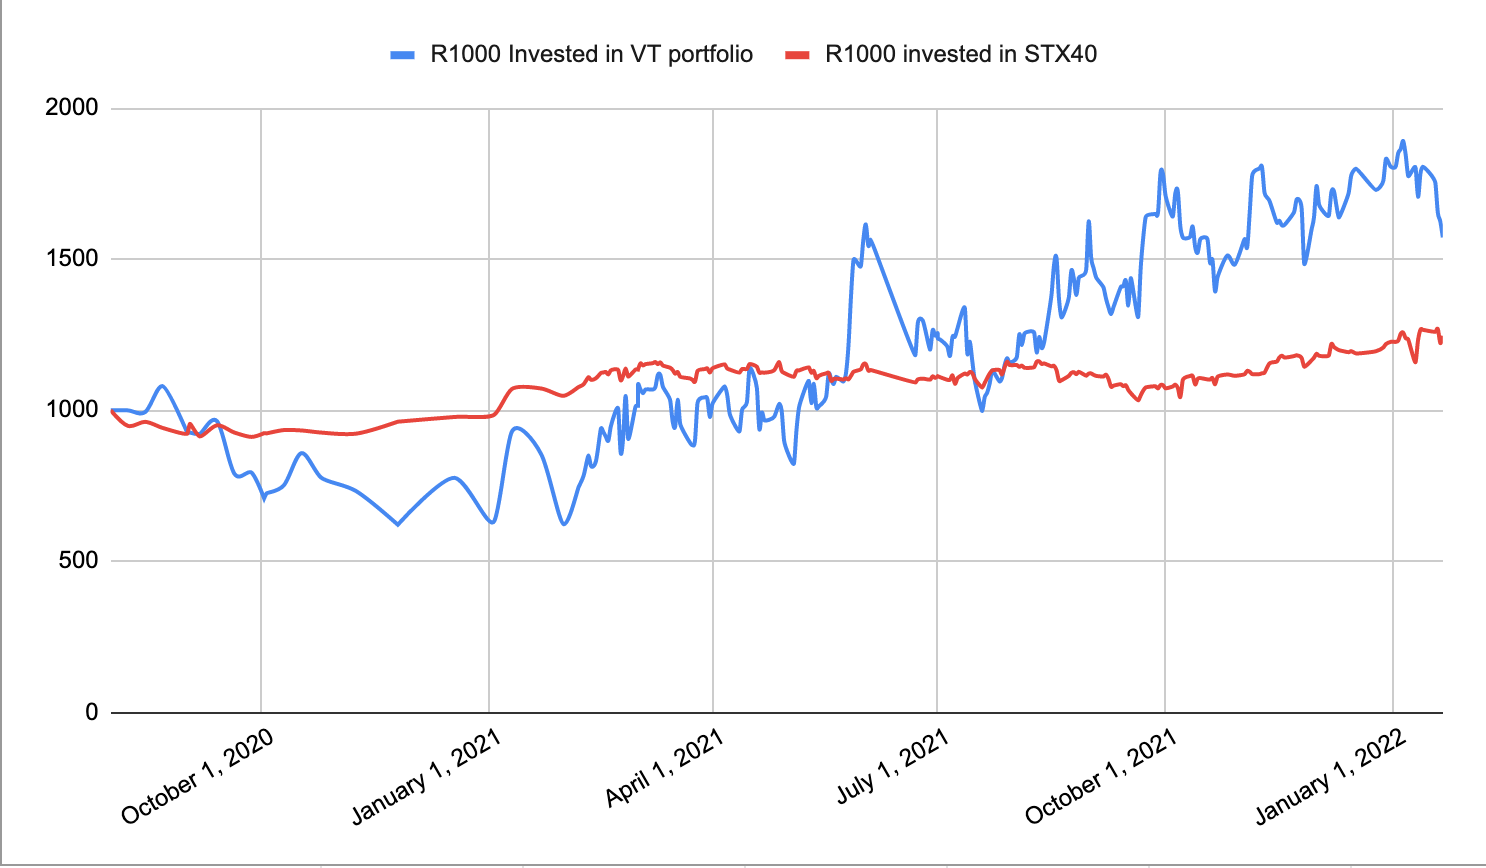
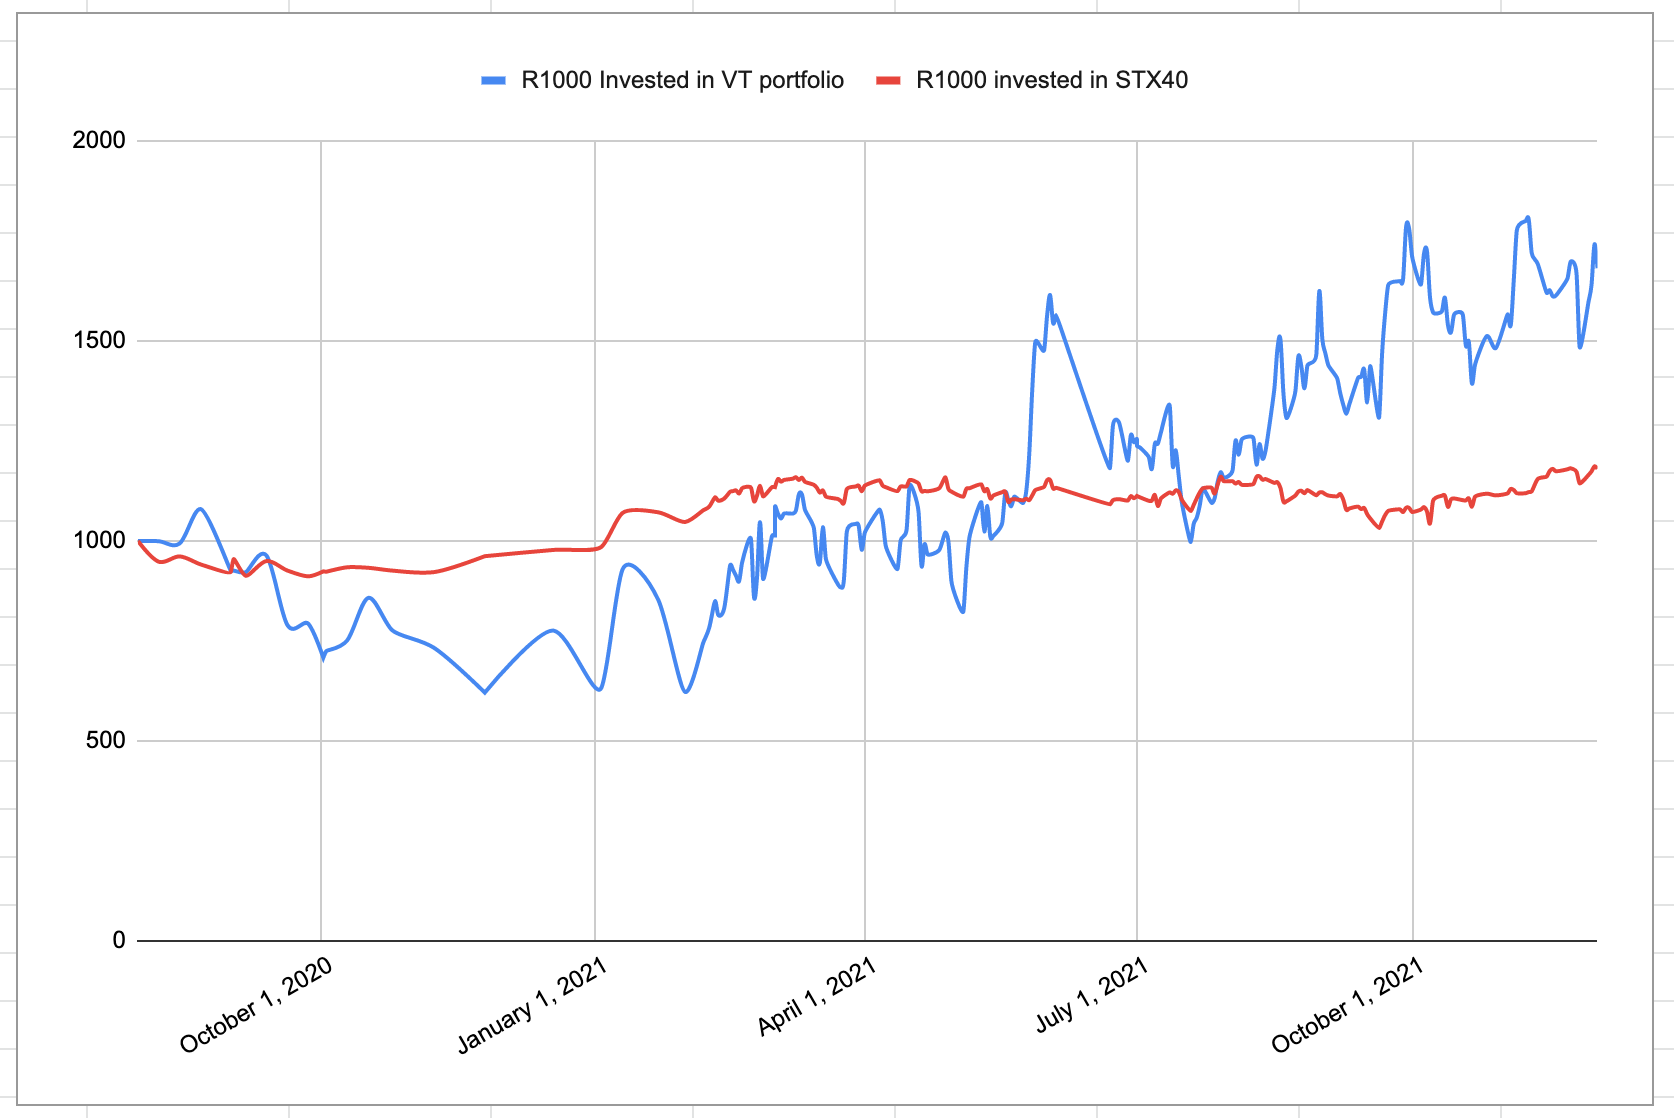
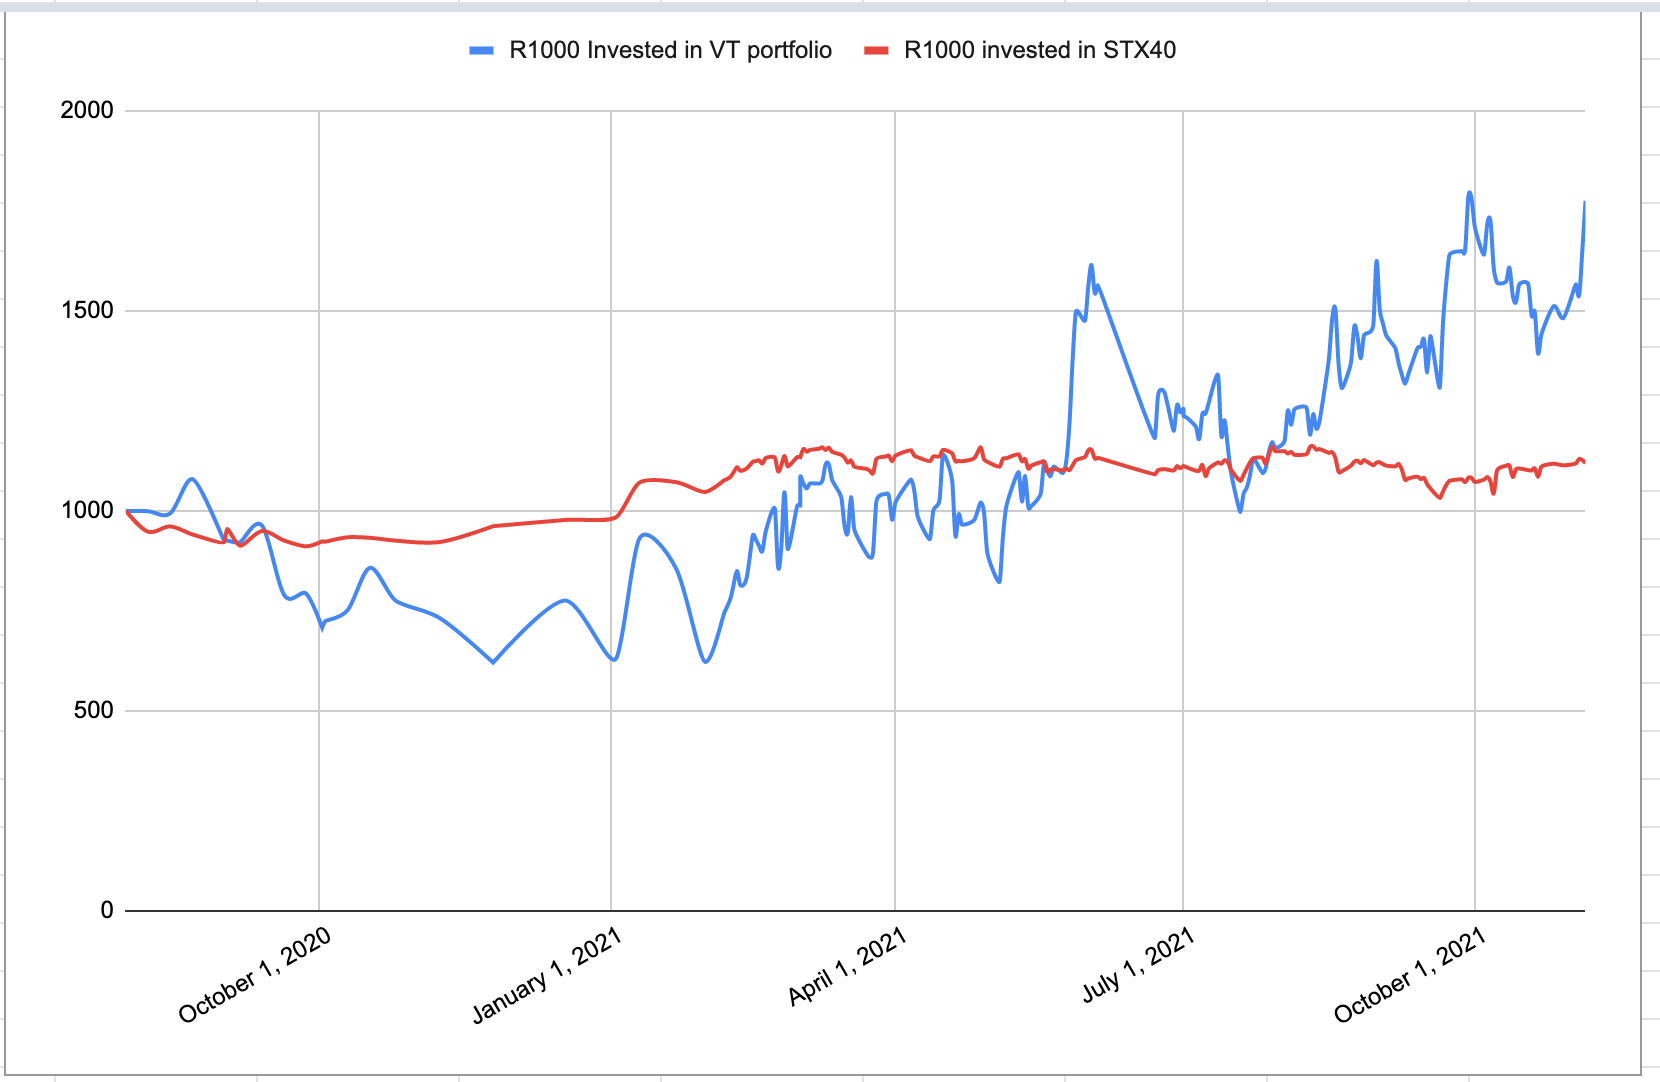
Equity curve Vs Benchmark (Satrix 40 ETF )

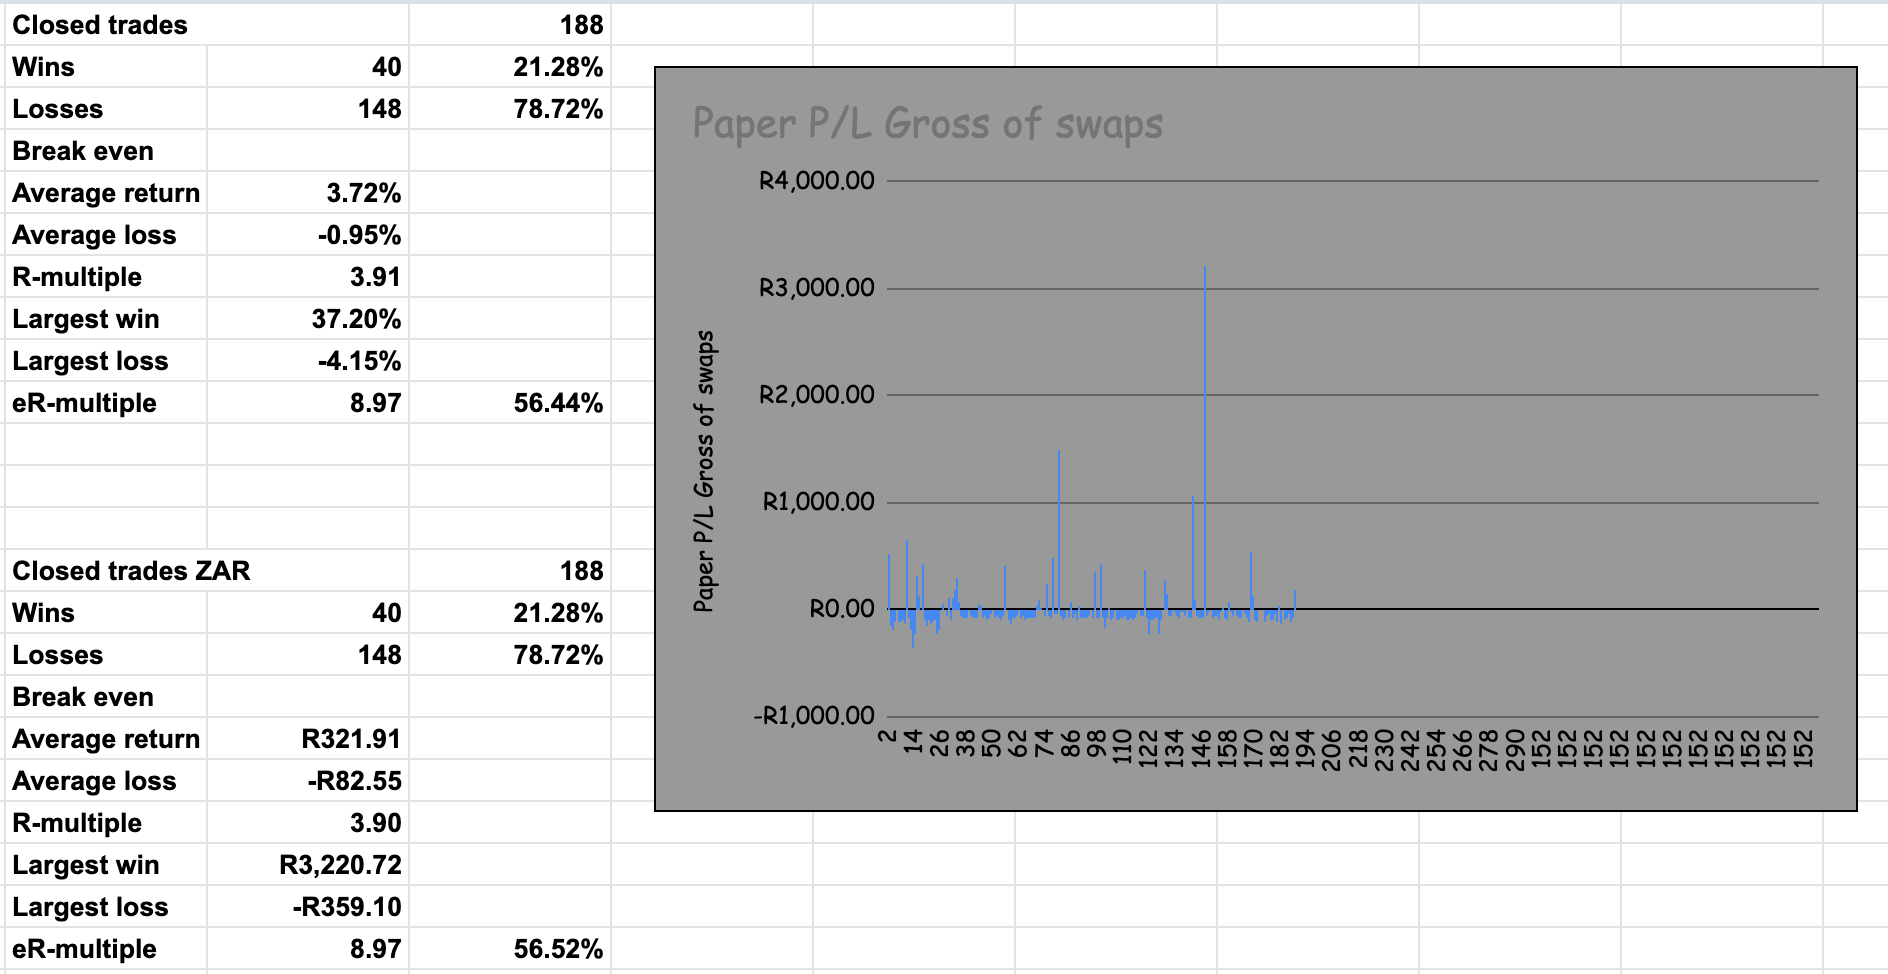
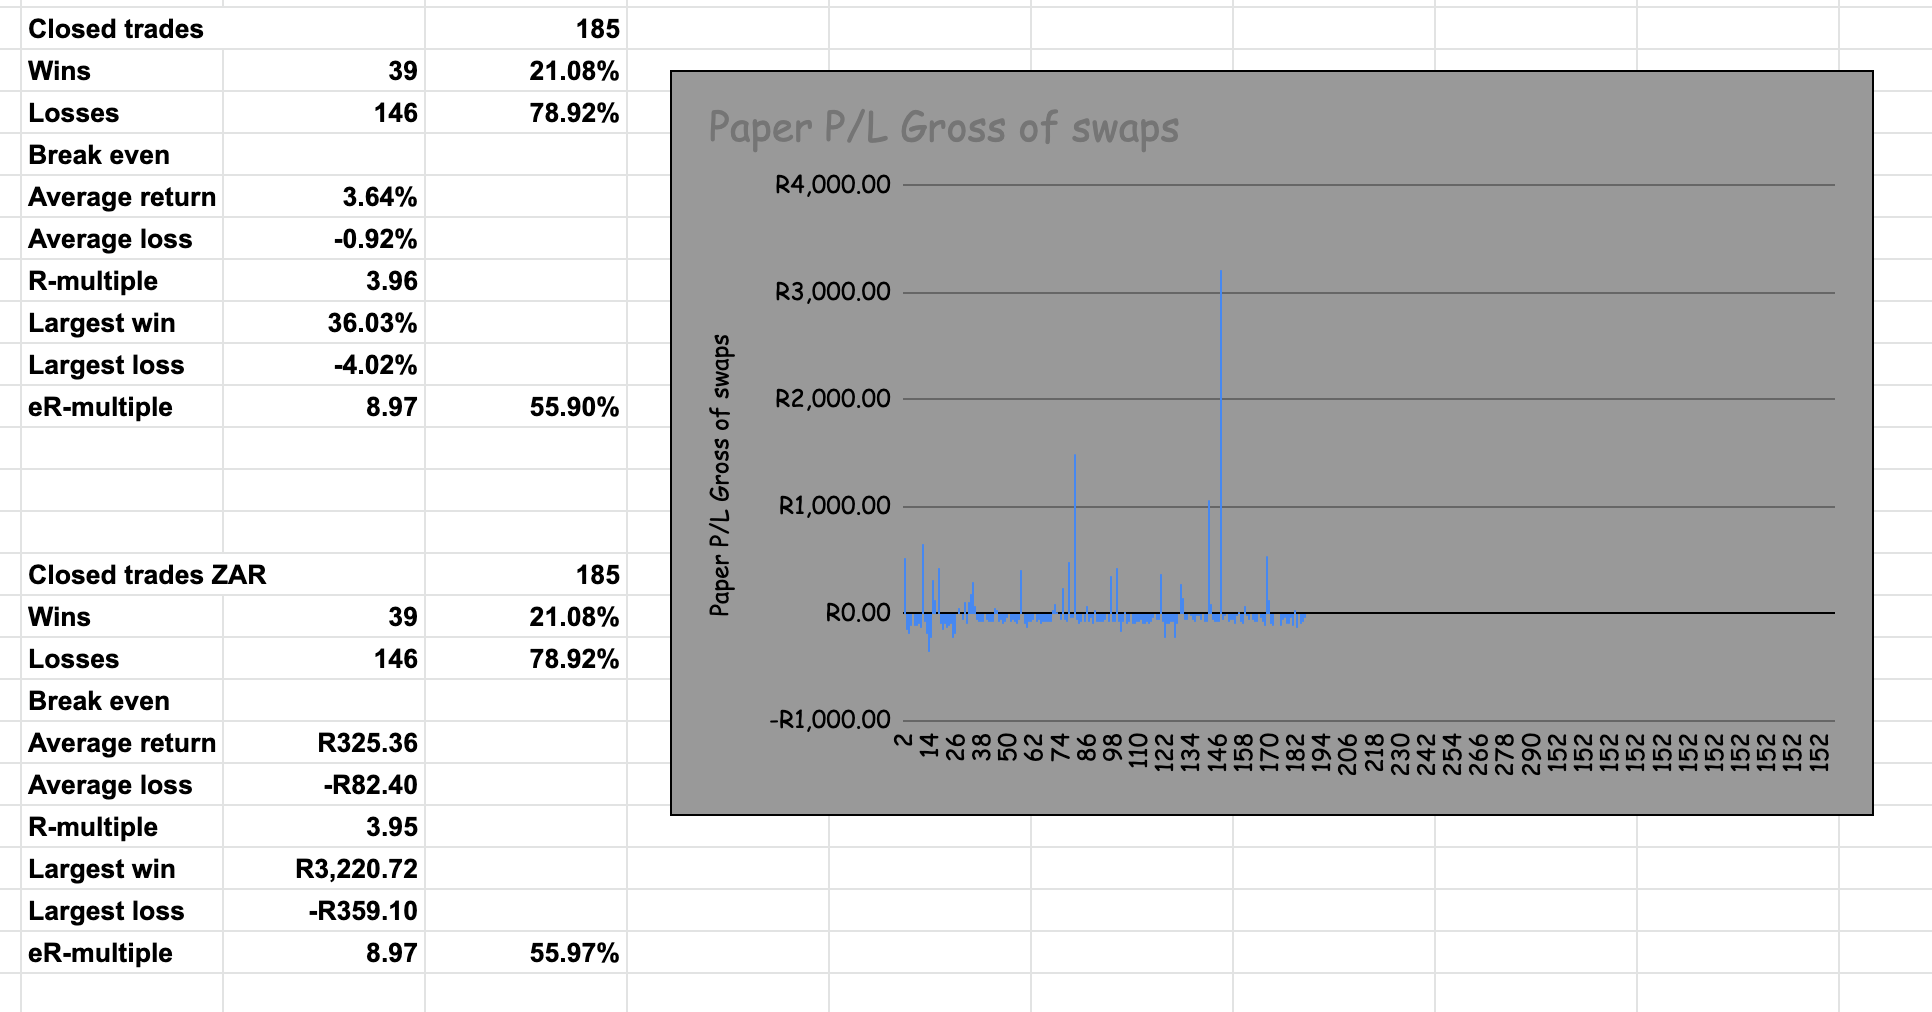
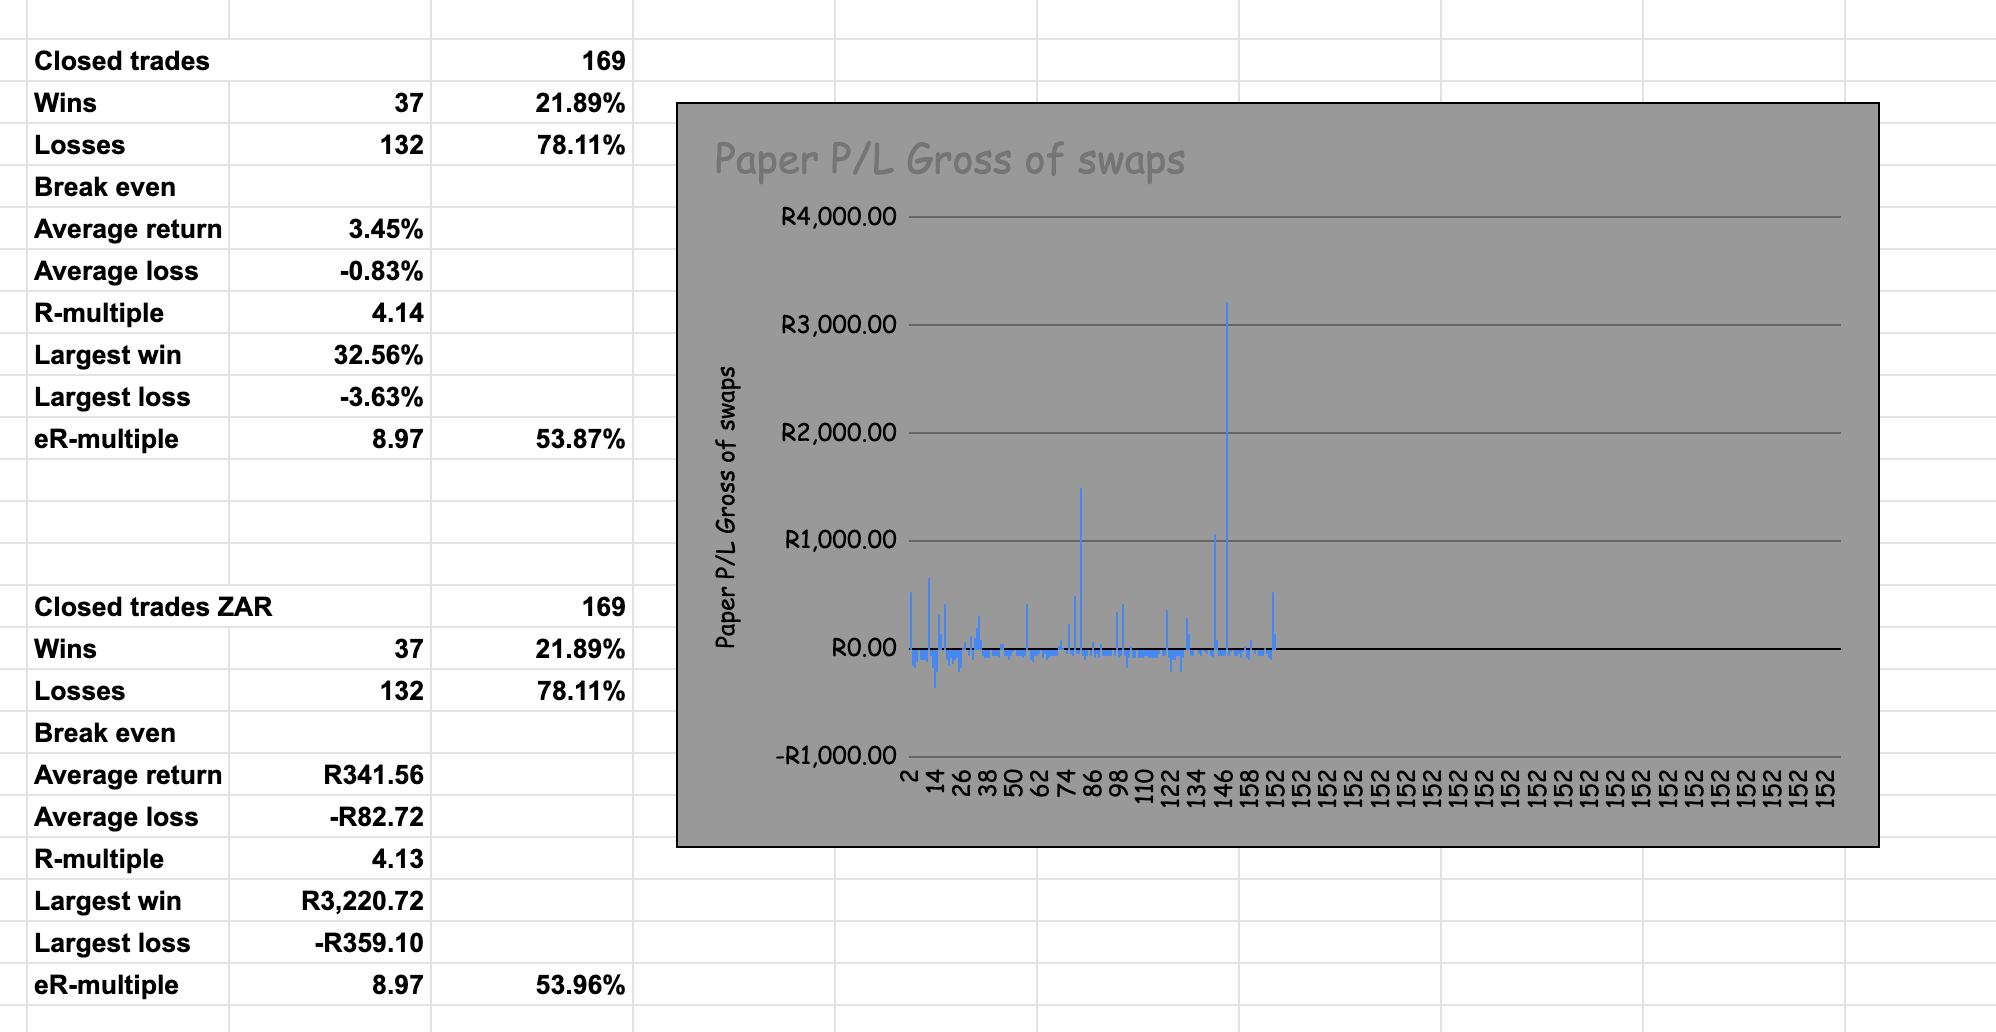
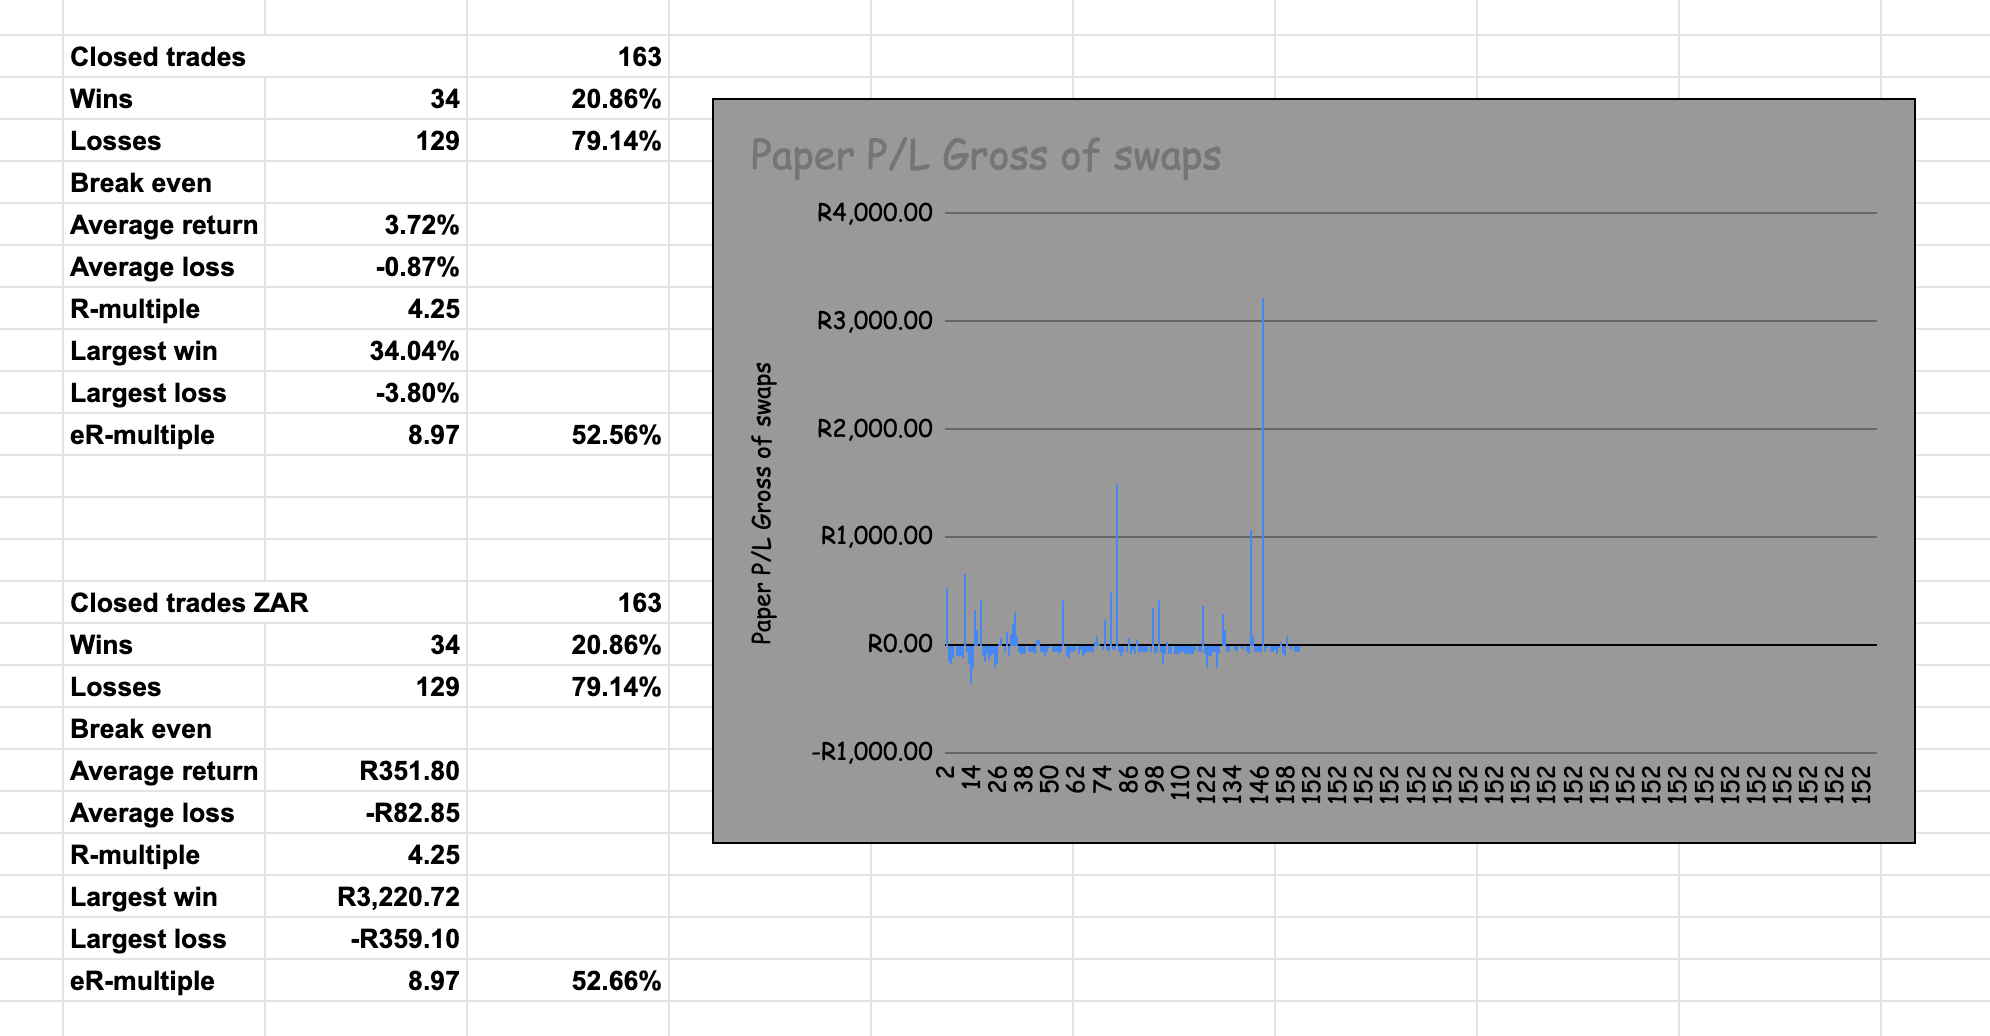
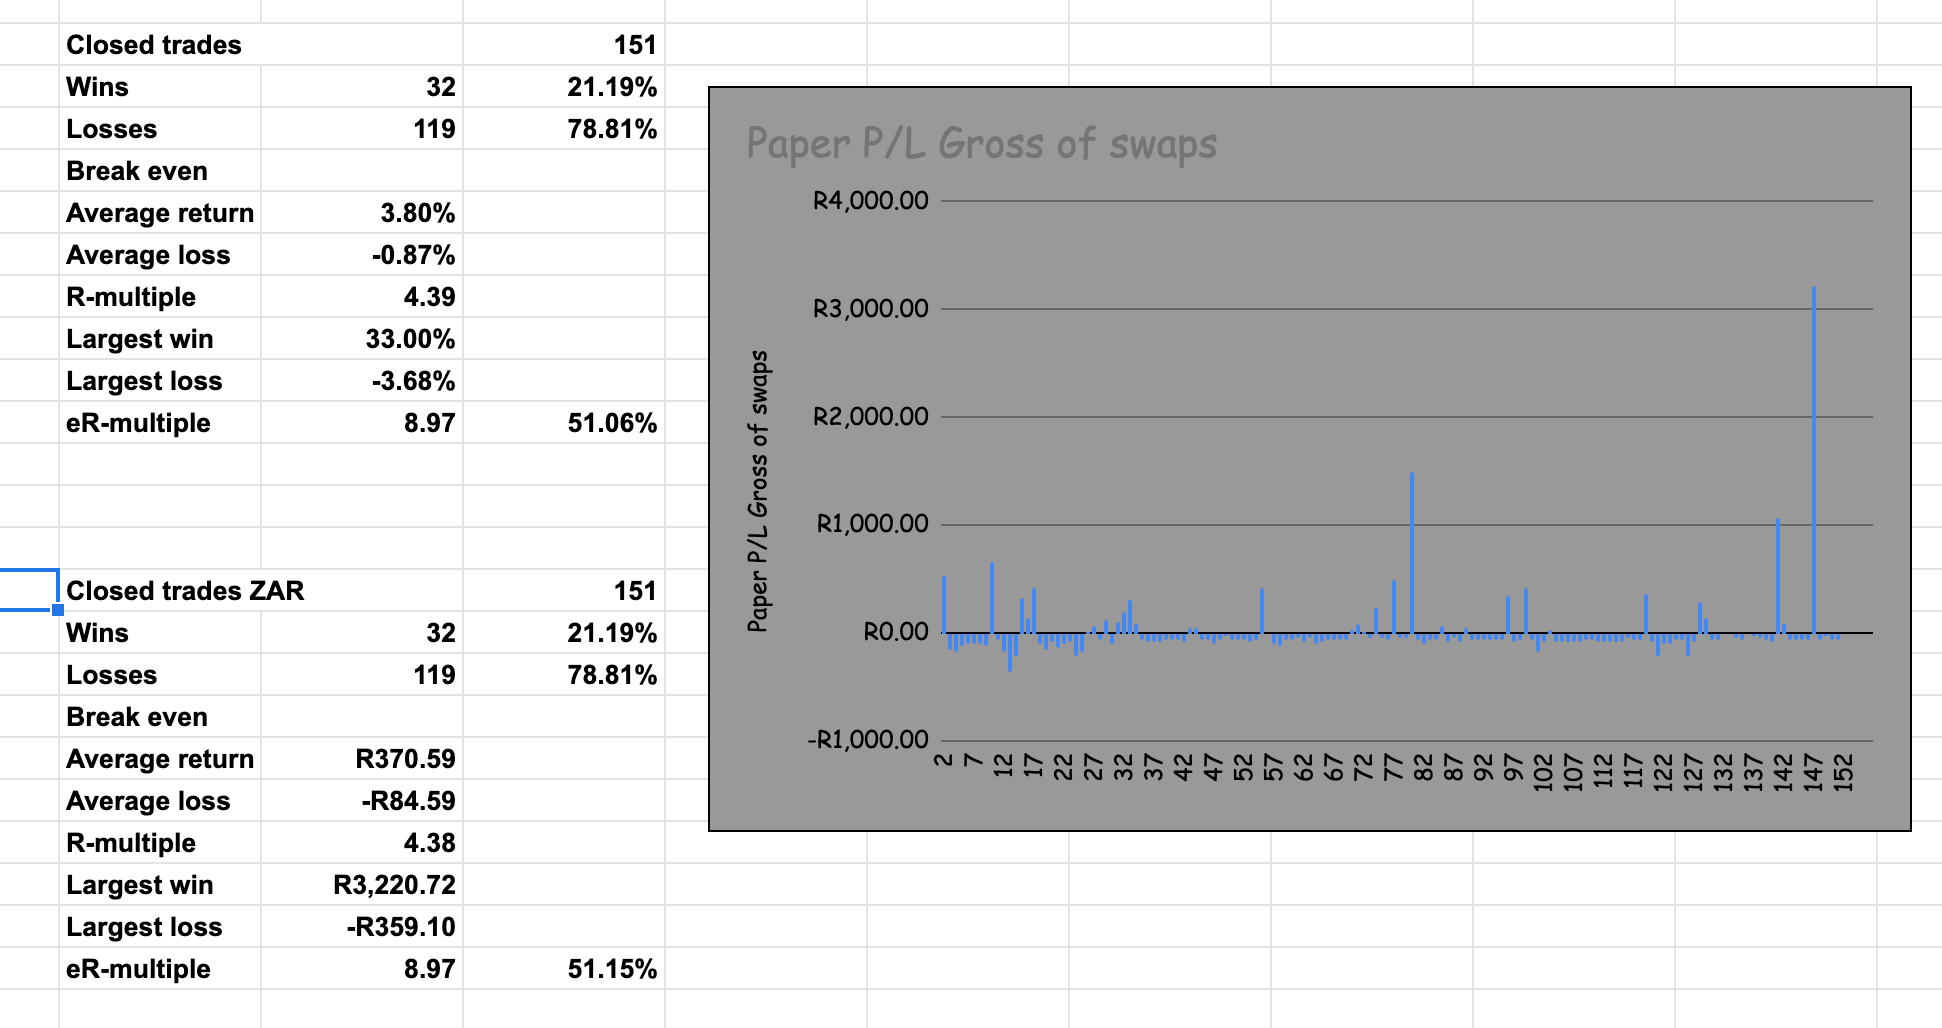
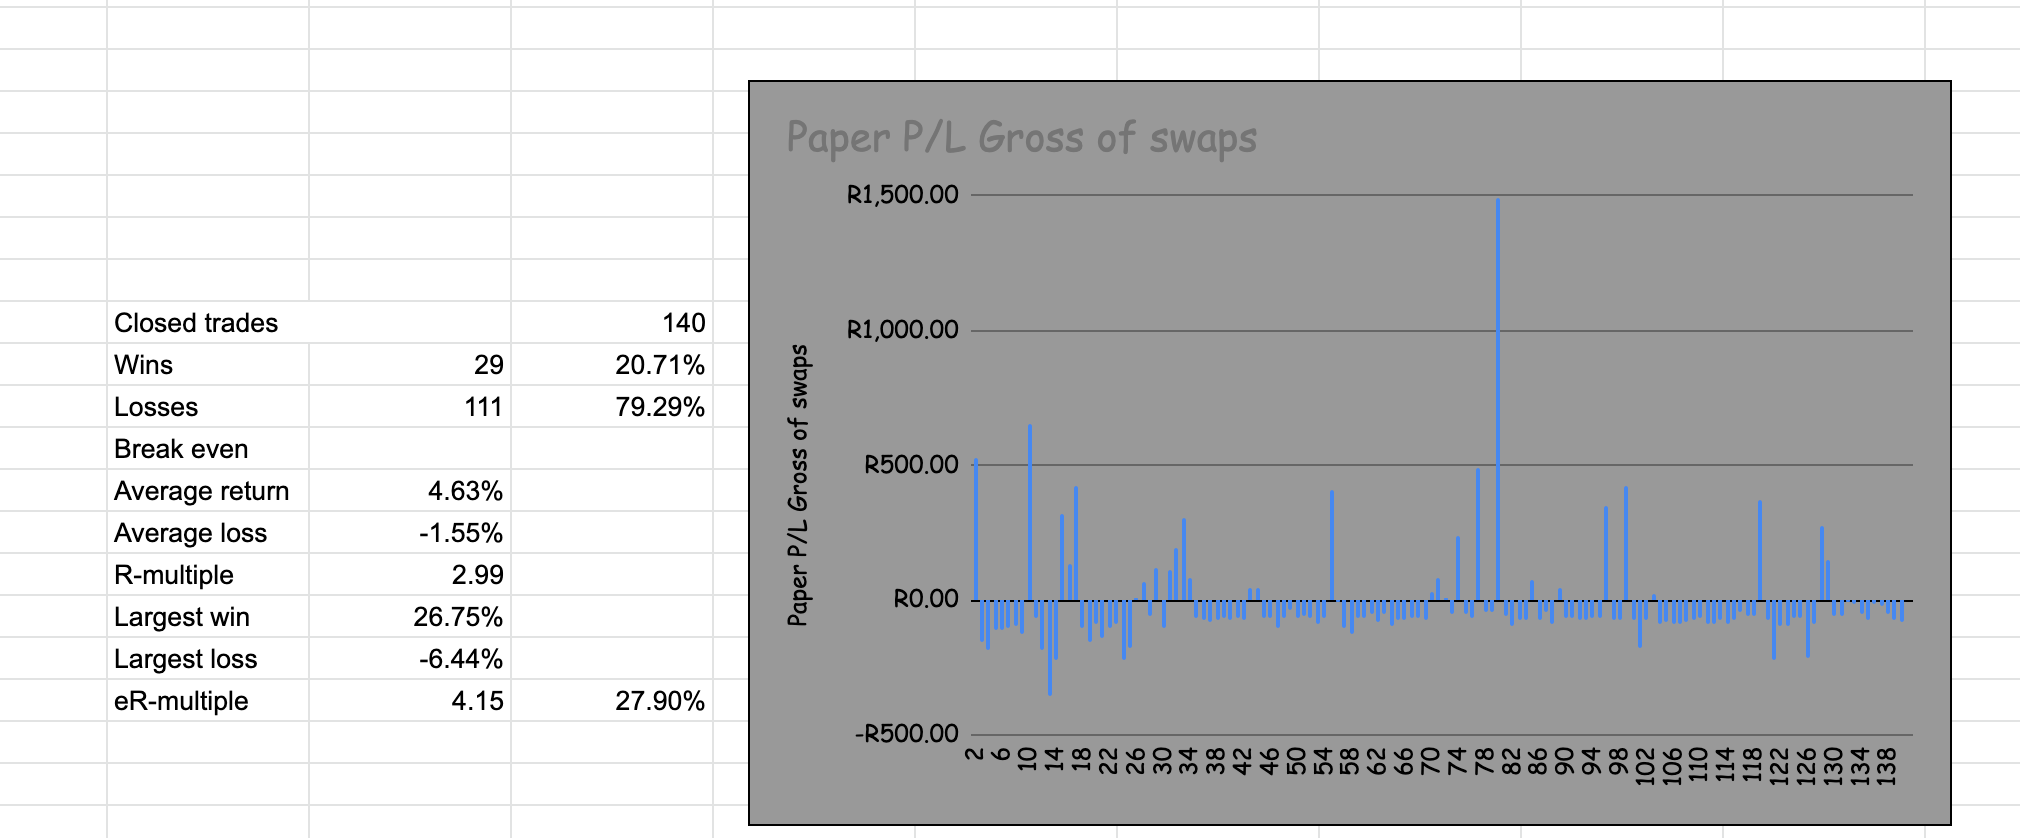
Closed trades statistics and distribution
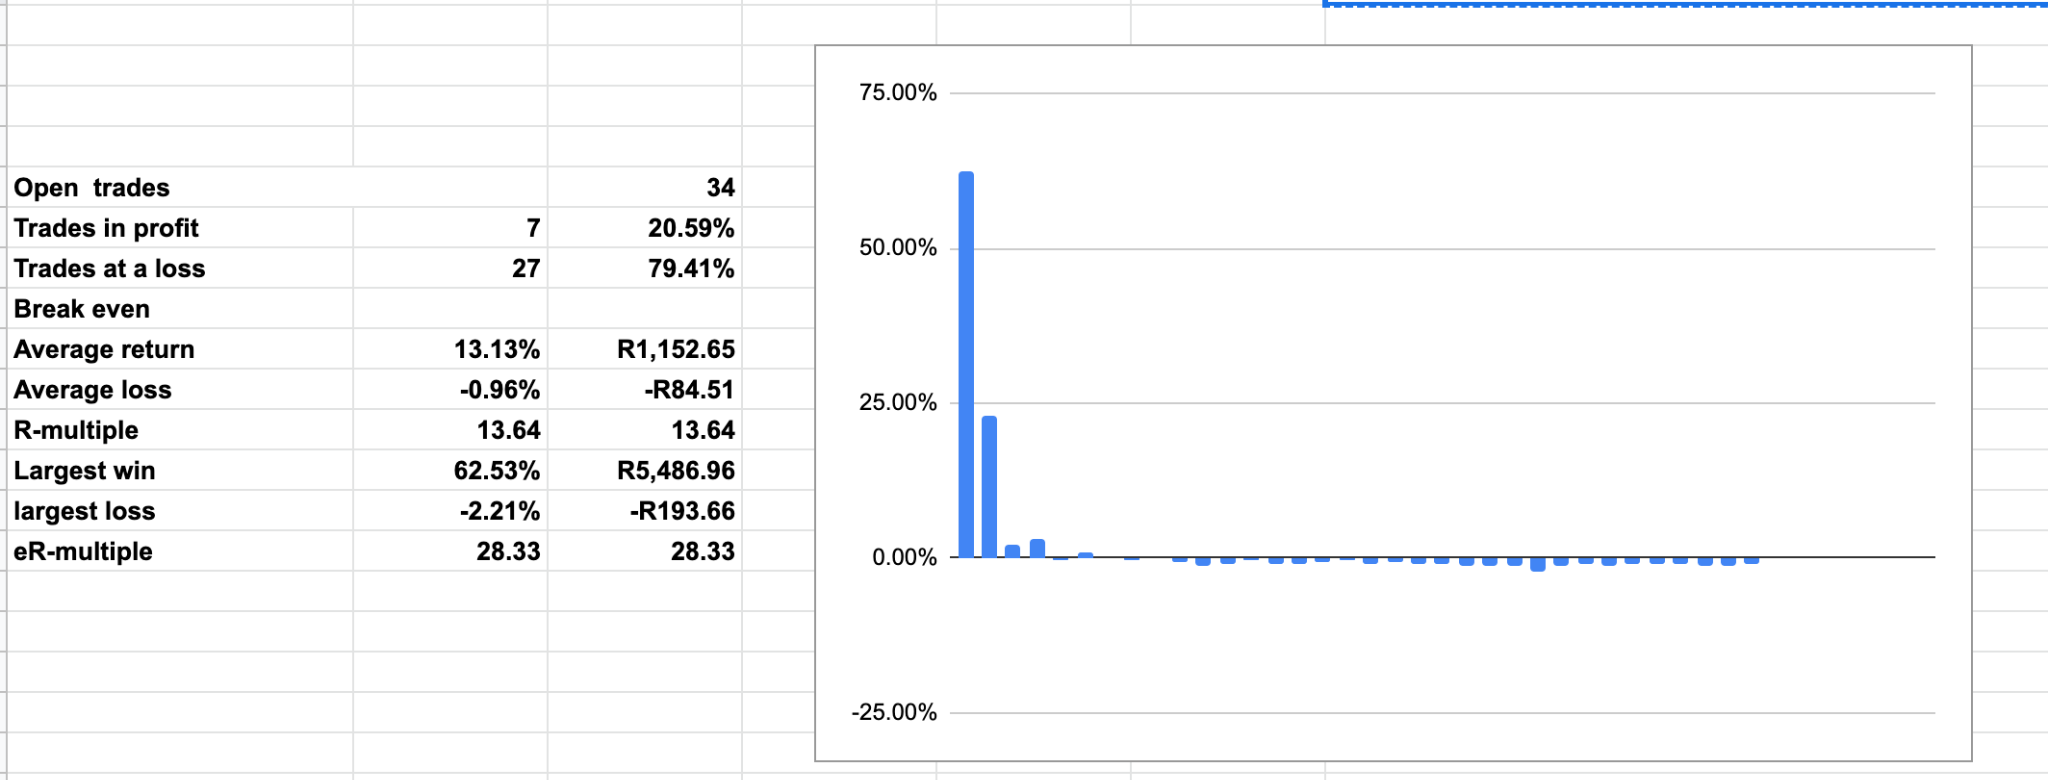
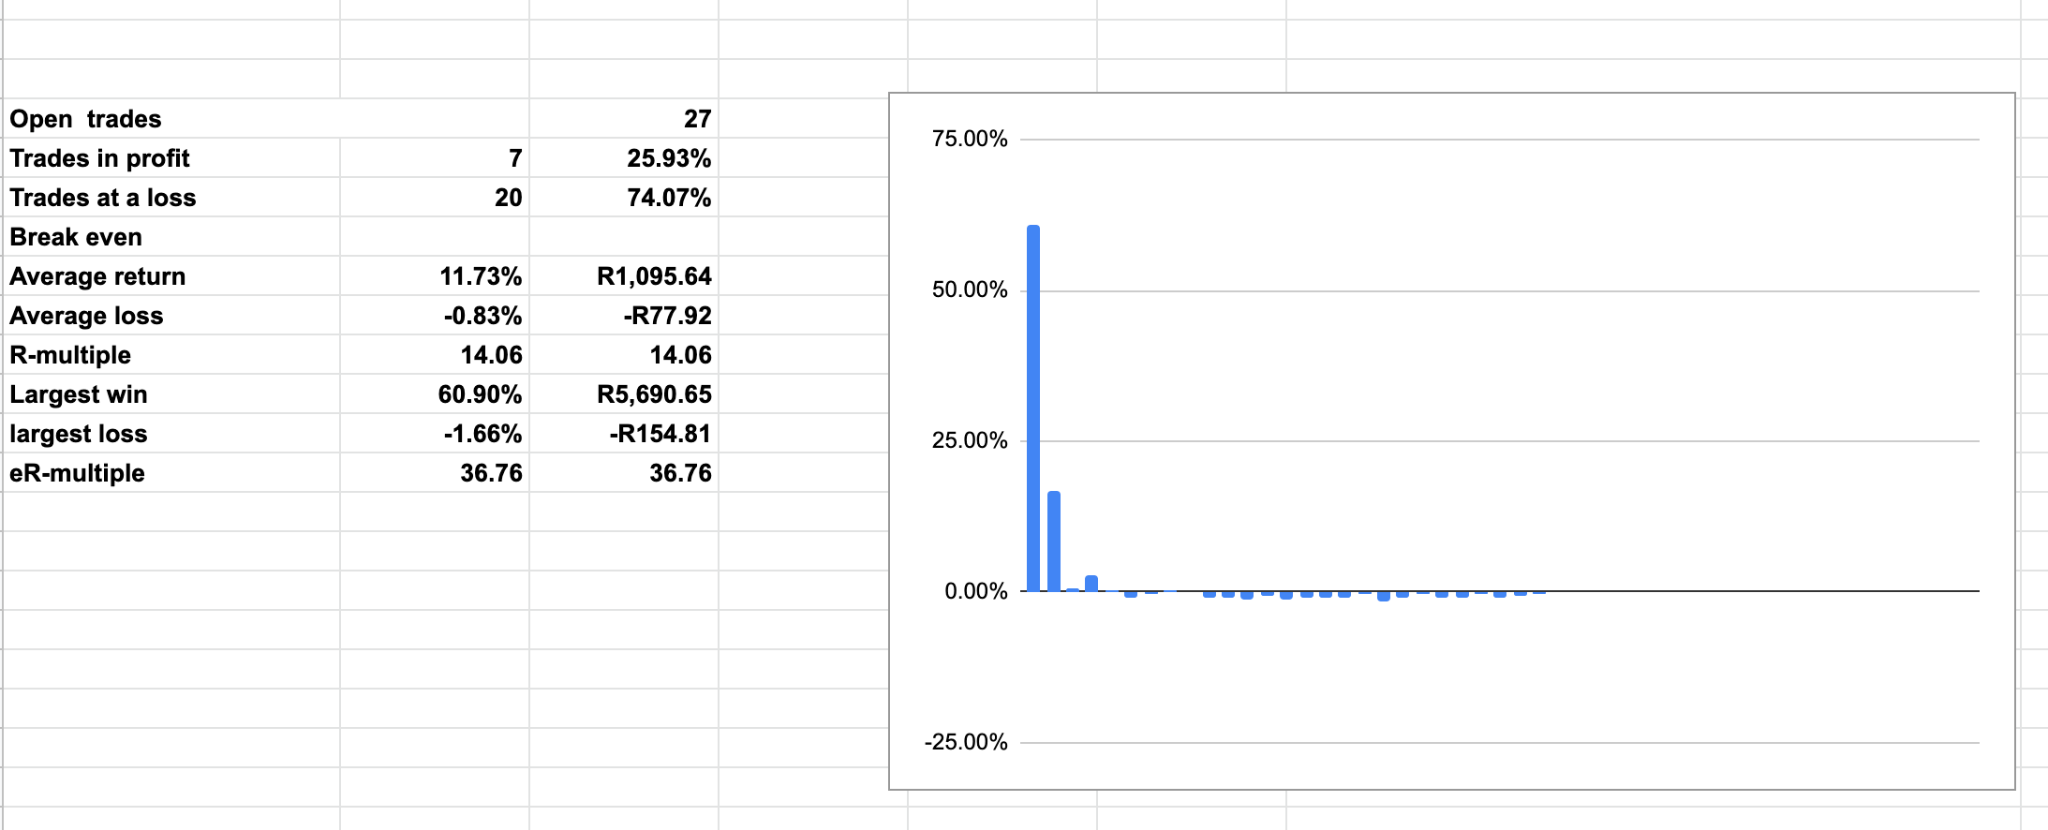
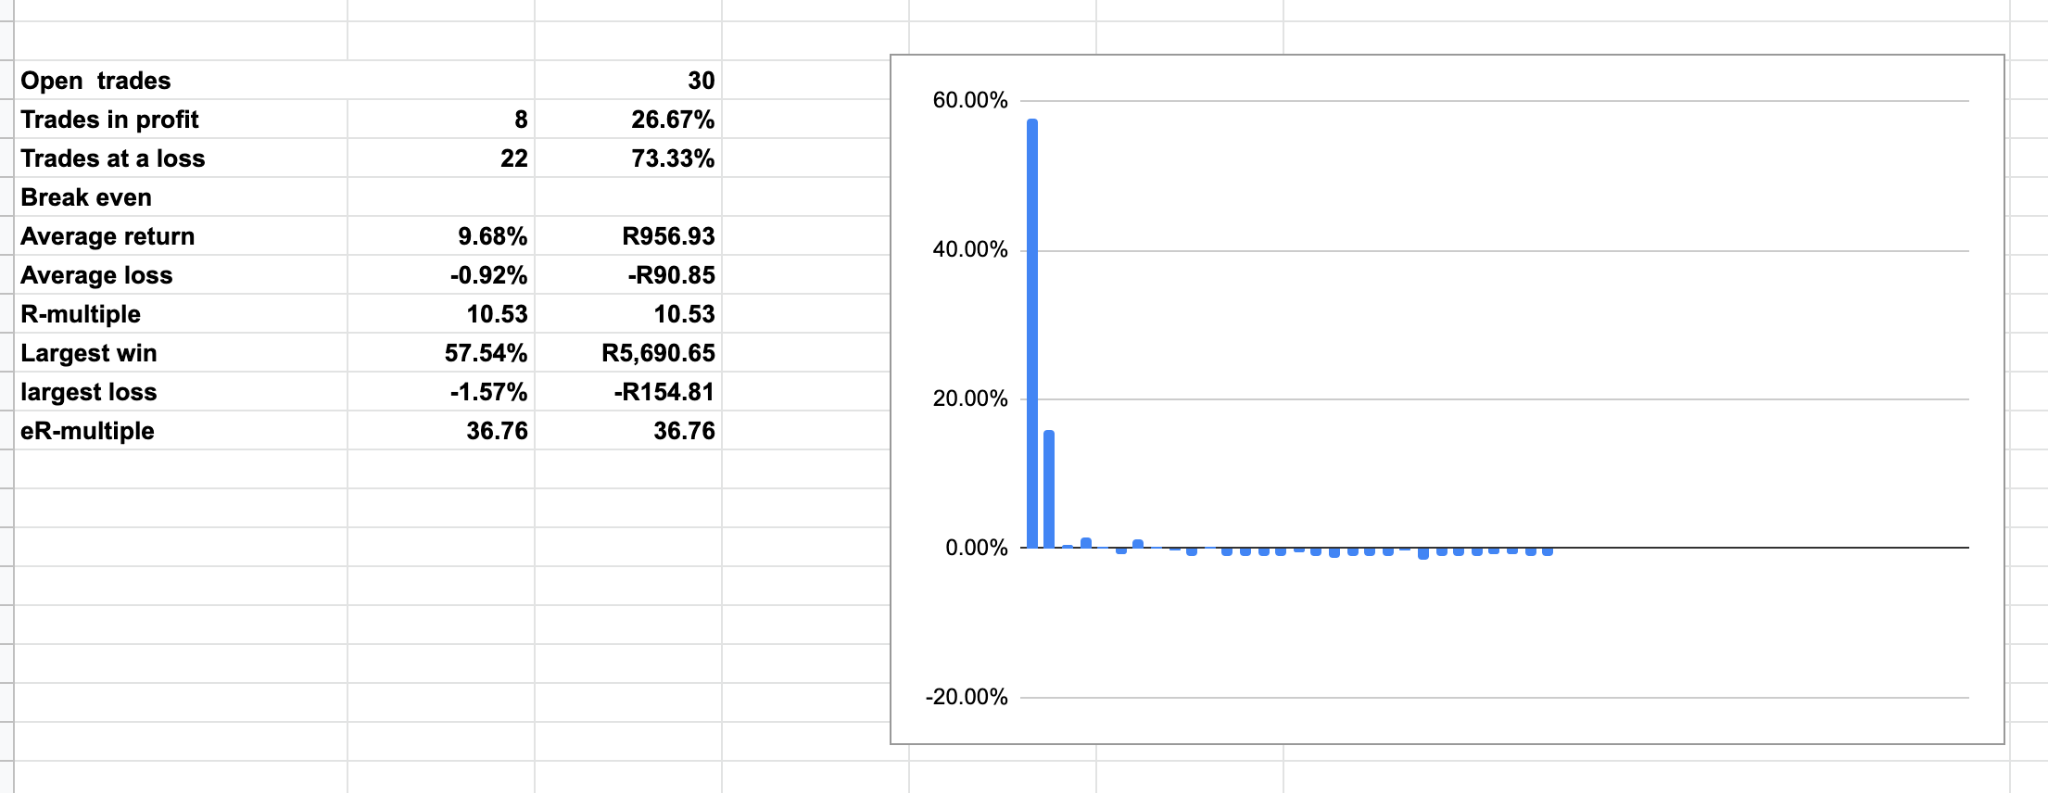
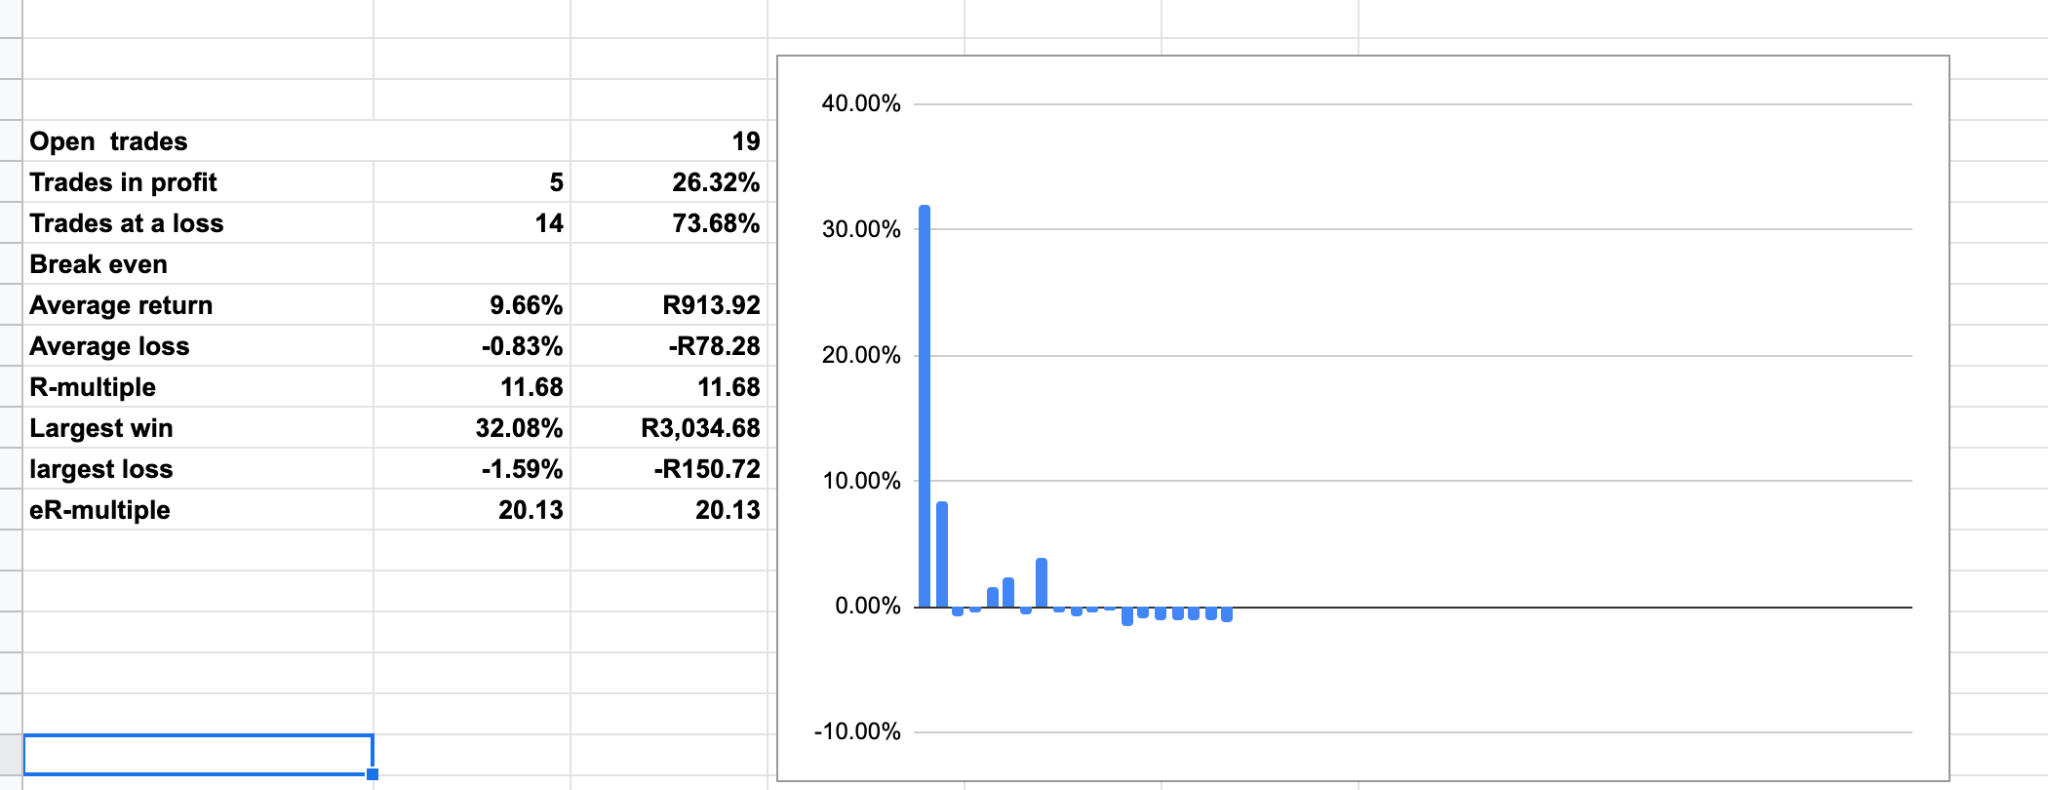
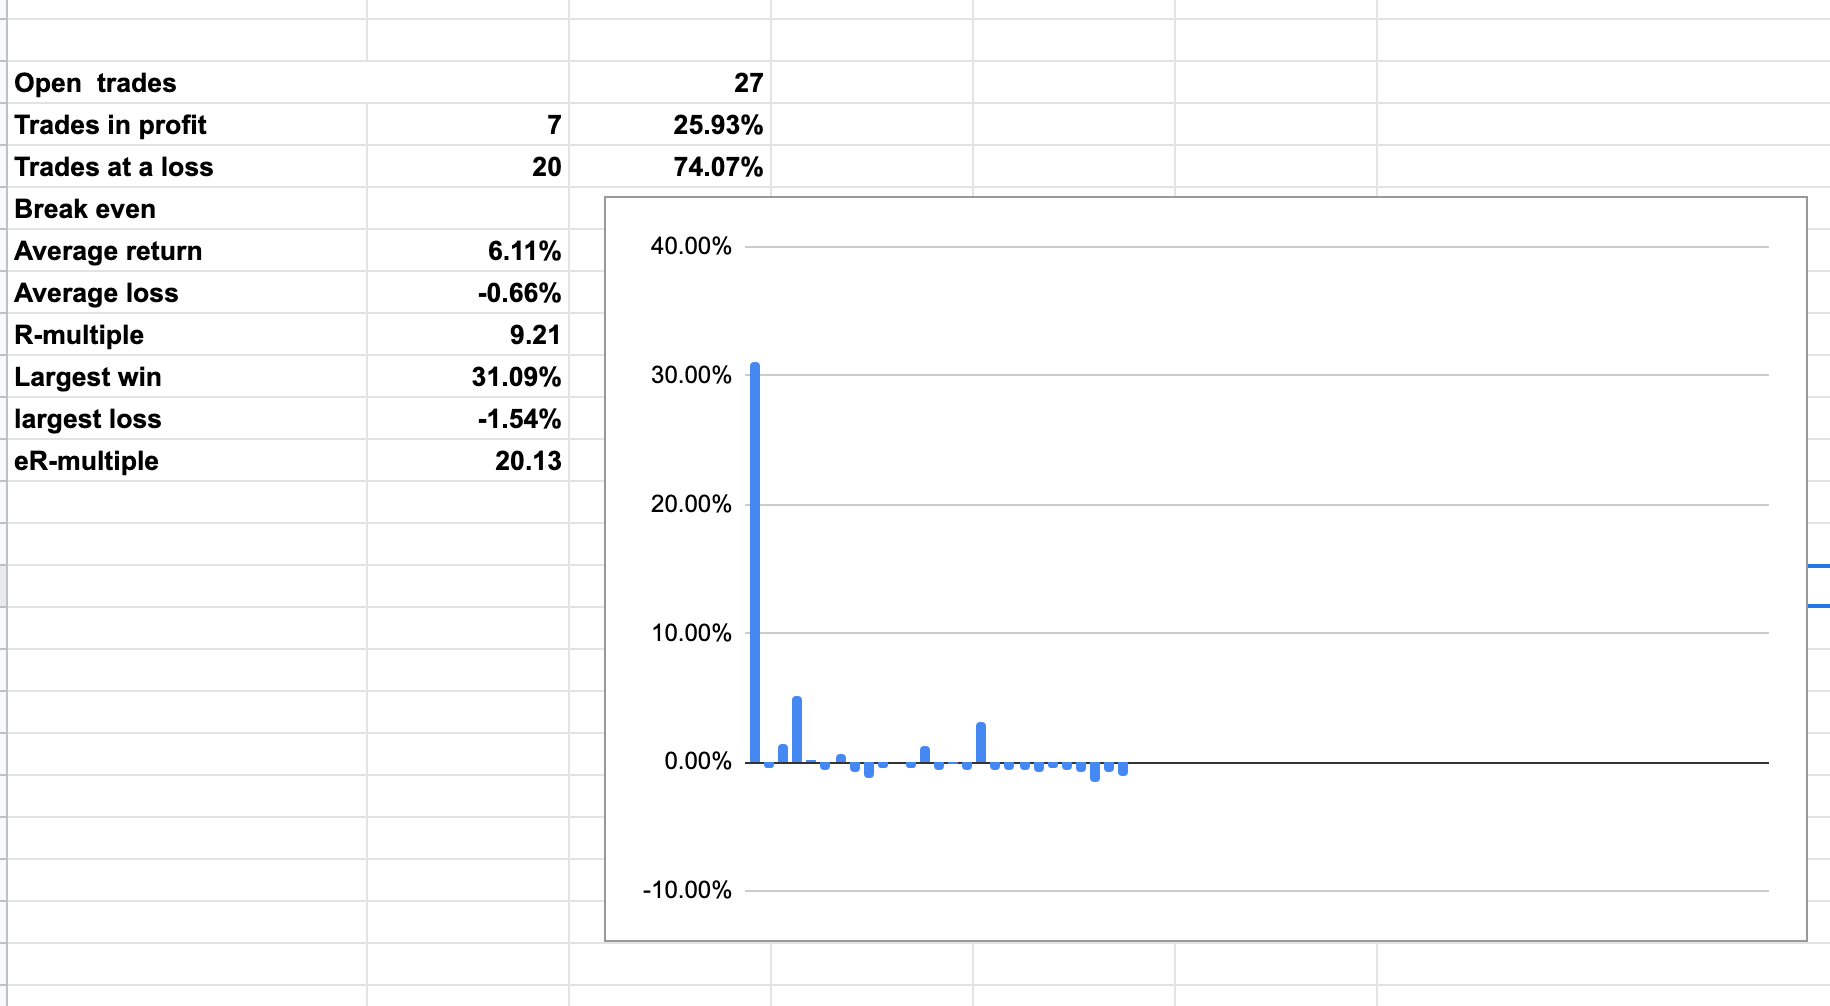
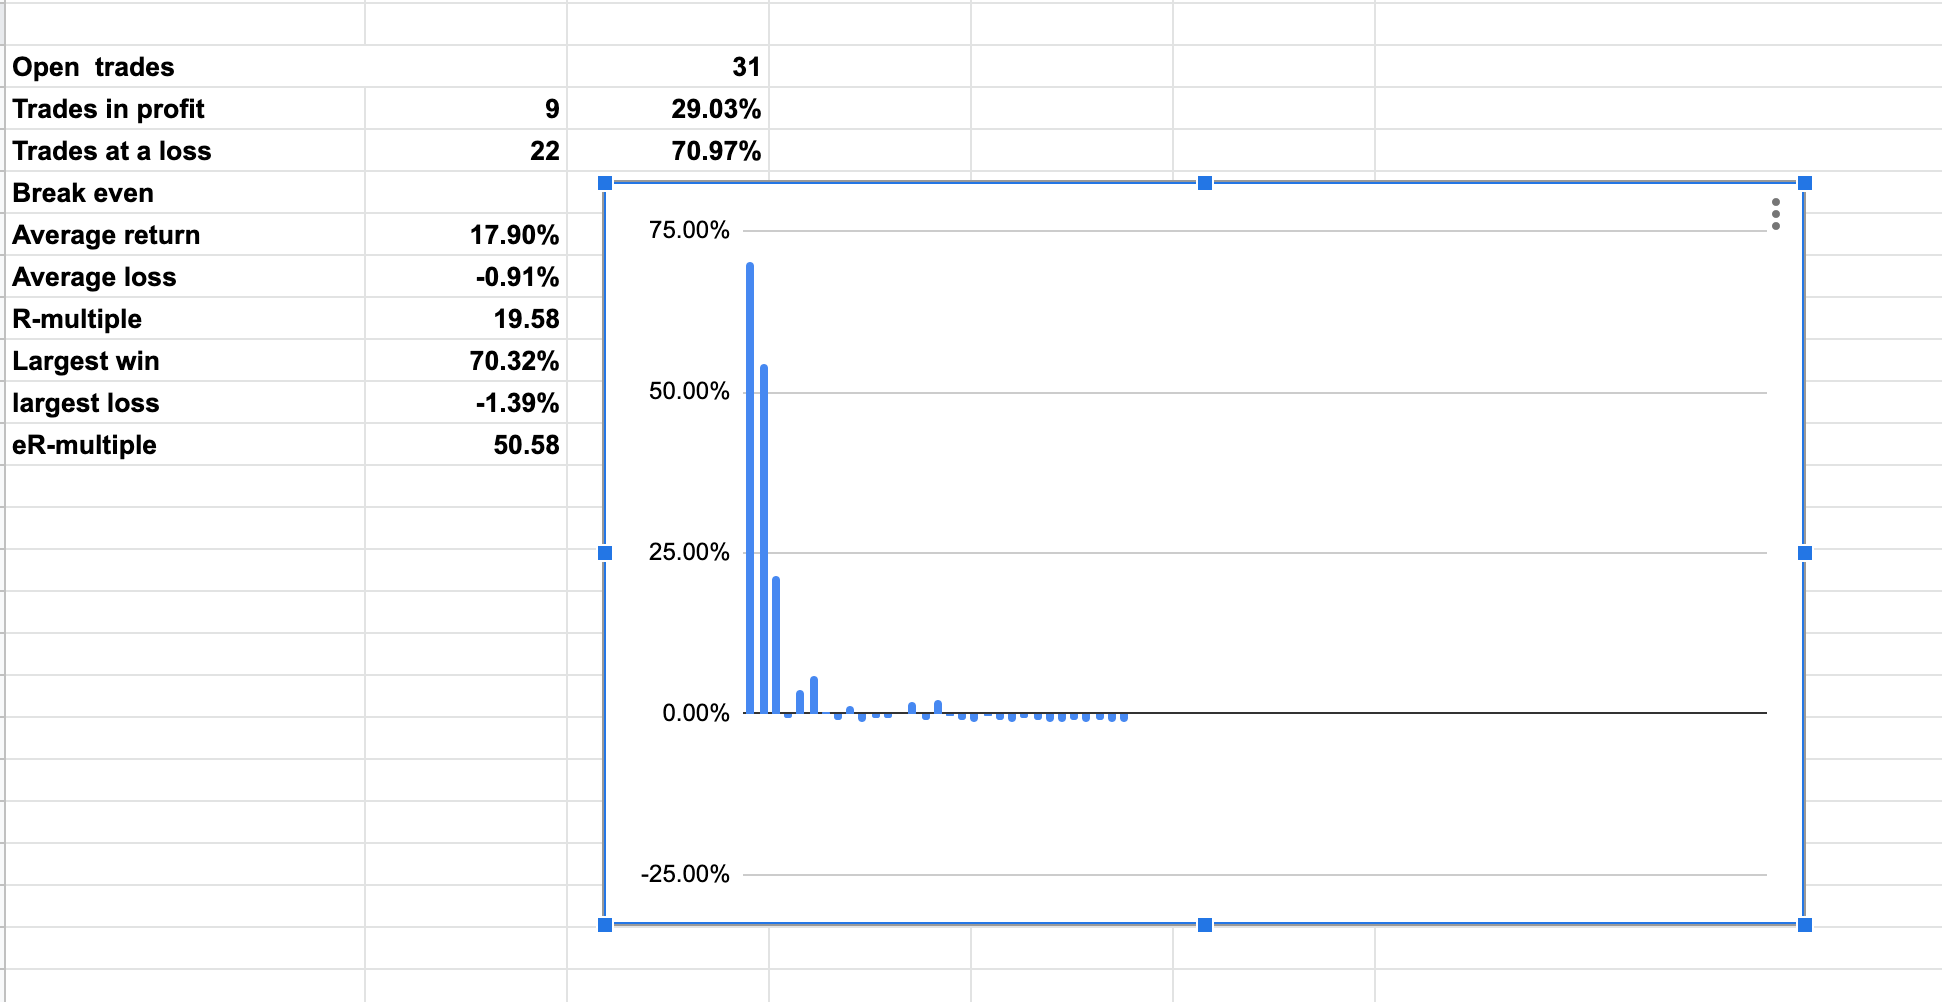
Open trades statistics and distribution assuming all stops are hit

Thank you for reaching far. For any questions feel free to email me at njabulo@villagetrader.co.za
]]>
My Shopping list for 14 February 2022
Here’s this weeks stocks in play
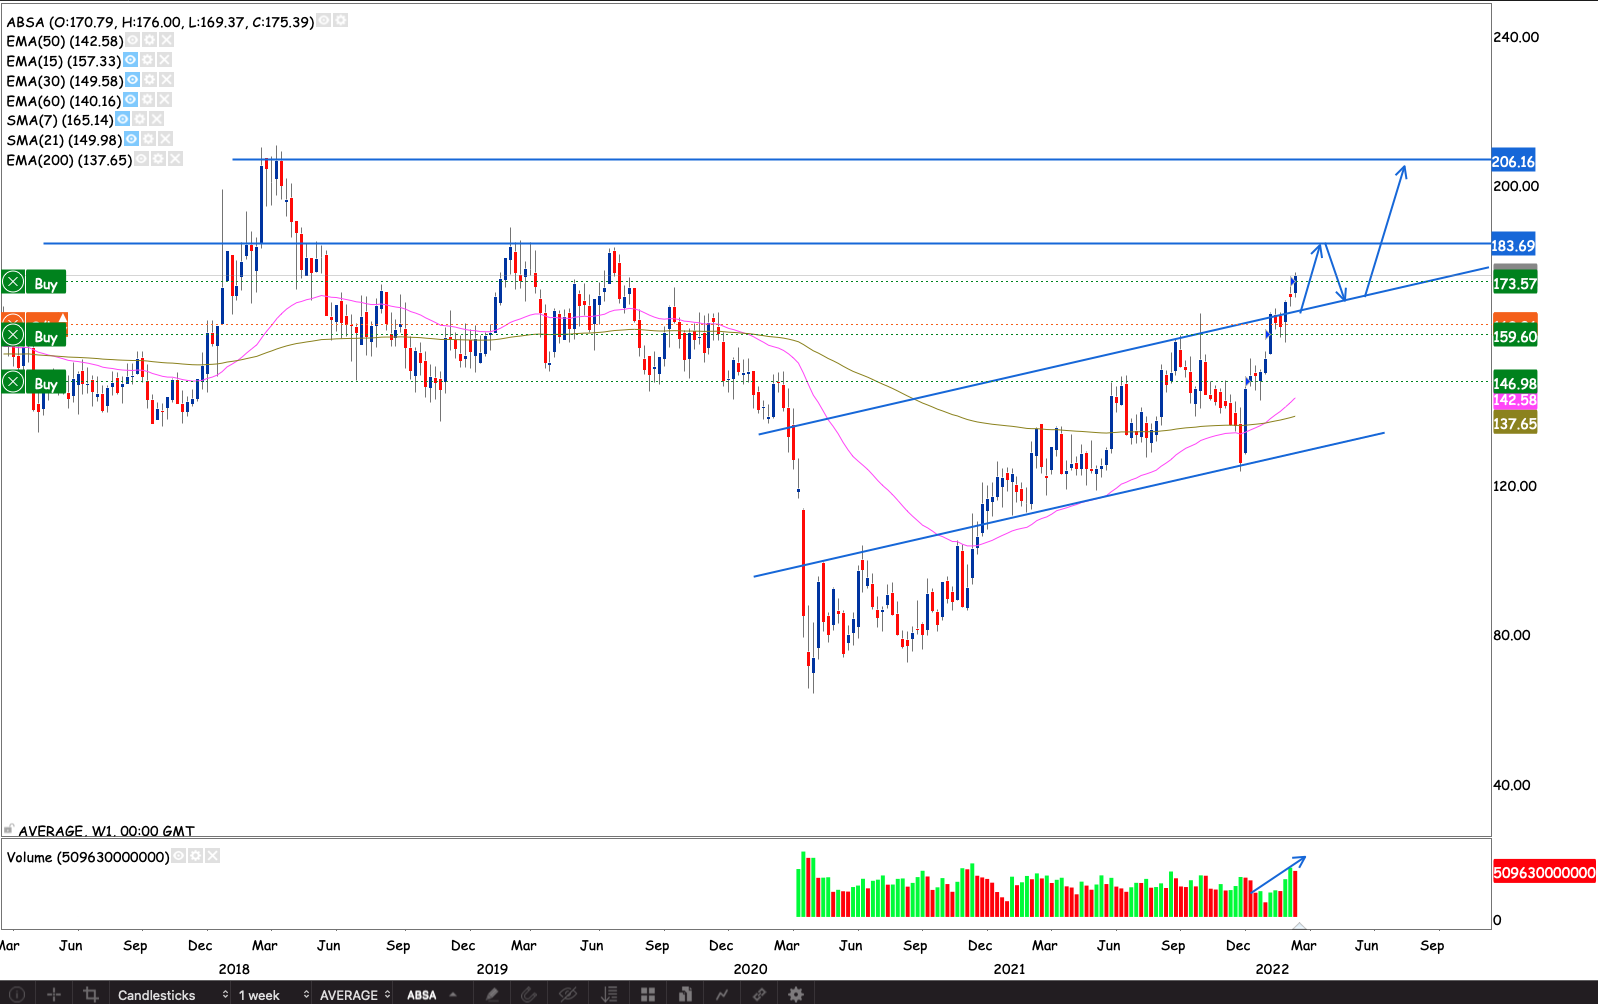
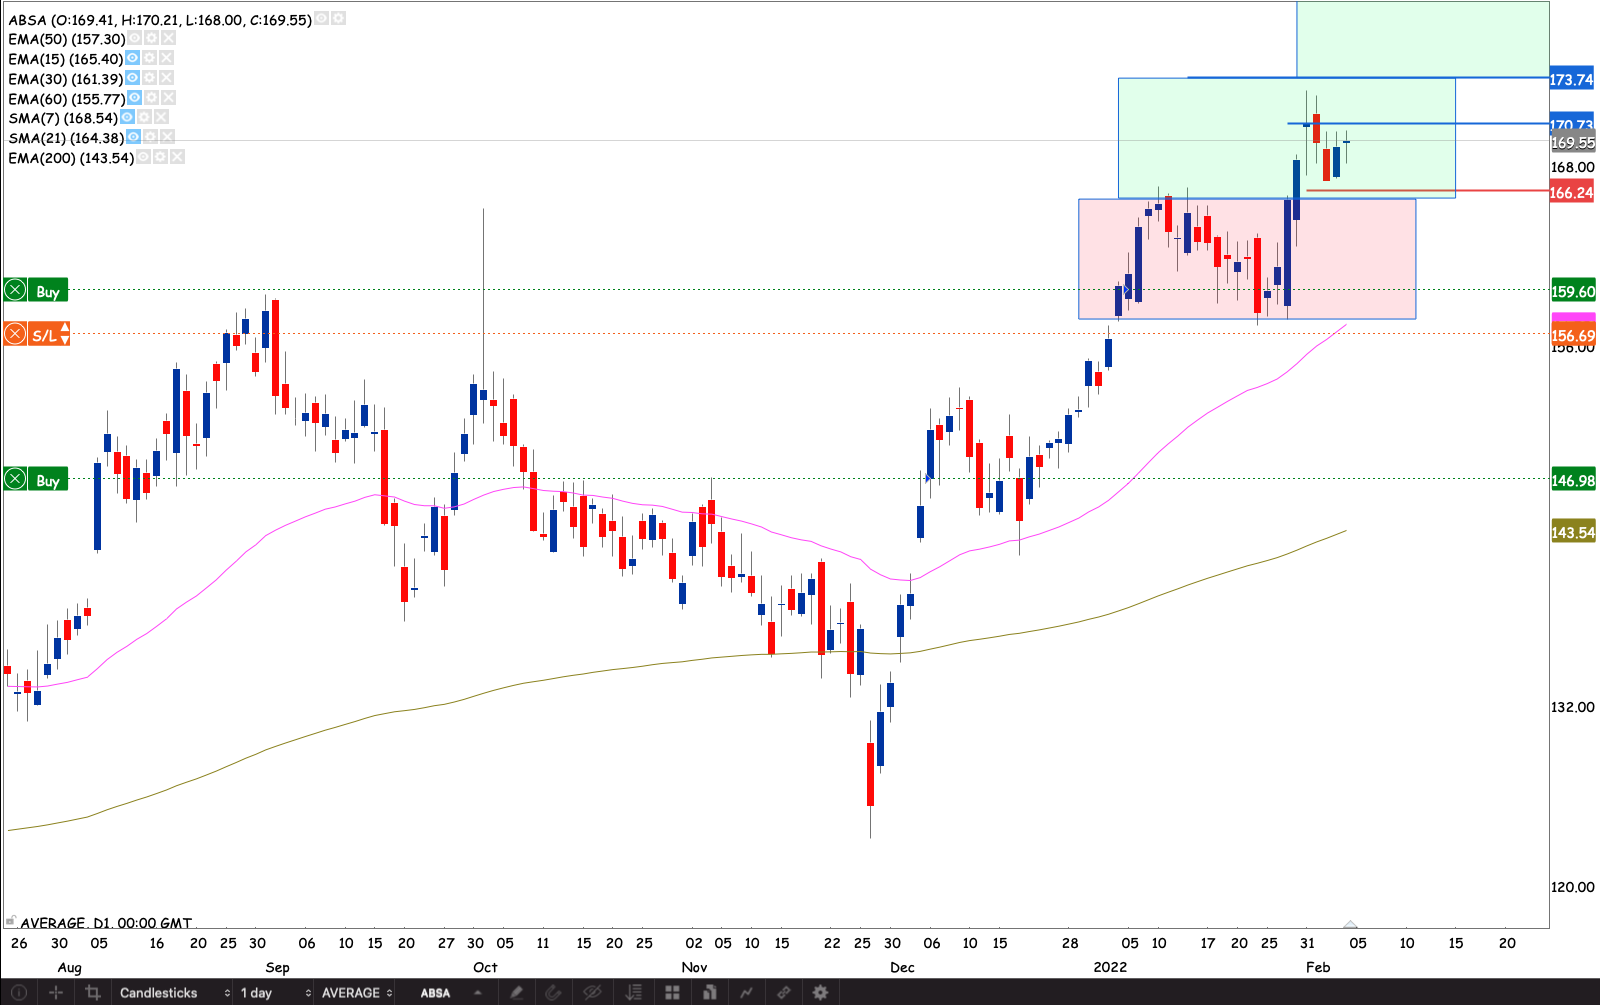
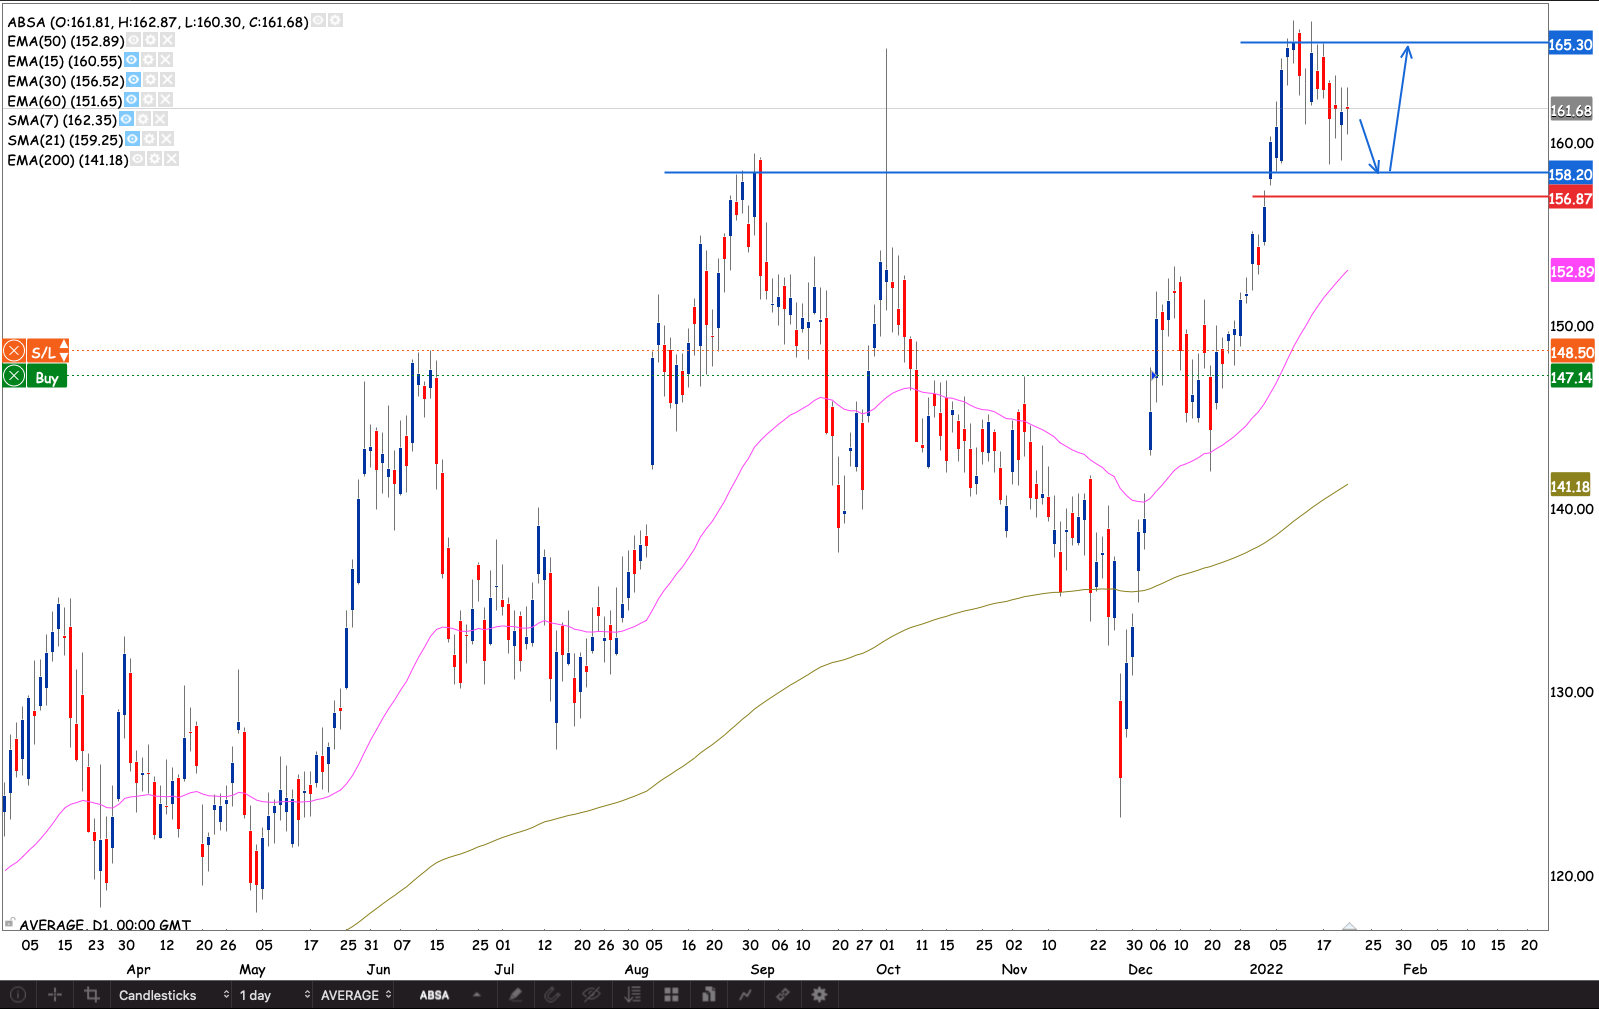
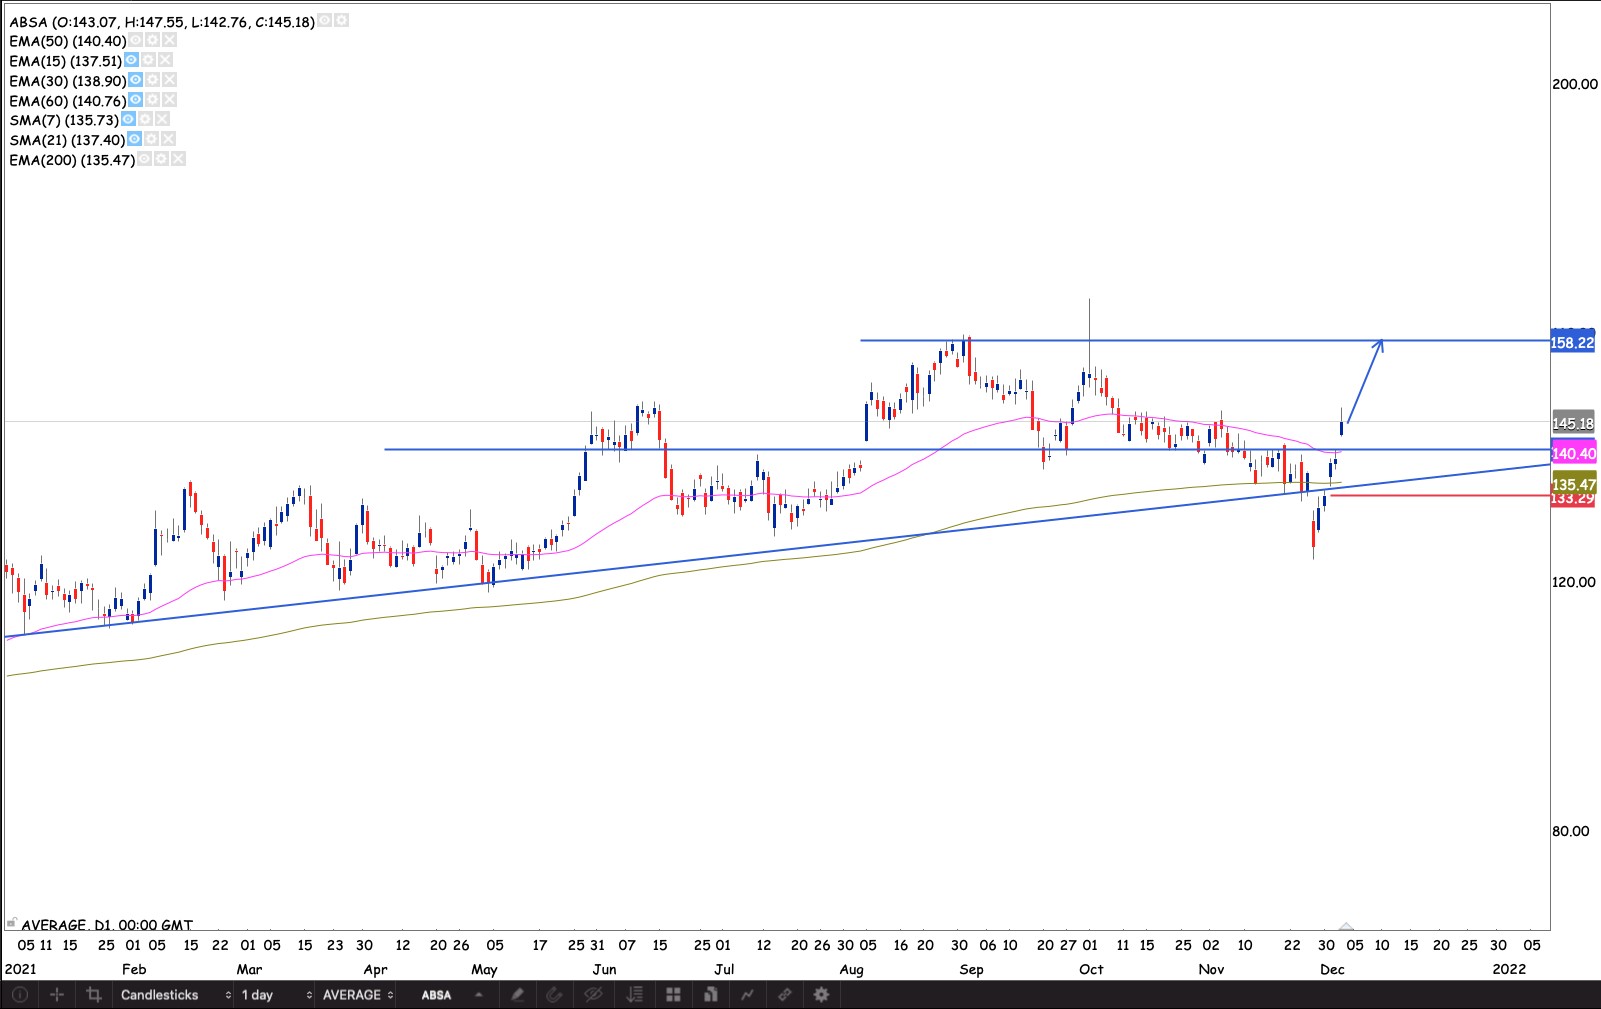
Absa
Absa continued to run, breaking through the uptrend channel on the up side. There’s an old resistance at R183. I expect the market to remember this level. We could see the stock retest the up trend resistance from the other side. I’m waiting for a close through the R183.70. I will raise and maybe add to the position.
Capitec
The stock held the 50 day EMA. Closed Friday bullish engulfing candle, started the week with one. I’m waiting for a new high close. Above R2174.95. I will raise my stop loss to R2015 just below the 50 day EMA

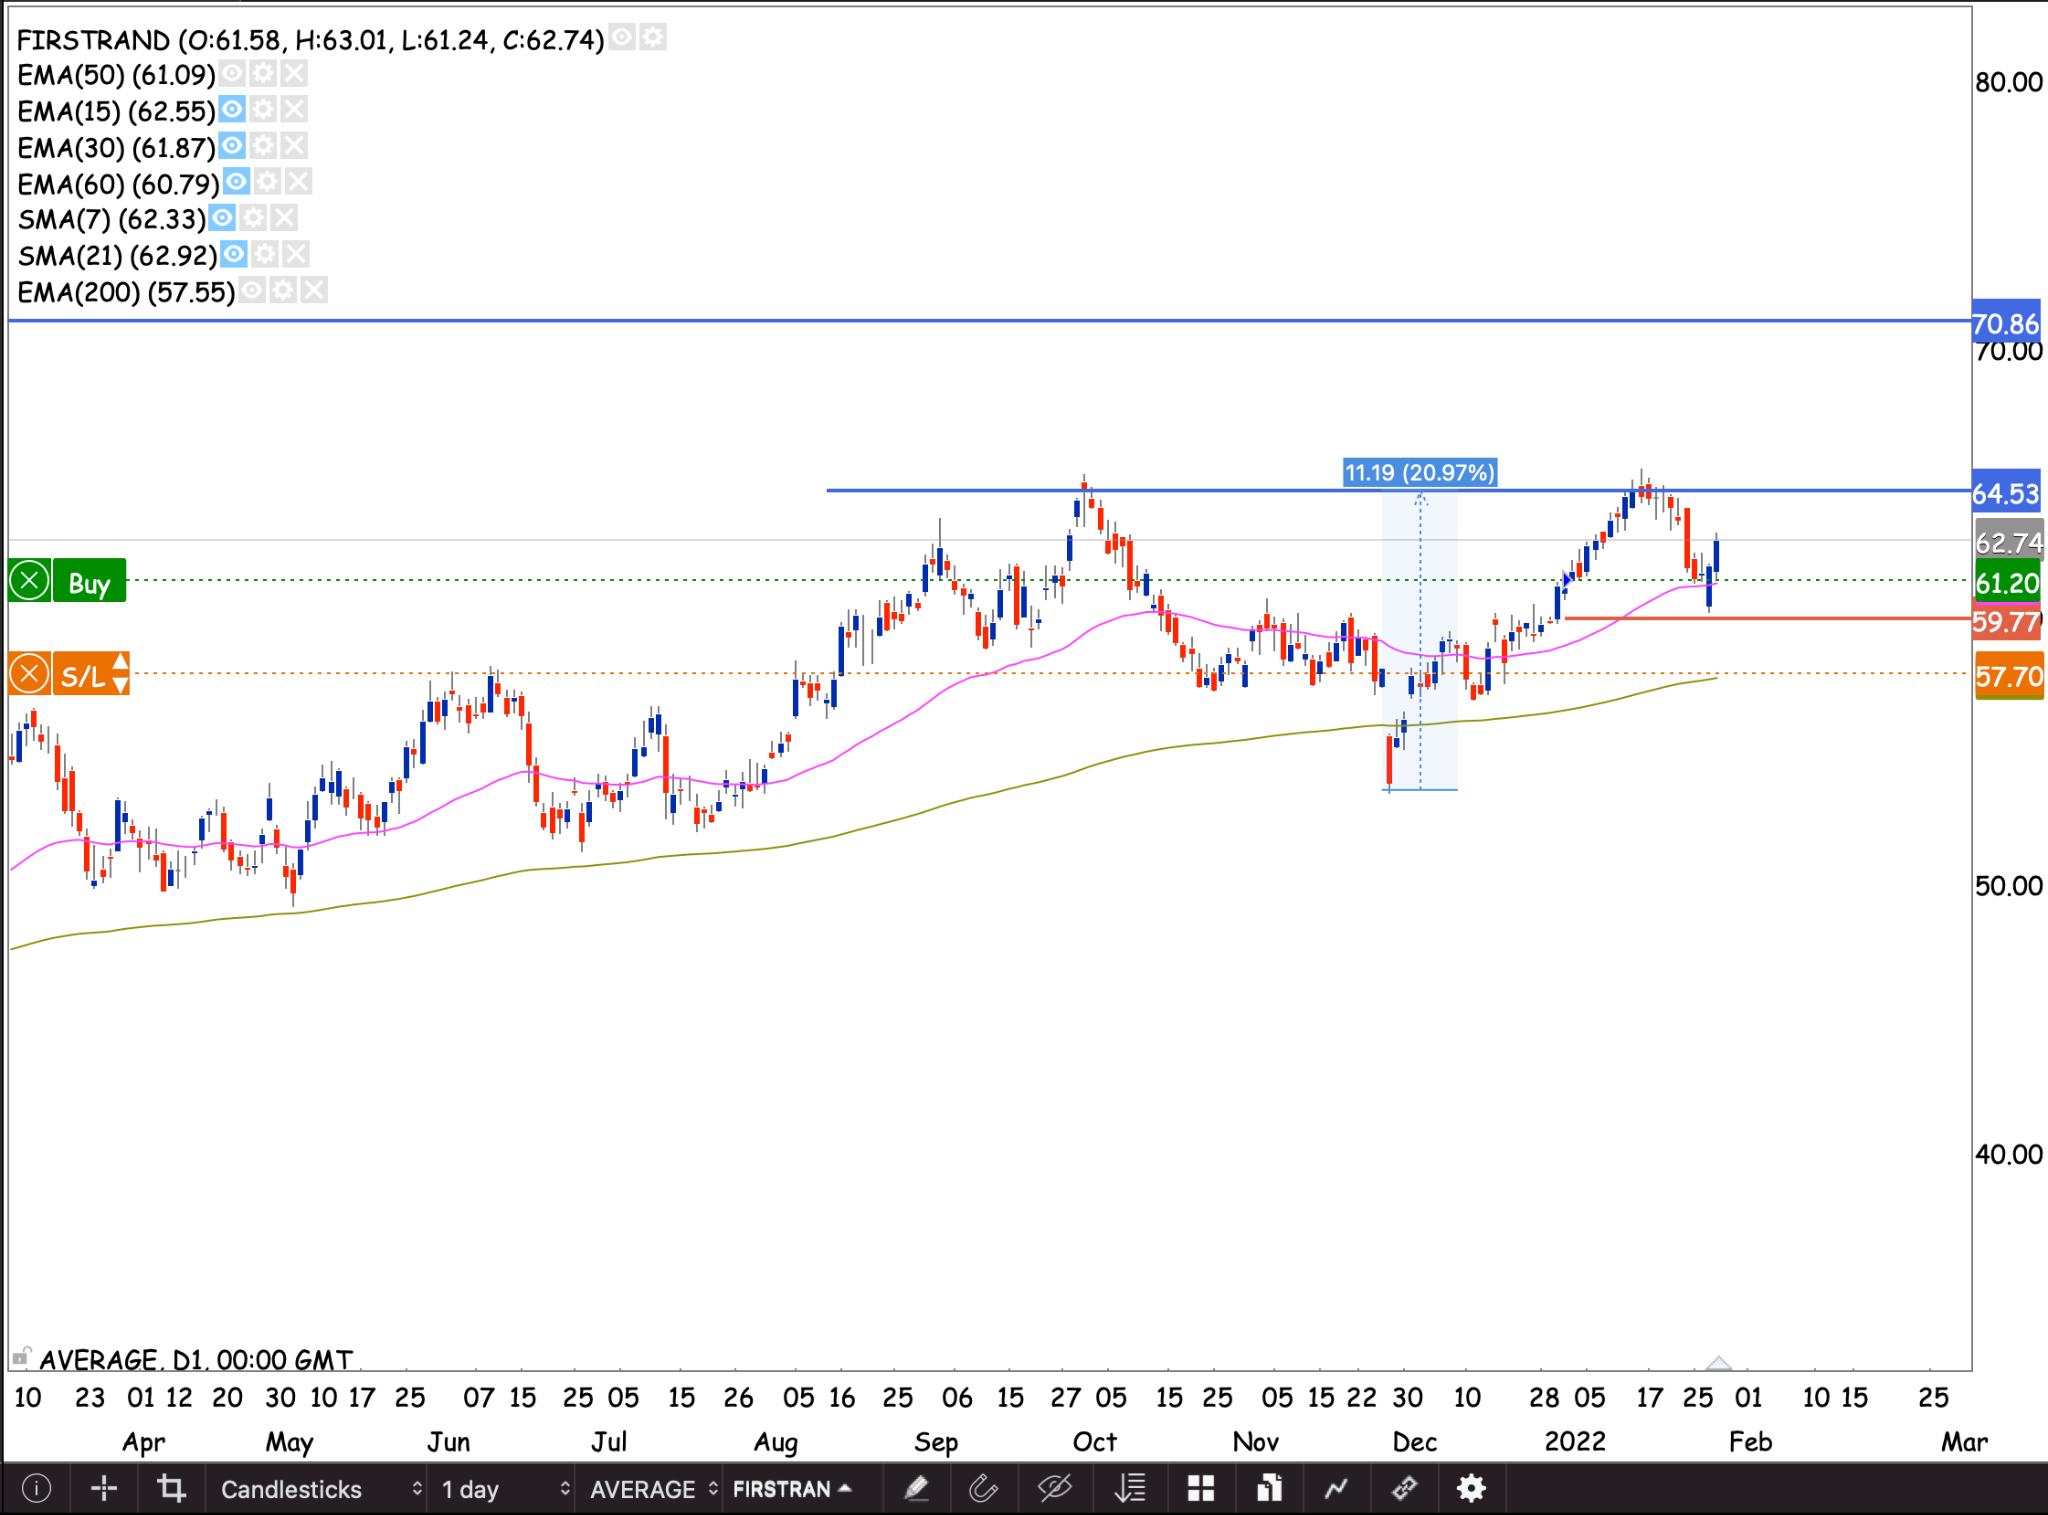
FirstRand
We have a nice and wide head and Shoulders pattern with a higher right shoulder. Completing the pattern with a bullish engulfing weekend breakout. I raised my stop loss to R61.23. Bringing the risk on my position to break even. I will add another 1% risk on the position with 21.9 shares.

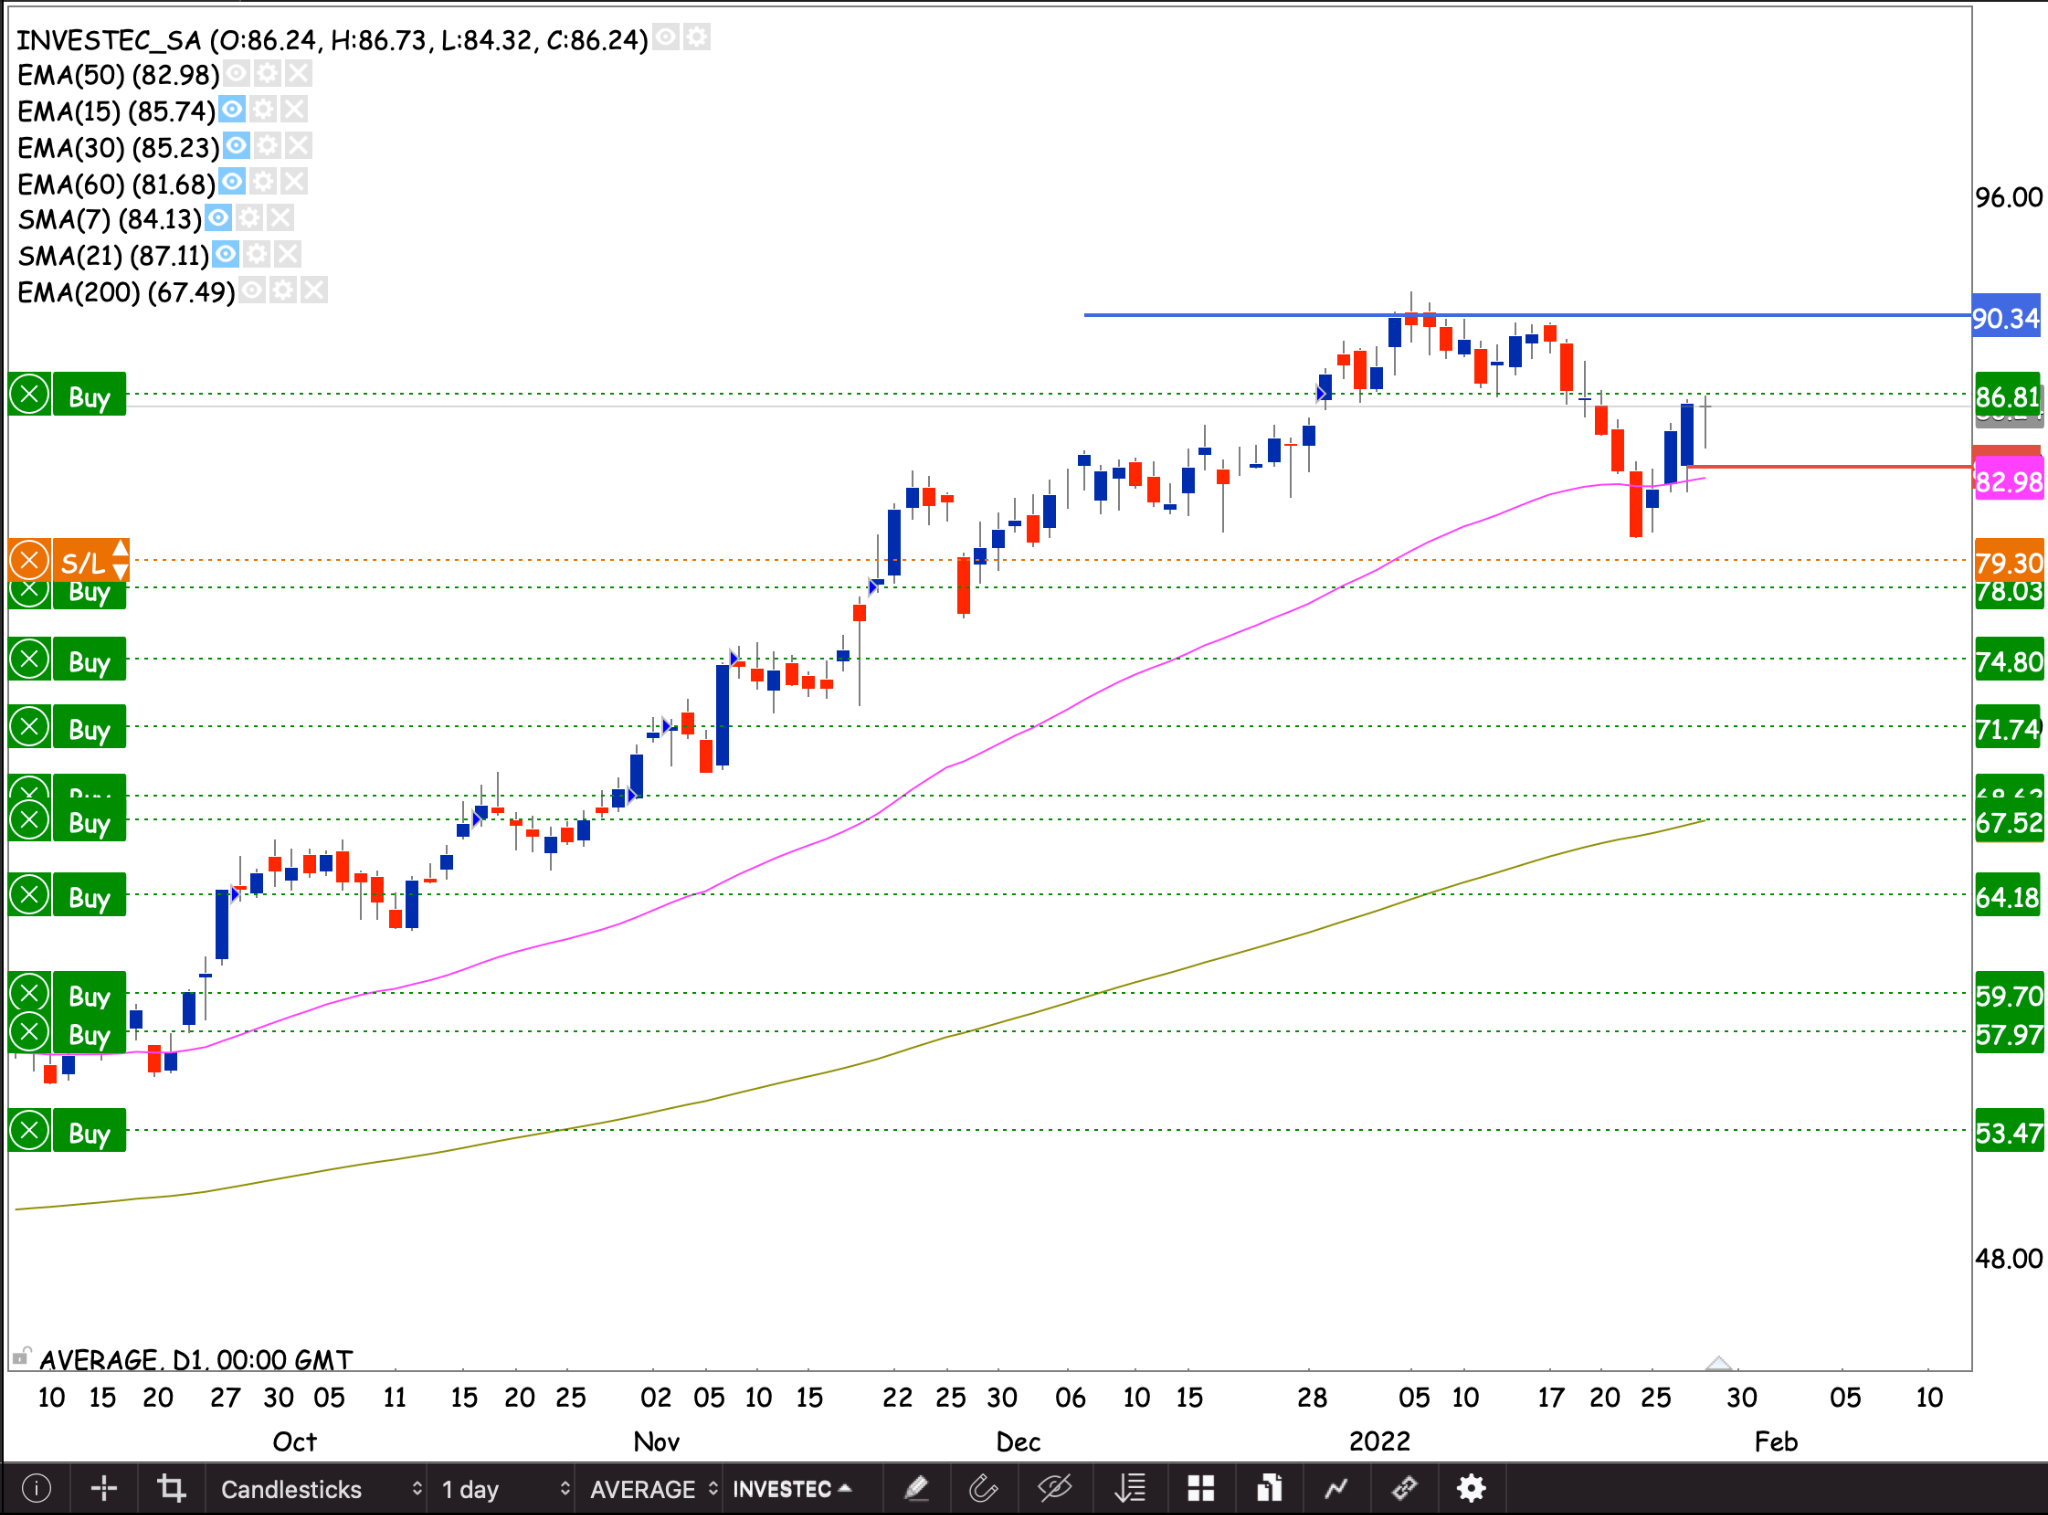
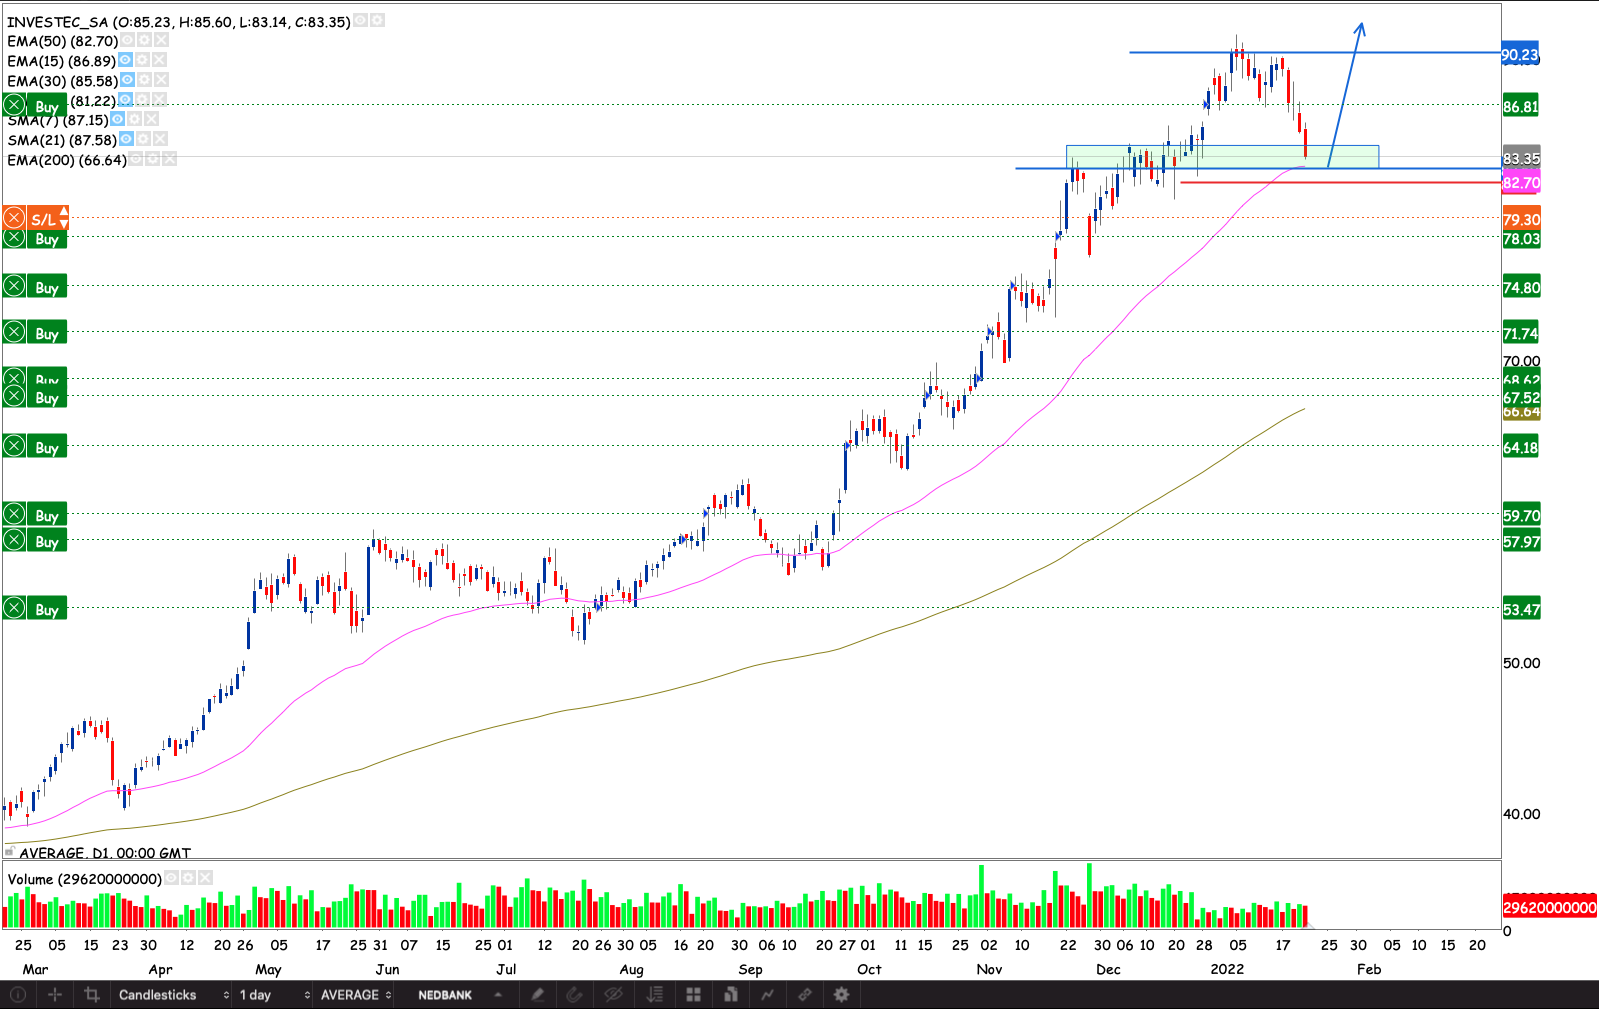
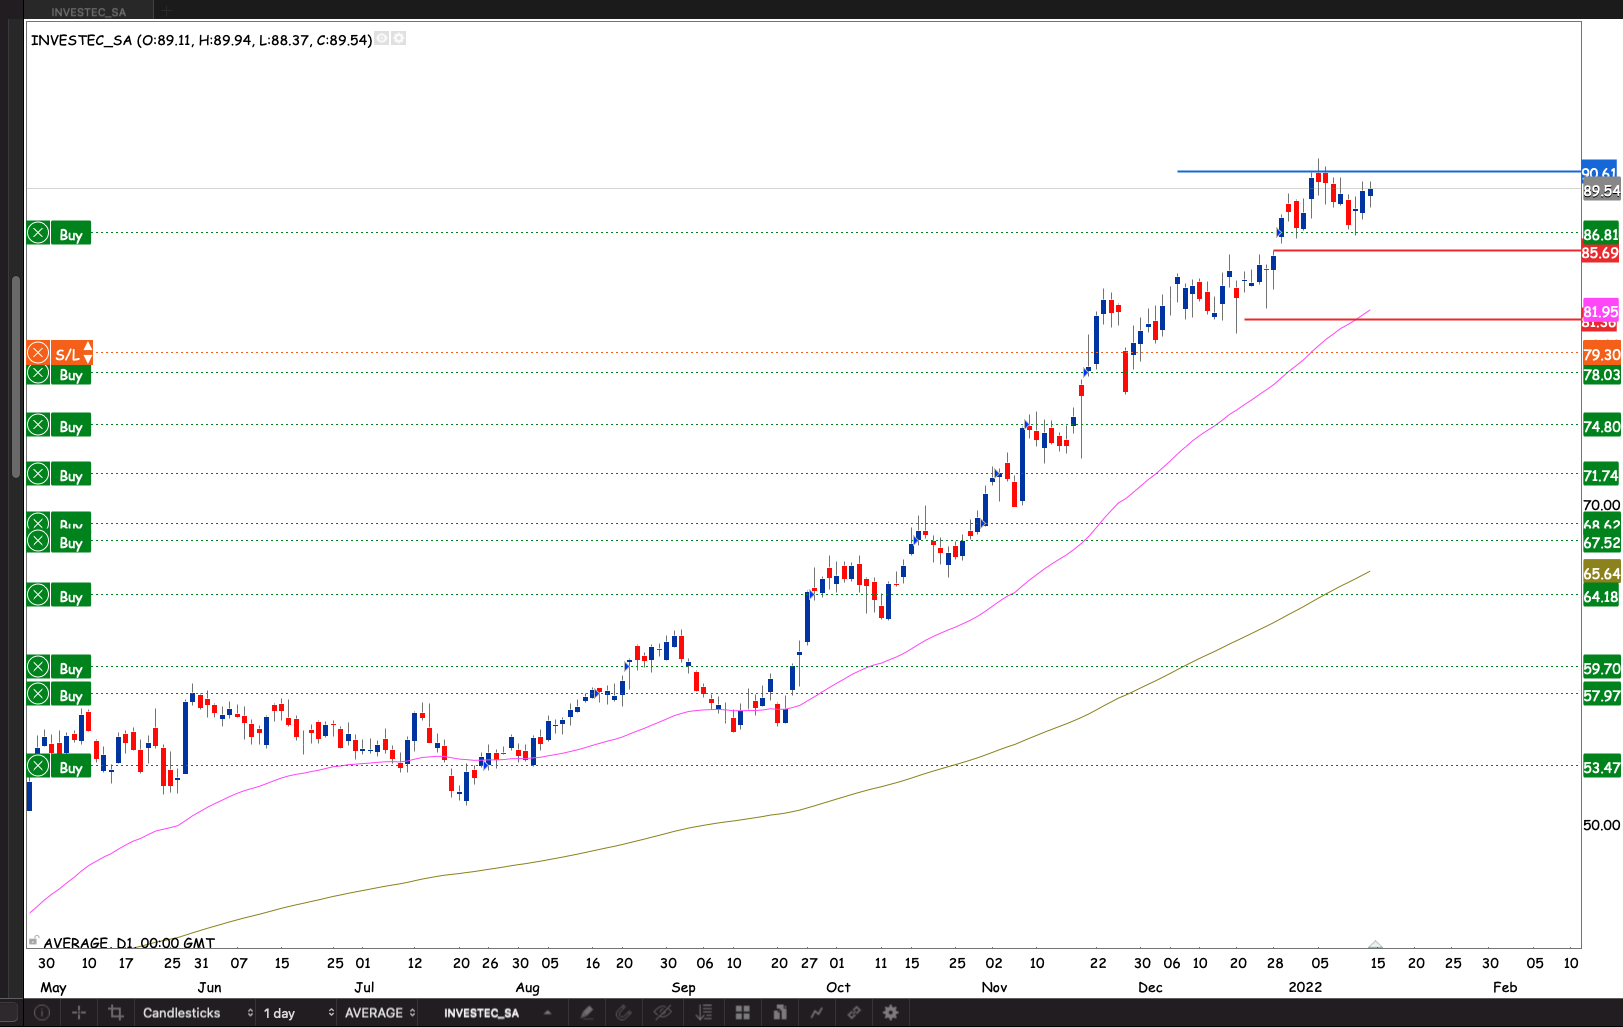
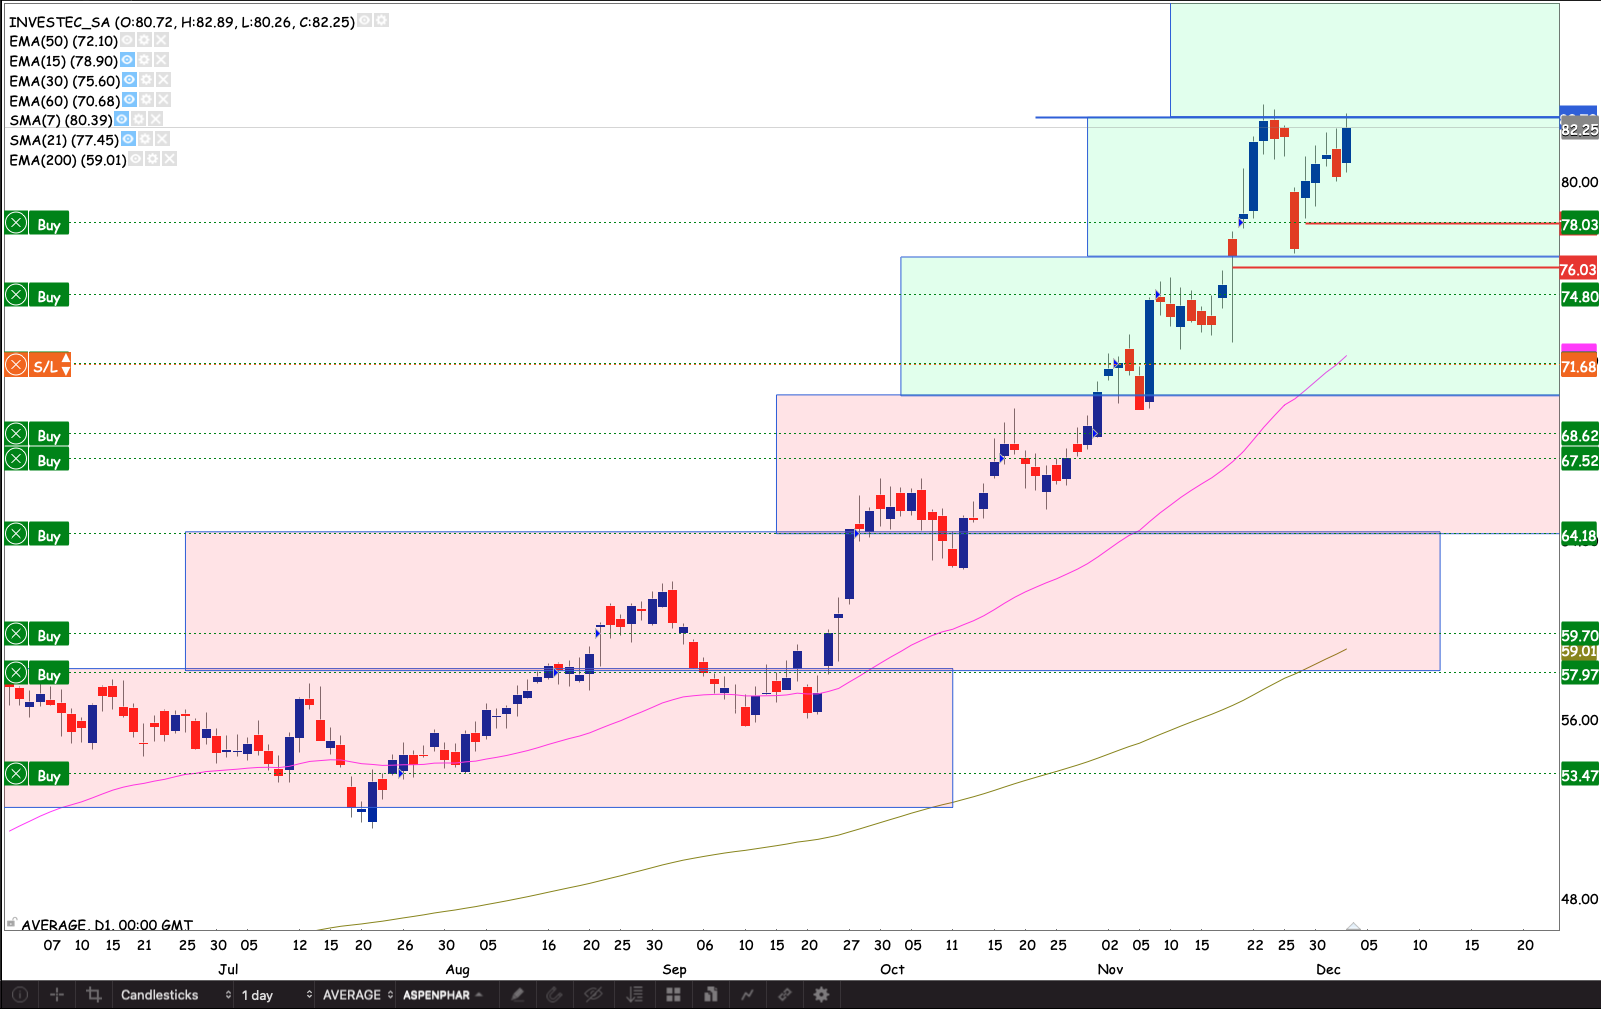
Investec
The stock moved to a higher box. The stock ran into some selling at R94.85. I will monitor this level for another reaction. If it continues to hold. I will add to my position on the break above it. Otherwise I will add the position on the break to the higher box.

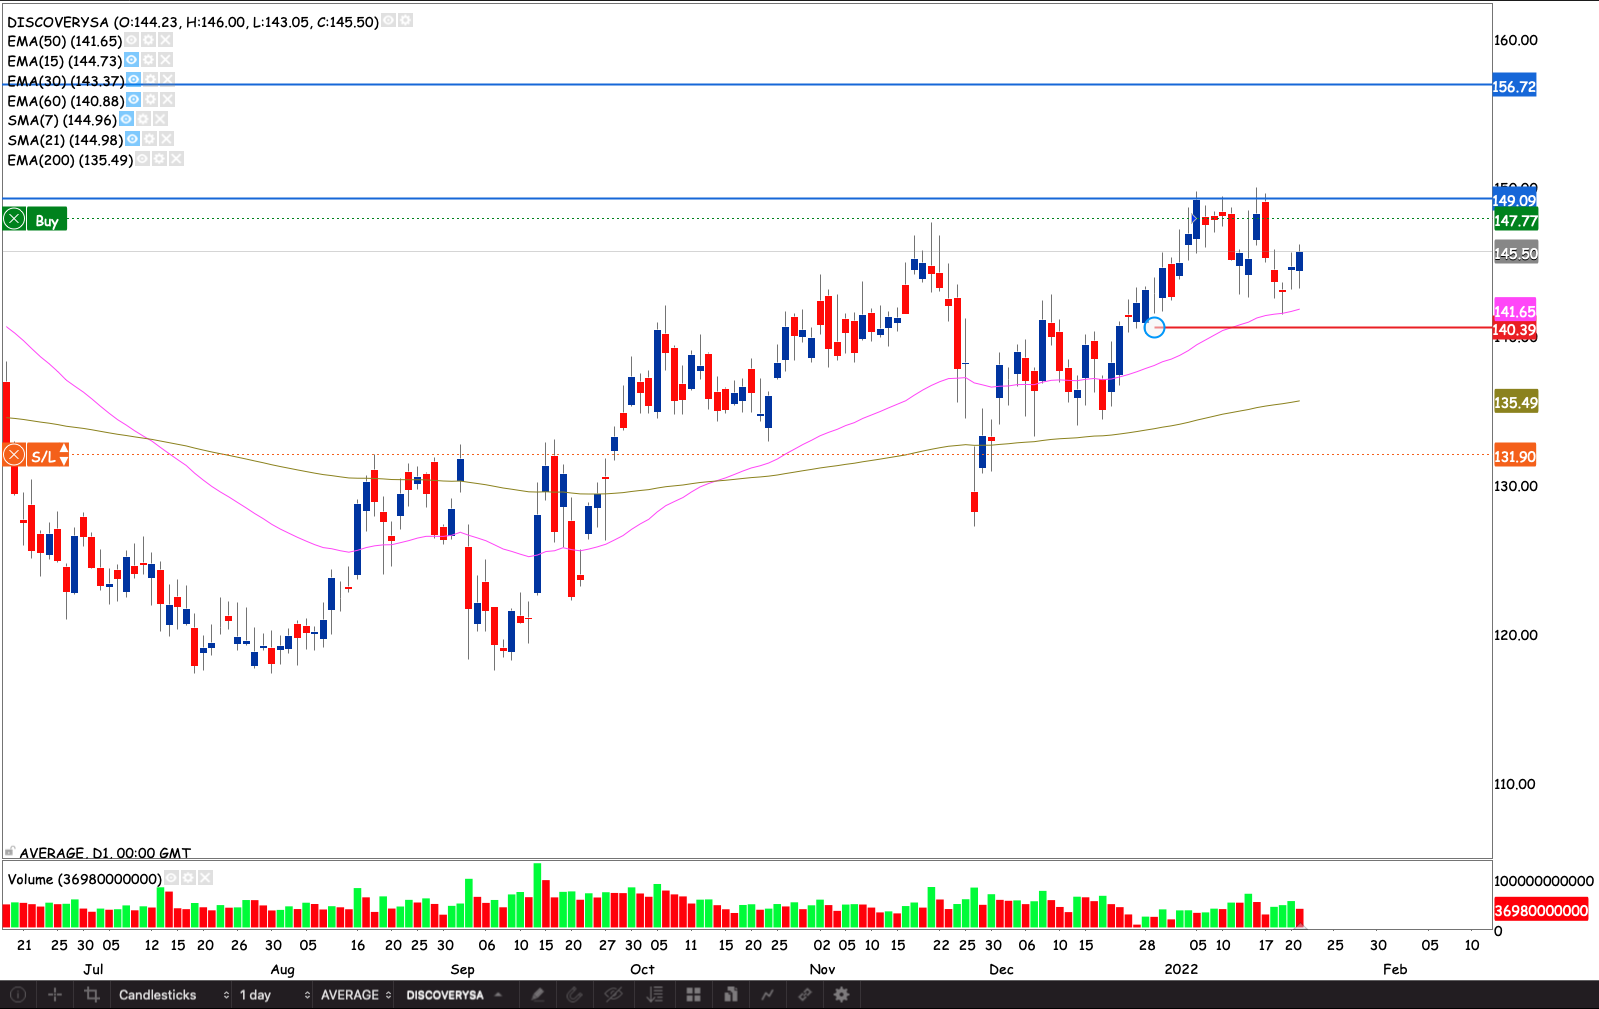
Discovery
This stock has displayed my favorite kind of breakout. The one in which it breaks and doesn’t look back. There’s an old resistance at R166. I think the stock we react at the resistance to resttest the trend line from the other side before breaking through R166

Sanlam
The insurer finally broke through R65. The stock is now back above pre-covid crash prices for the first time. Closing through the 200 week EMA. I started building a position, I have ambitious targets at R84.50 & R95.75

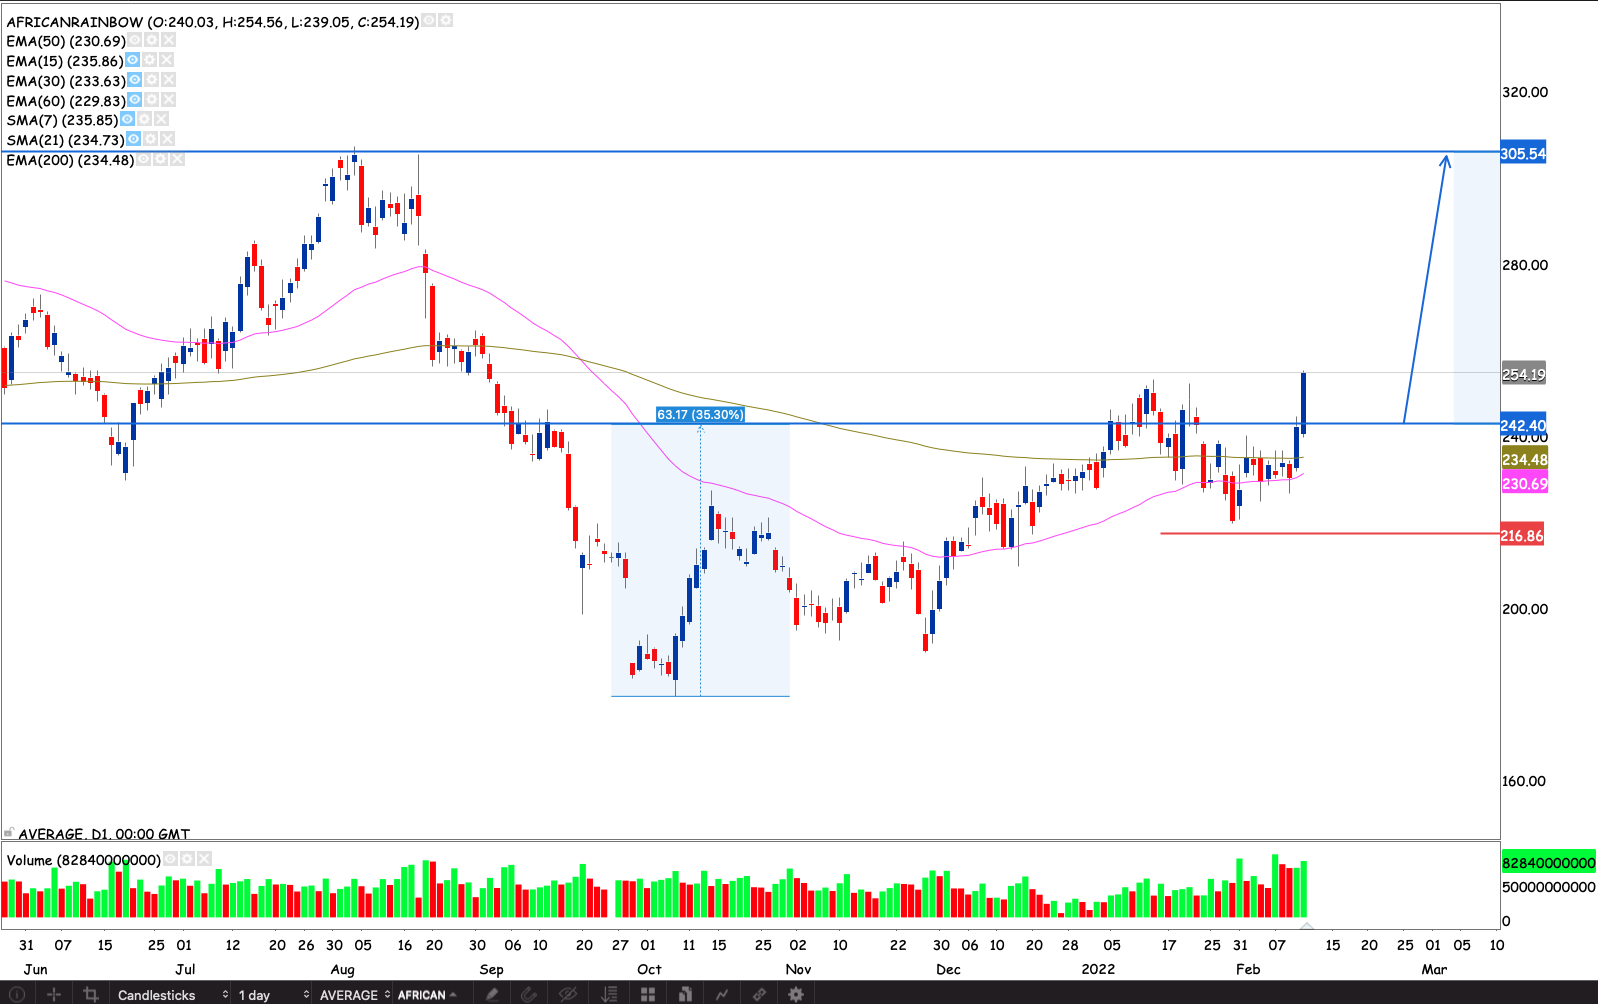
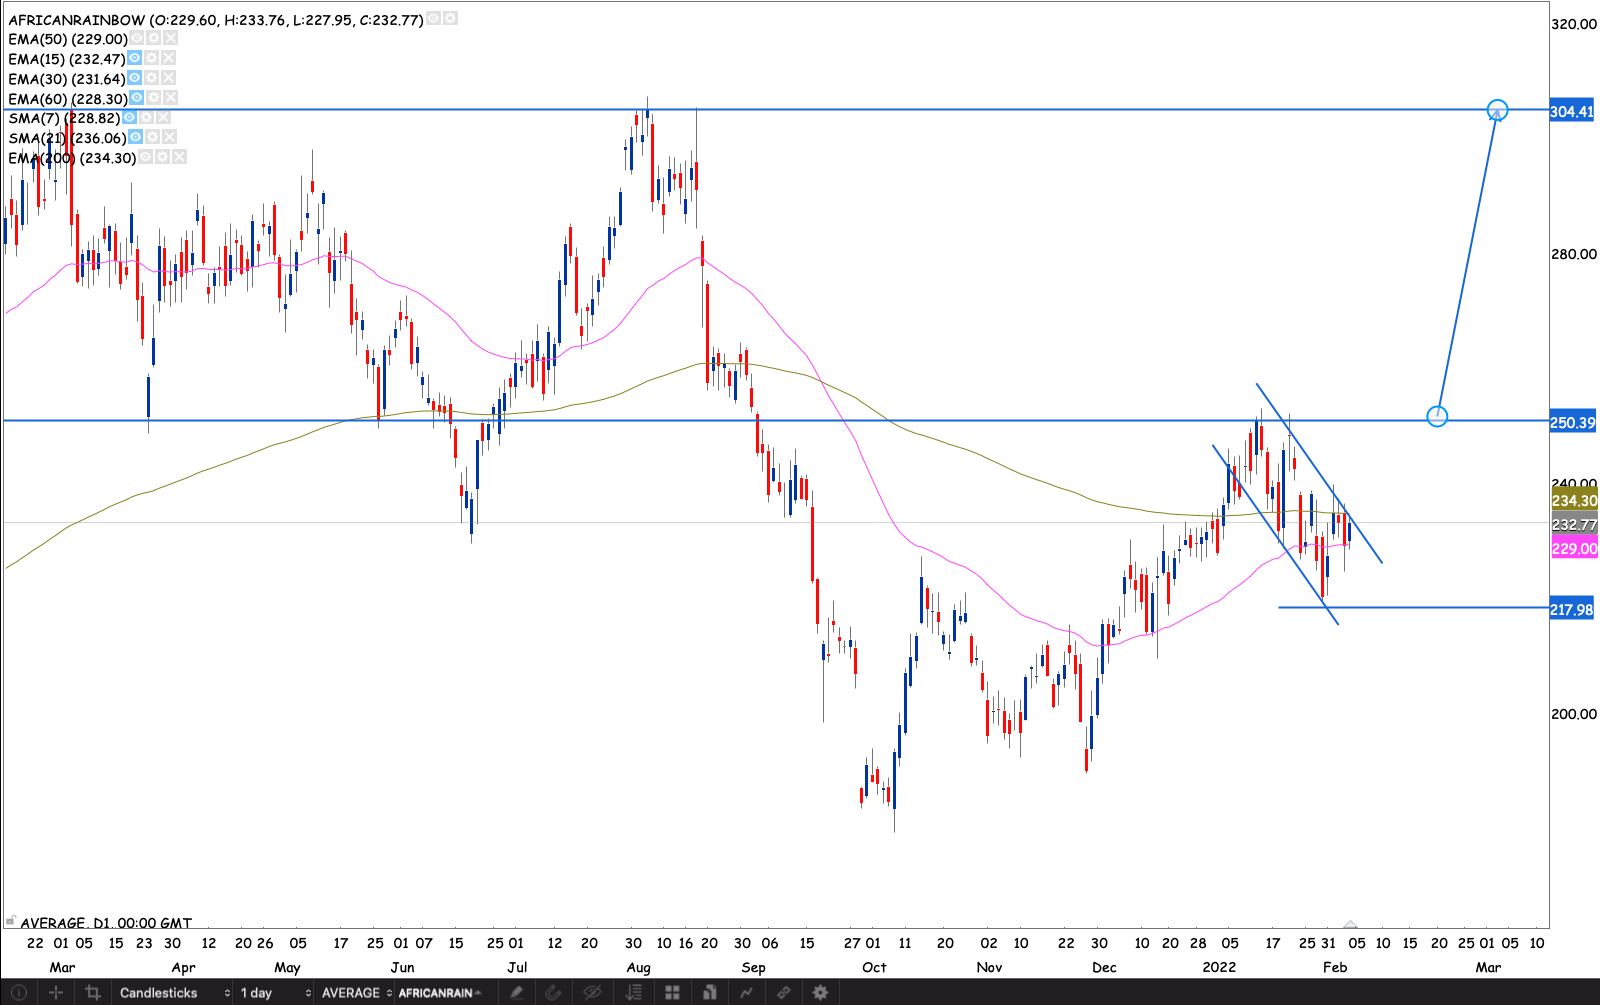
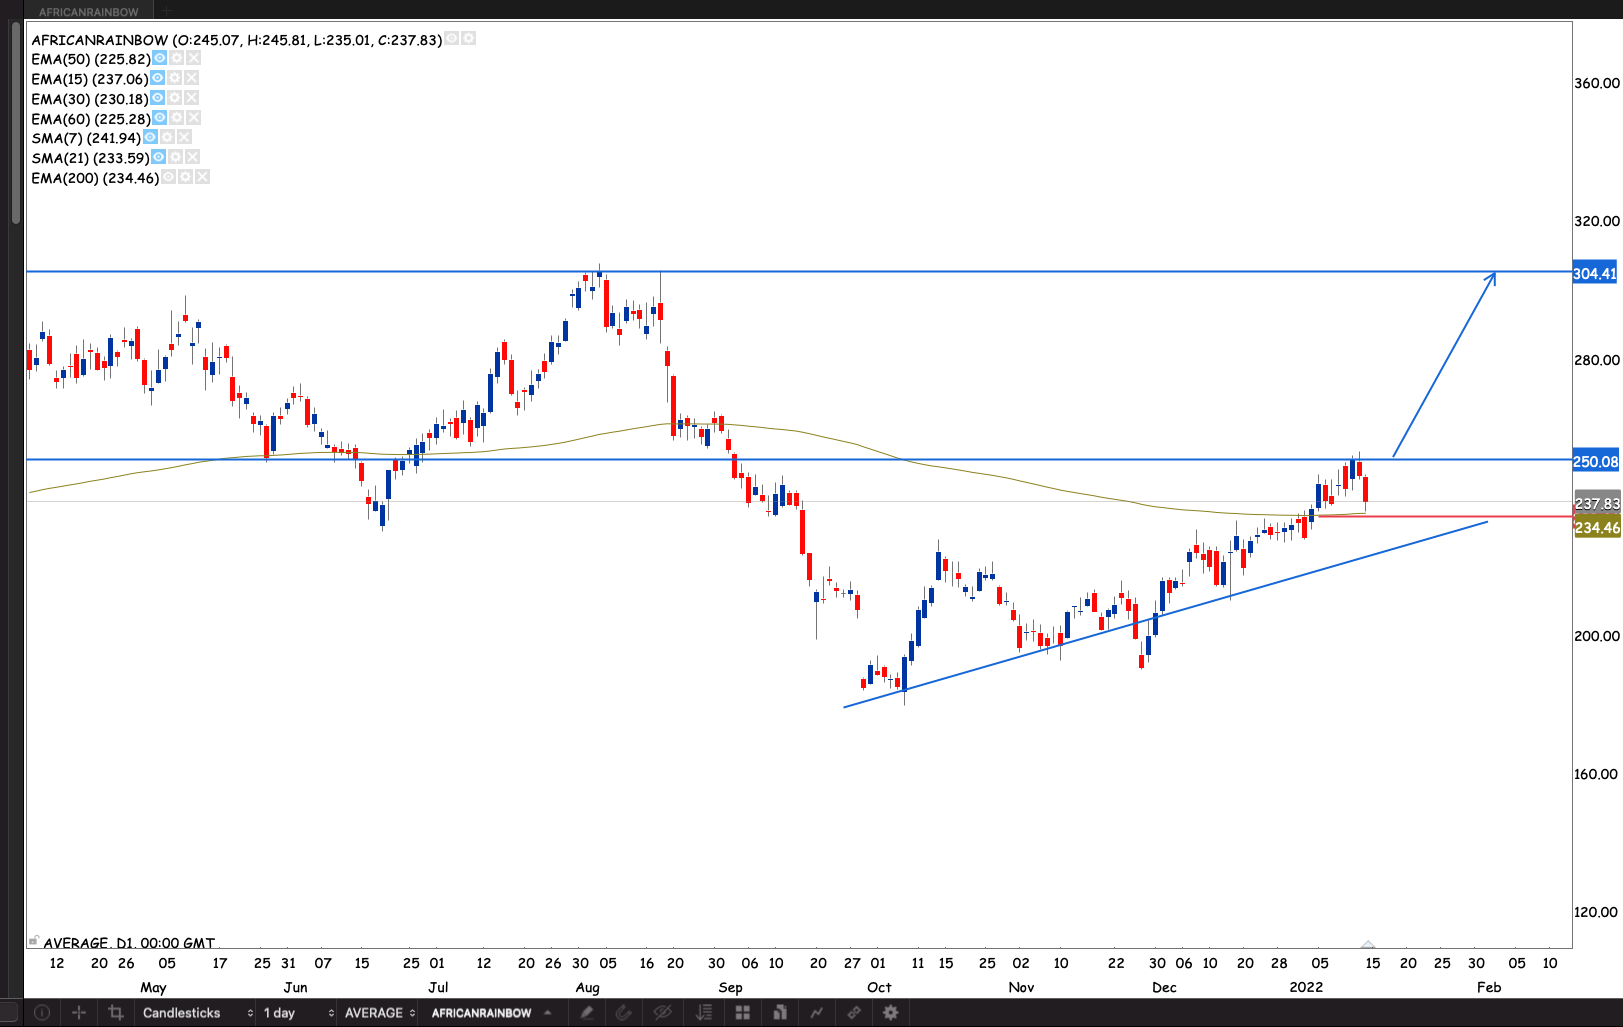
African Rainbow Mineral
We have a cup & and handle breakout on the weekly chart. For a R305 target. I took a position in my small R350 challenge portfolio. However the 50 day EMA is still below the 200 day. So on my main portfolio I’m gonna have to sit this one out. Till at least above R305.
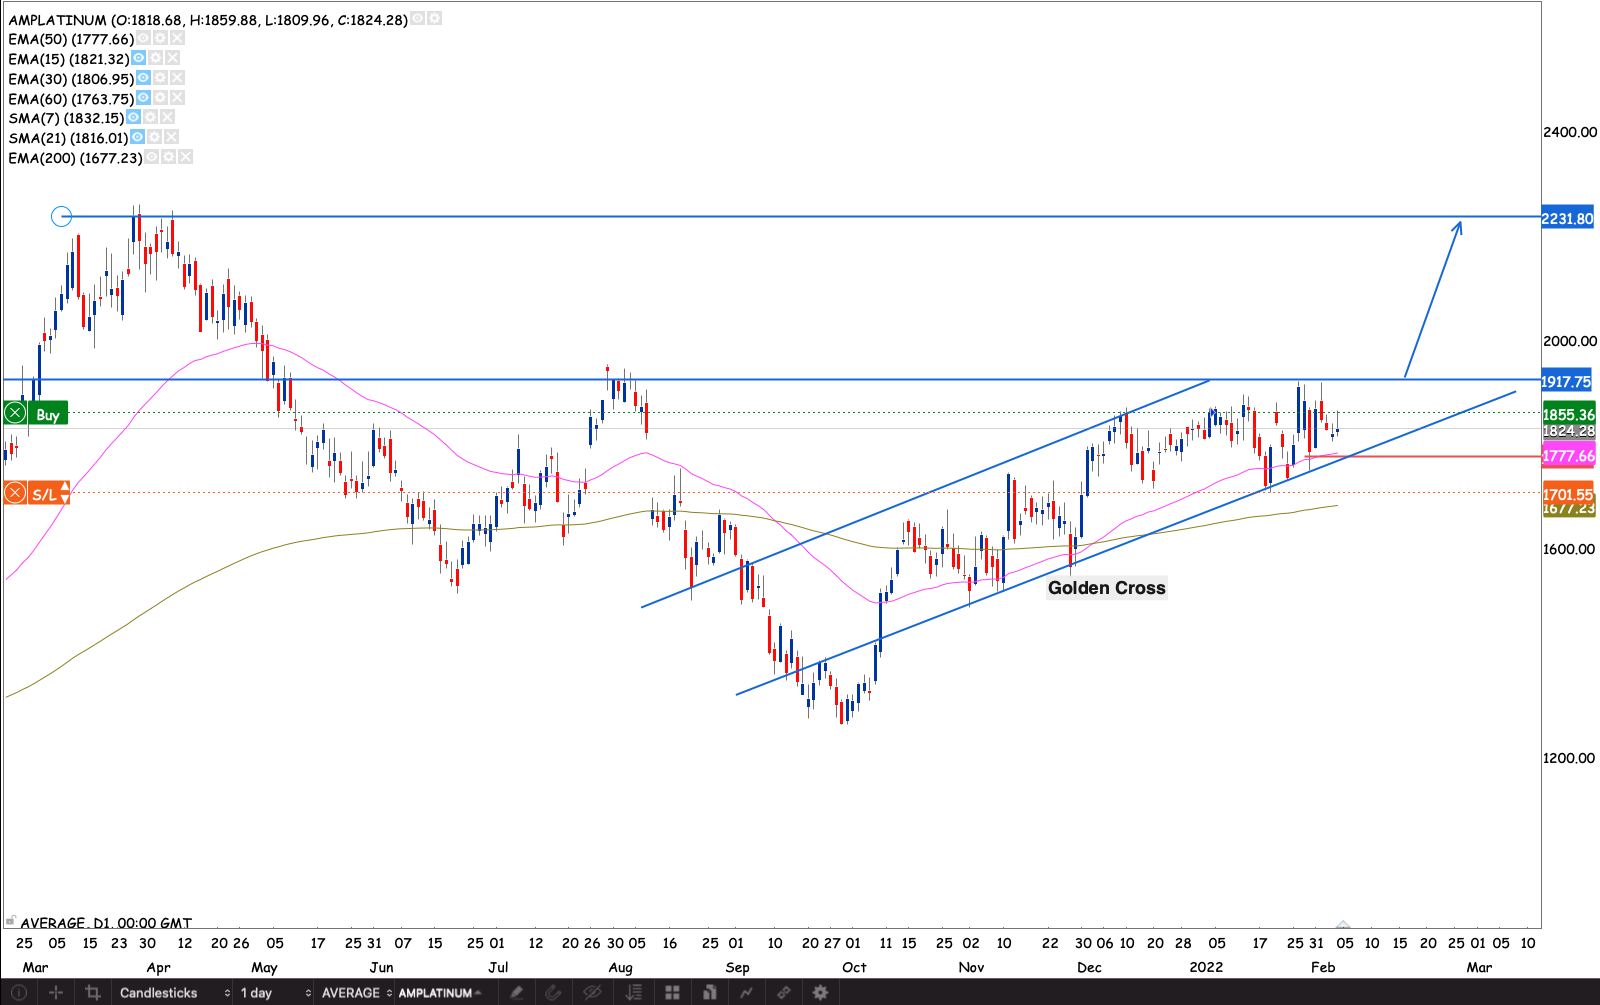
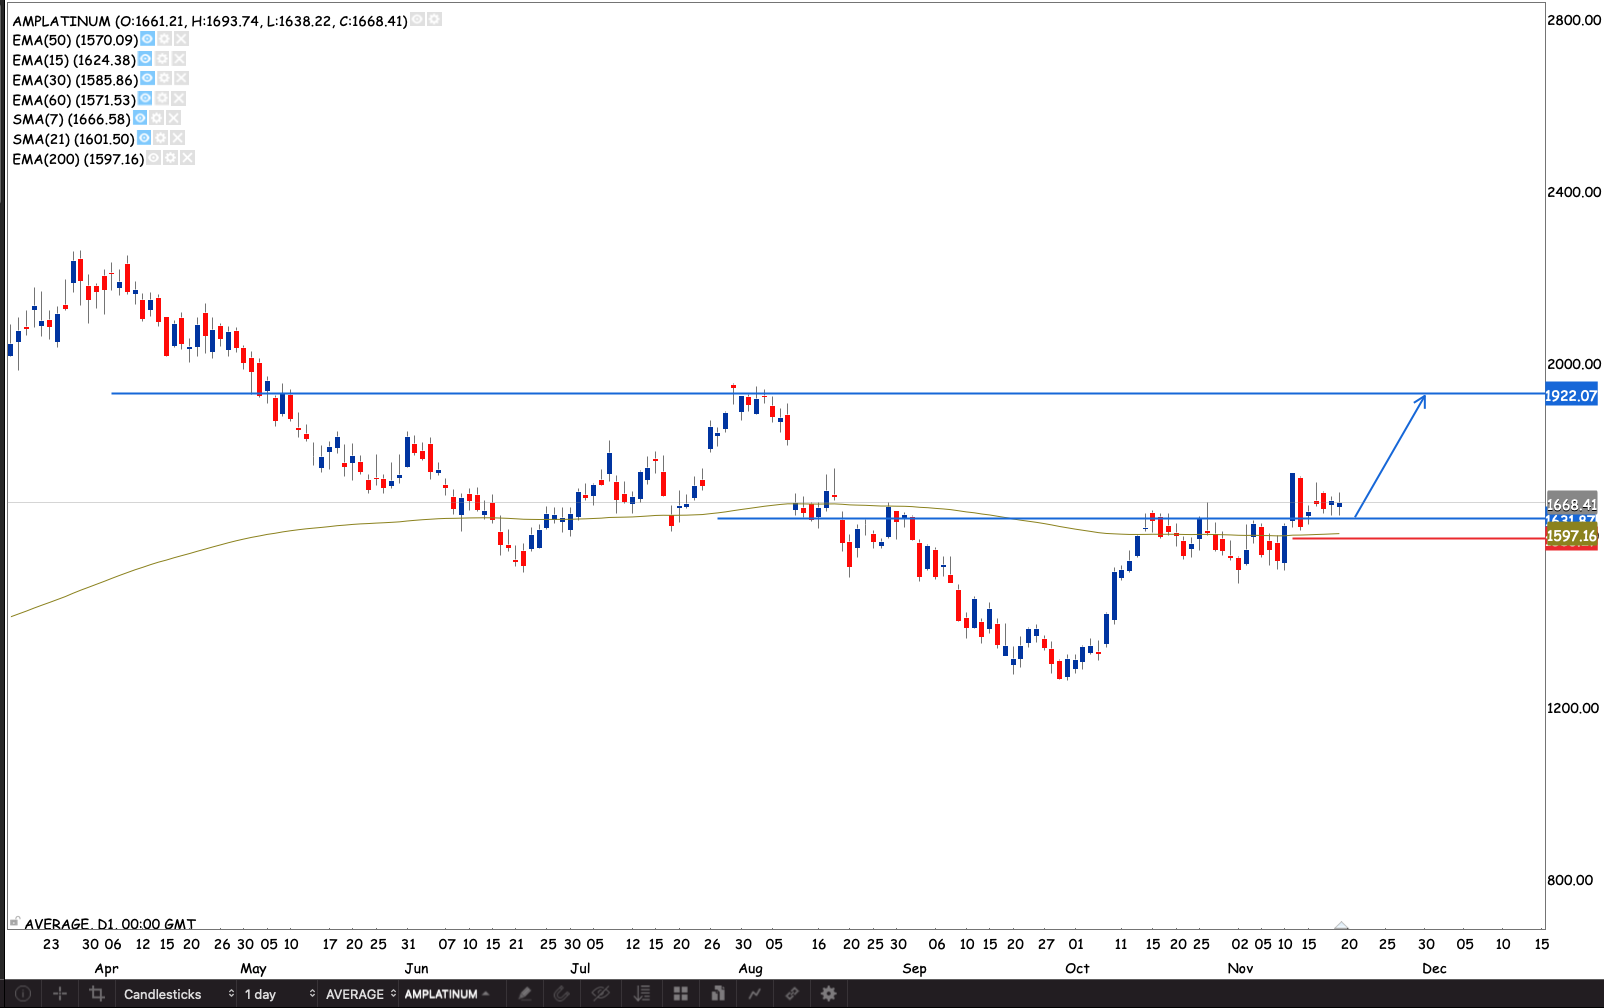
Amplats
The stock broke the R1921 resistance. Raised my stop loss to R1762 reducing to -1.06%. I have a R2231 target on the stock. Rising commodity price is the wind need to to support the breakout and the golden cross

Sibanye
The trendline is steeper after the stock came above the 200 day EMA. We’re quite close to having a golden cross. Monitoring for a break above R60 to take a closer interest in the stock

AngloGold
With gold seemingly breaking out a 103 week long symmetrical triangle. If the break hold we could see a strong rally in gold and consequently in gold miners. I’m turning on gold stocks to bullish. We have a nice bullish flag as the stock consolidates from the initial rally from R215 lows. I’m going to look for a breakout on the daily chart. As the stock comes back above 50 & 200 EMAs. We had a golden closs a few weeks ago. I have a R420 target
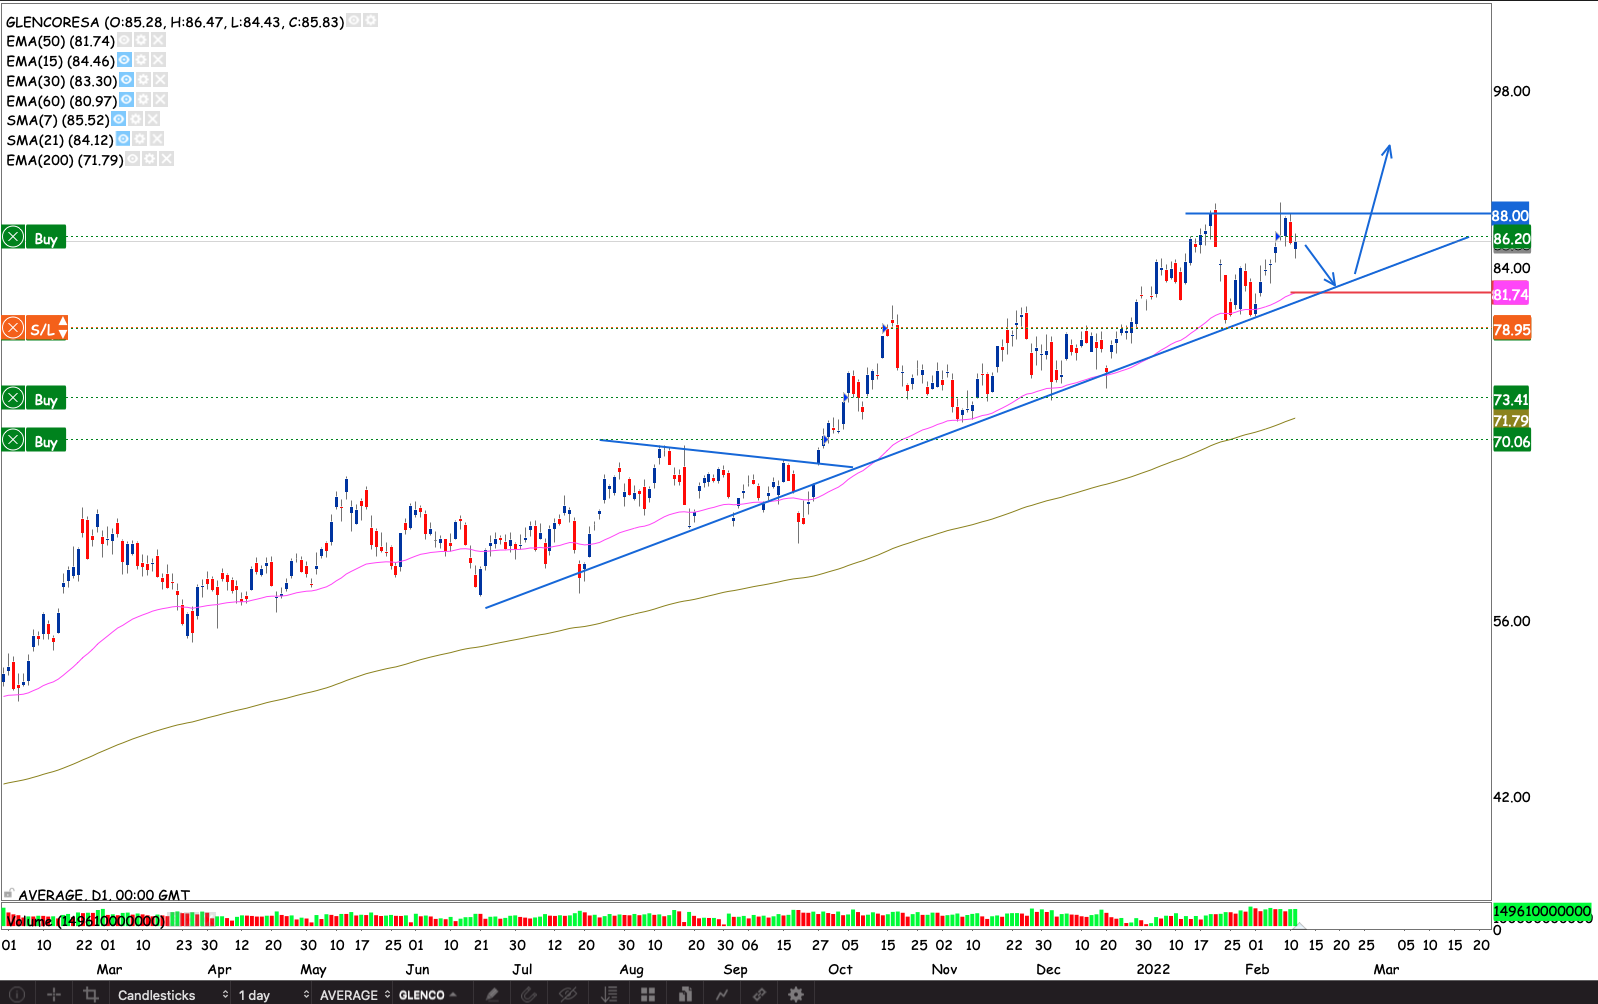
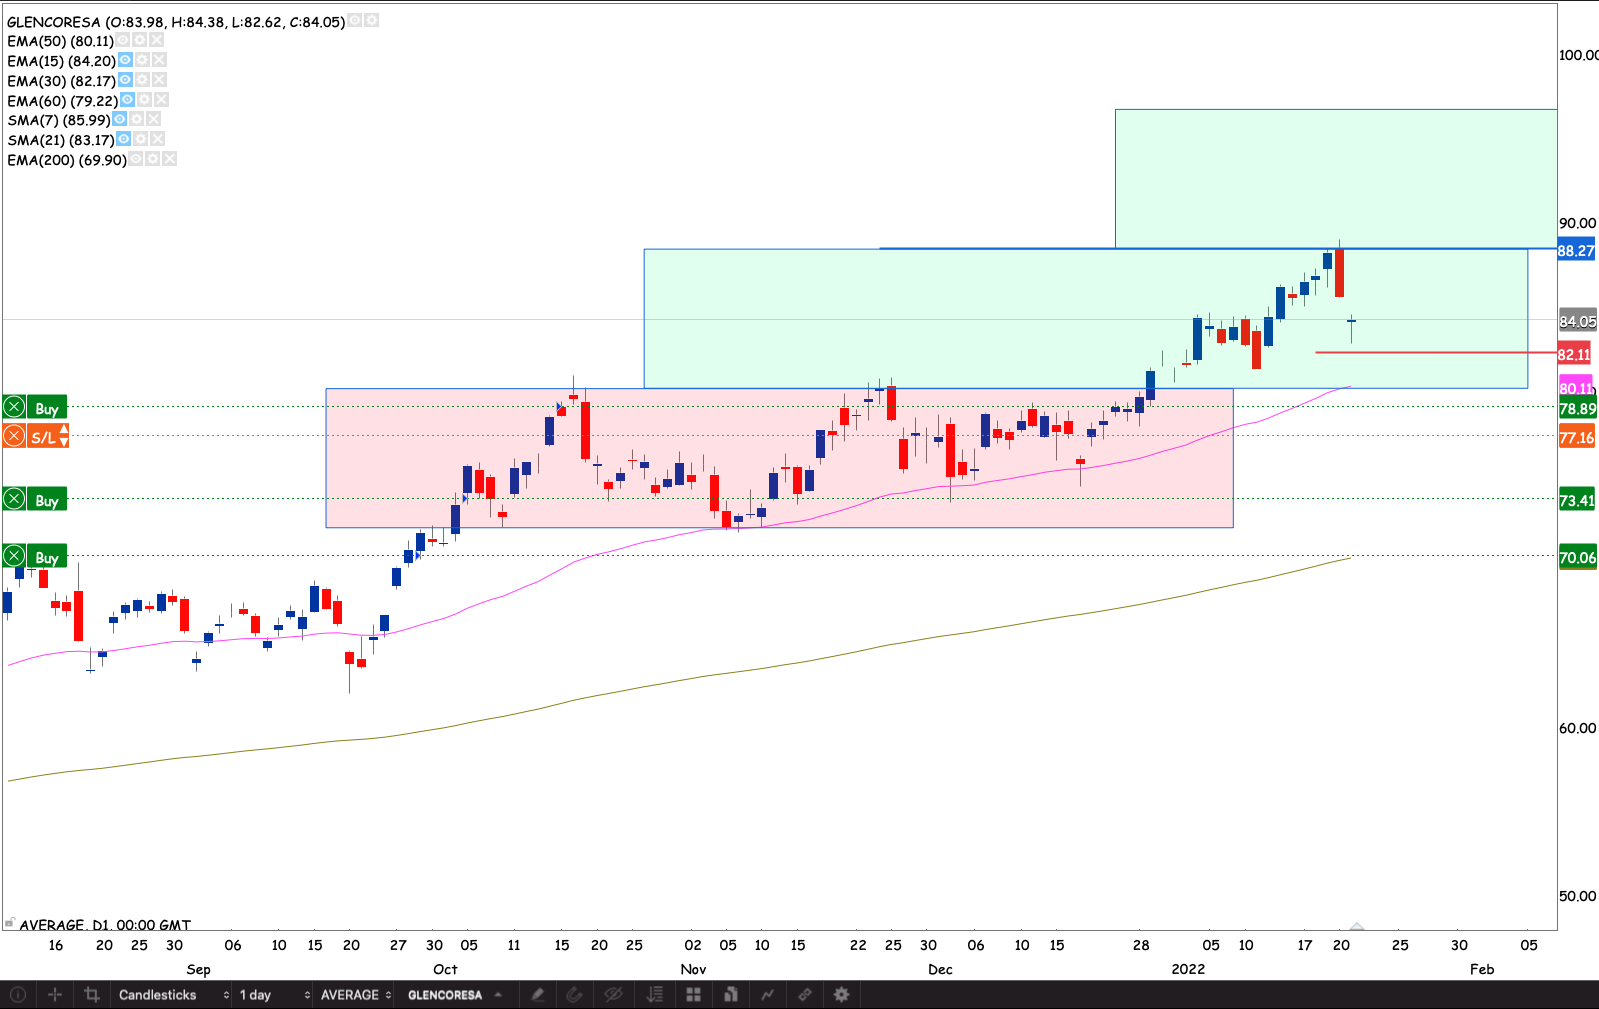
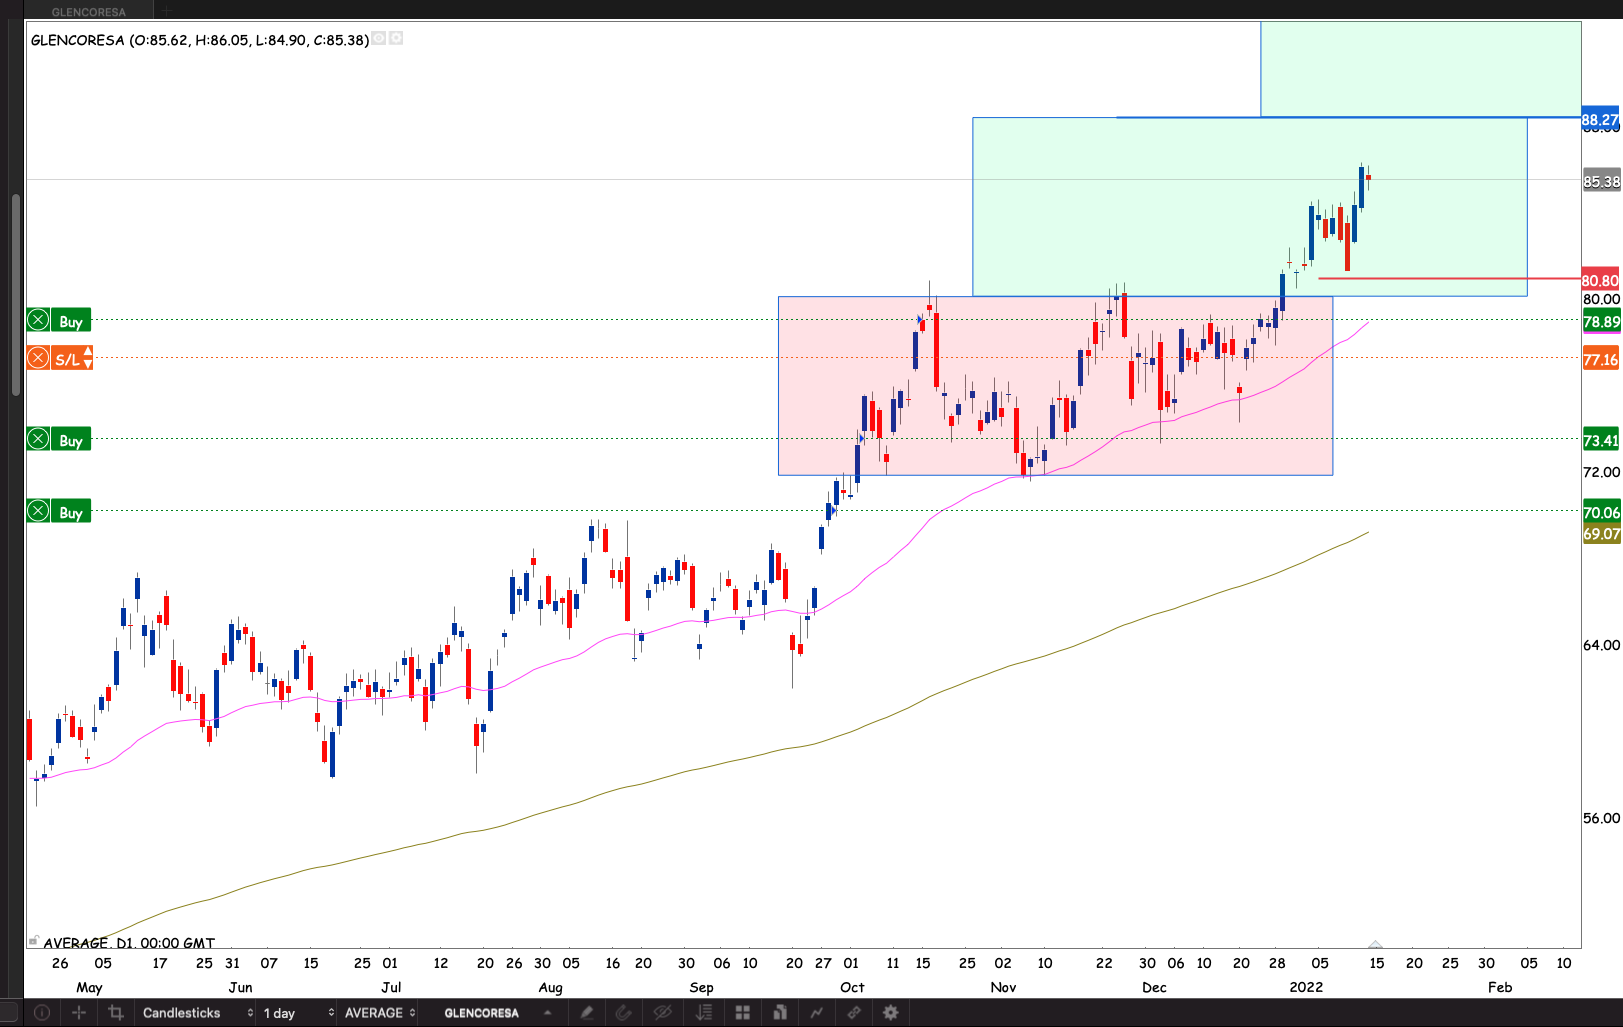
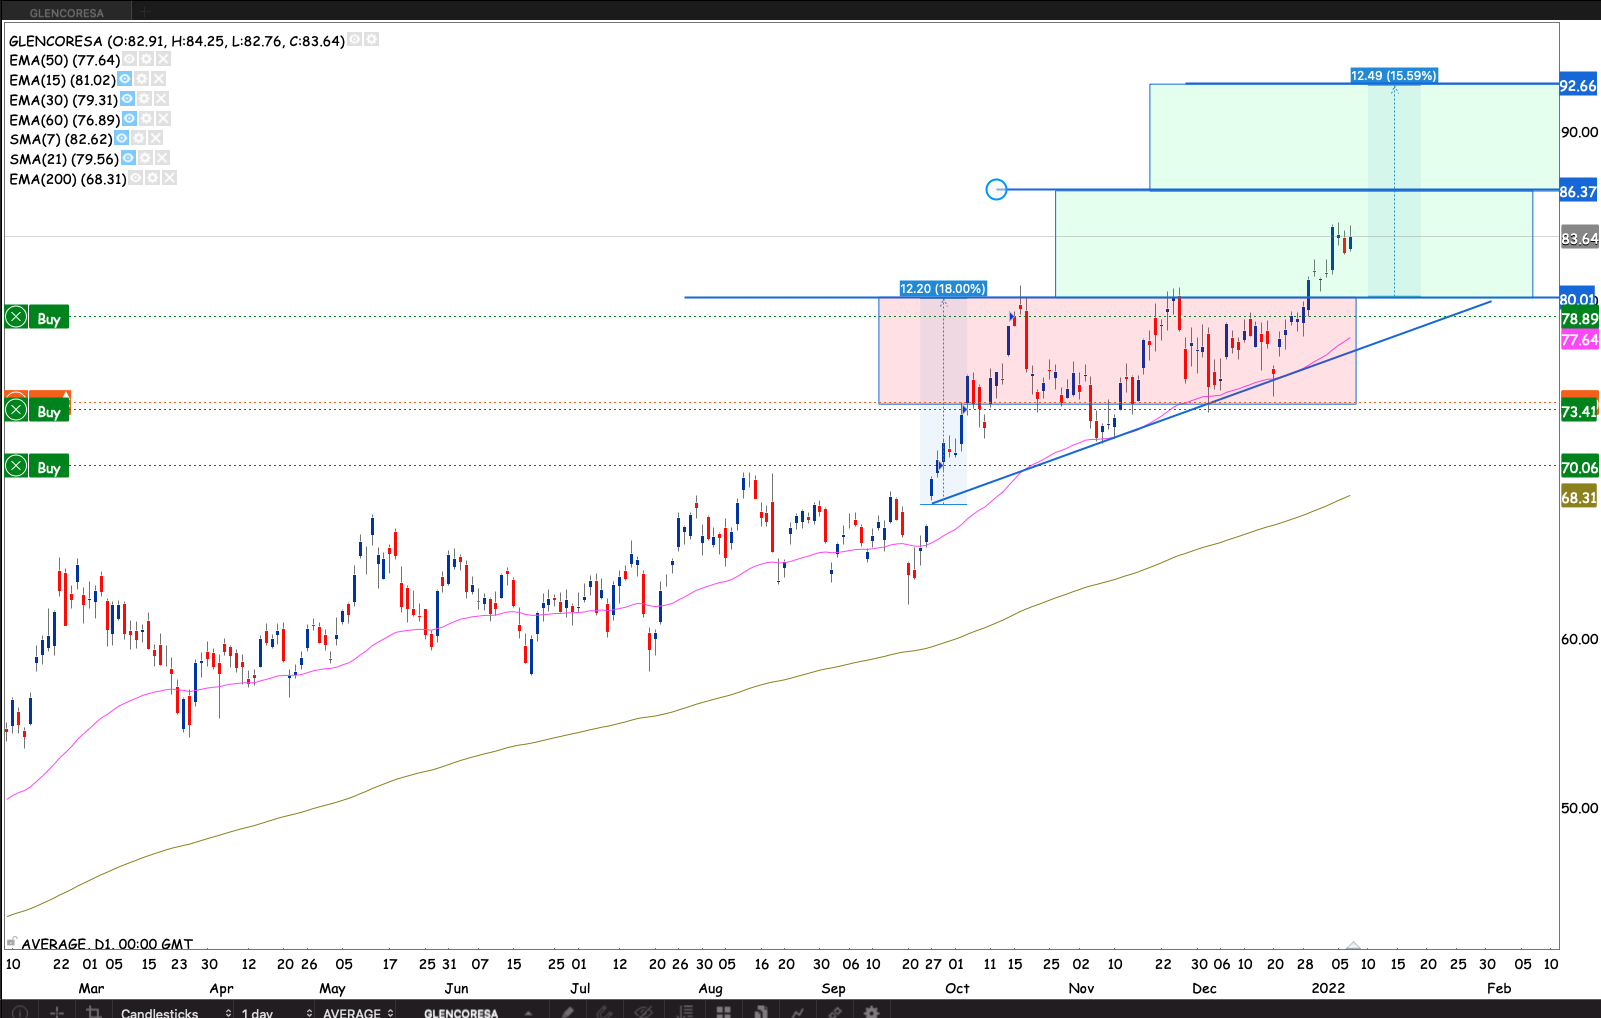
Glencore
Looks like gonna to step on the brakes a little bit on Glencore. Anticipating a pull back to the 50 day EMA. Before breaking R88. With commodities and resources as a group looking bullish. I expect the stock break through R88
Kumba
Iron Ore prices have been rallying strongly. I called the stock bottom last November 2021. When I saw a couple of dojis on the week chart around the 200 week EMA. The stock has been ticking higher. I’m building a position in my smaller portfolio. Because the 50 day EMA is still below the 200 day EMA. If Iron Ore prices continue to rally I think the stock will break through R773 fairly easily.
Exxaro
Resources stocks have been pretty recently. We have a golden cross backed breakout. The stock made a new high close on Friday. Going to hold off raising my stop loss for now. I will monitor the price action for a false break. We’ve seen a bit of those in this stock.
Impala
The stock came out with a disappointing trading update. Expecting a decrease in earnings. The stock held up. When the market gets bad news and it goes up. It shows the strength of the market. With a golden cross behind, there’s some decent wind at the back. Perhaps the rising prices in commodities will be enough to save the stock.
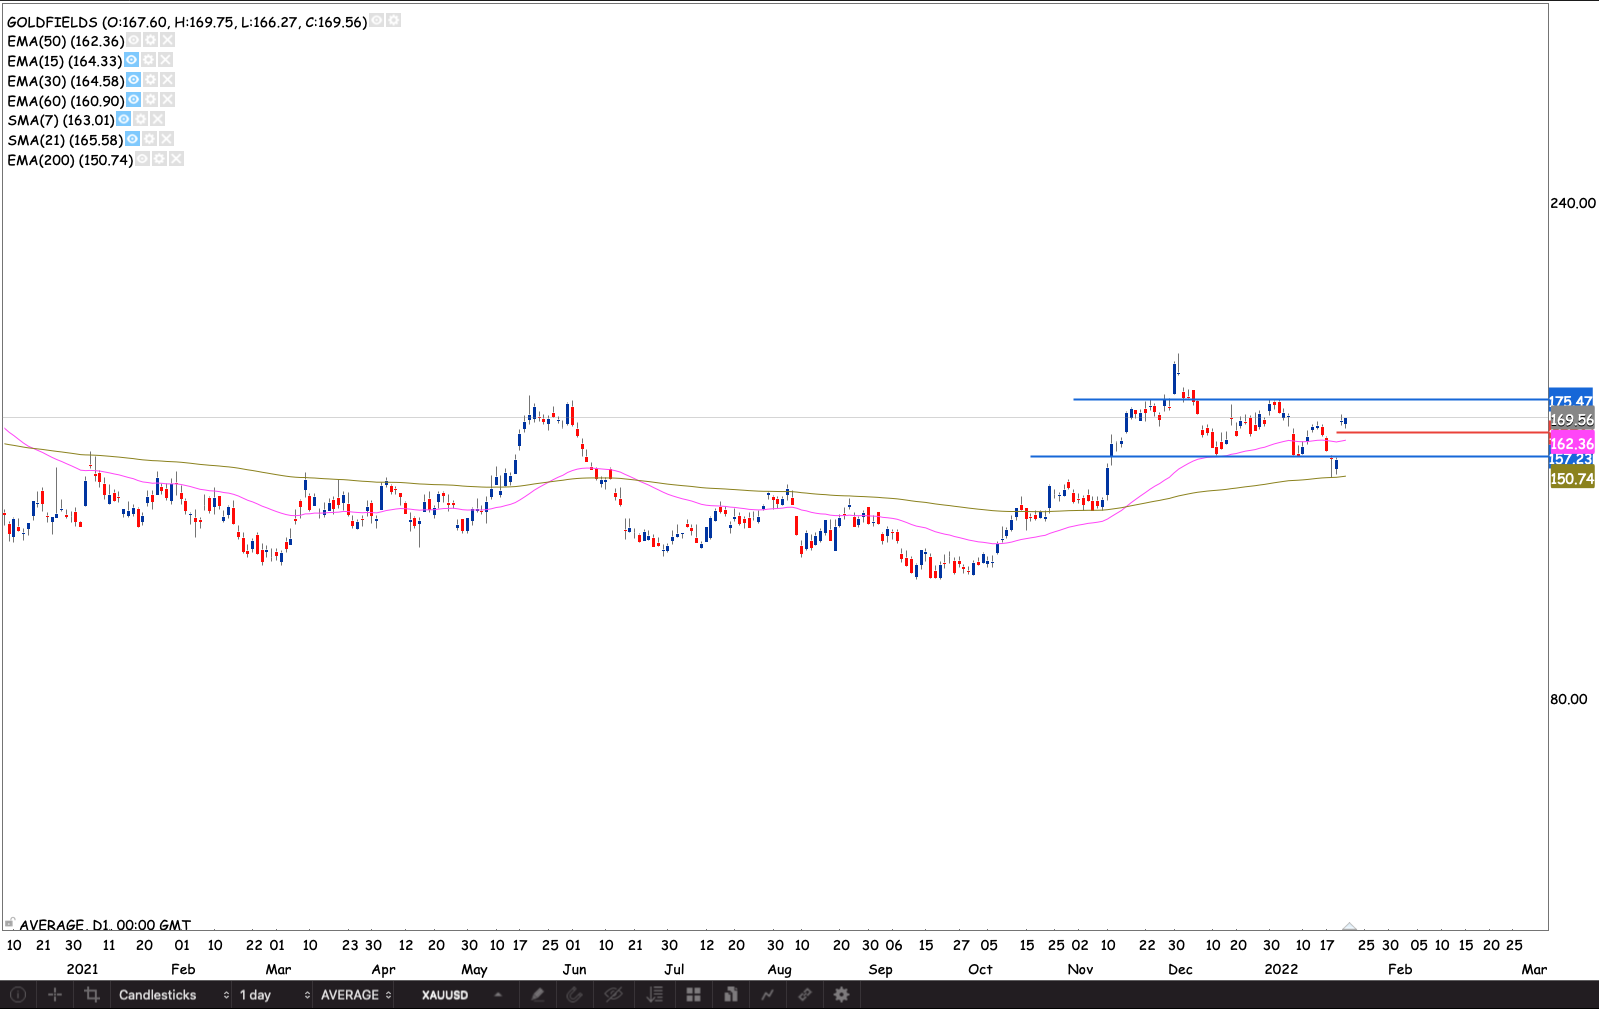
Goldfields
We have a nice ascending triangle pattern with the R175 topline. Backed by a golden cross. In building the pattern it tests both 200 & 50 day EMAs holding them at every try. If the gold breakout holds I think the stock will break the R175. At which point I will build a position.
Bidvest
The stock made a new relative high at the back of a strong earnings update. Shooting through the R208 resistance. I will put on a 1% risk with 4.1 shares & an initial stop loss R196.30 just below Friday’s low
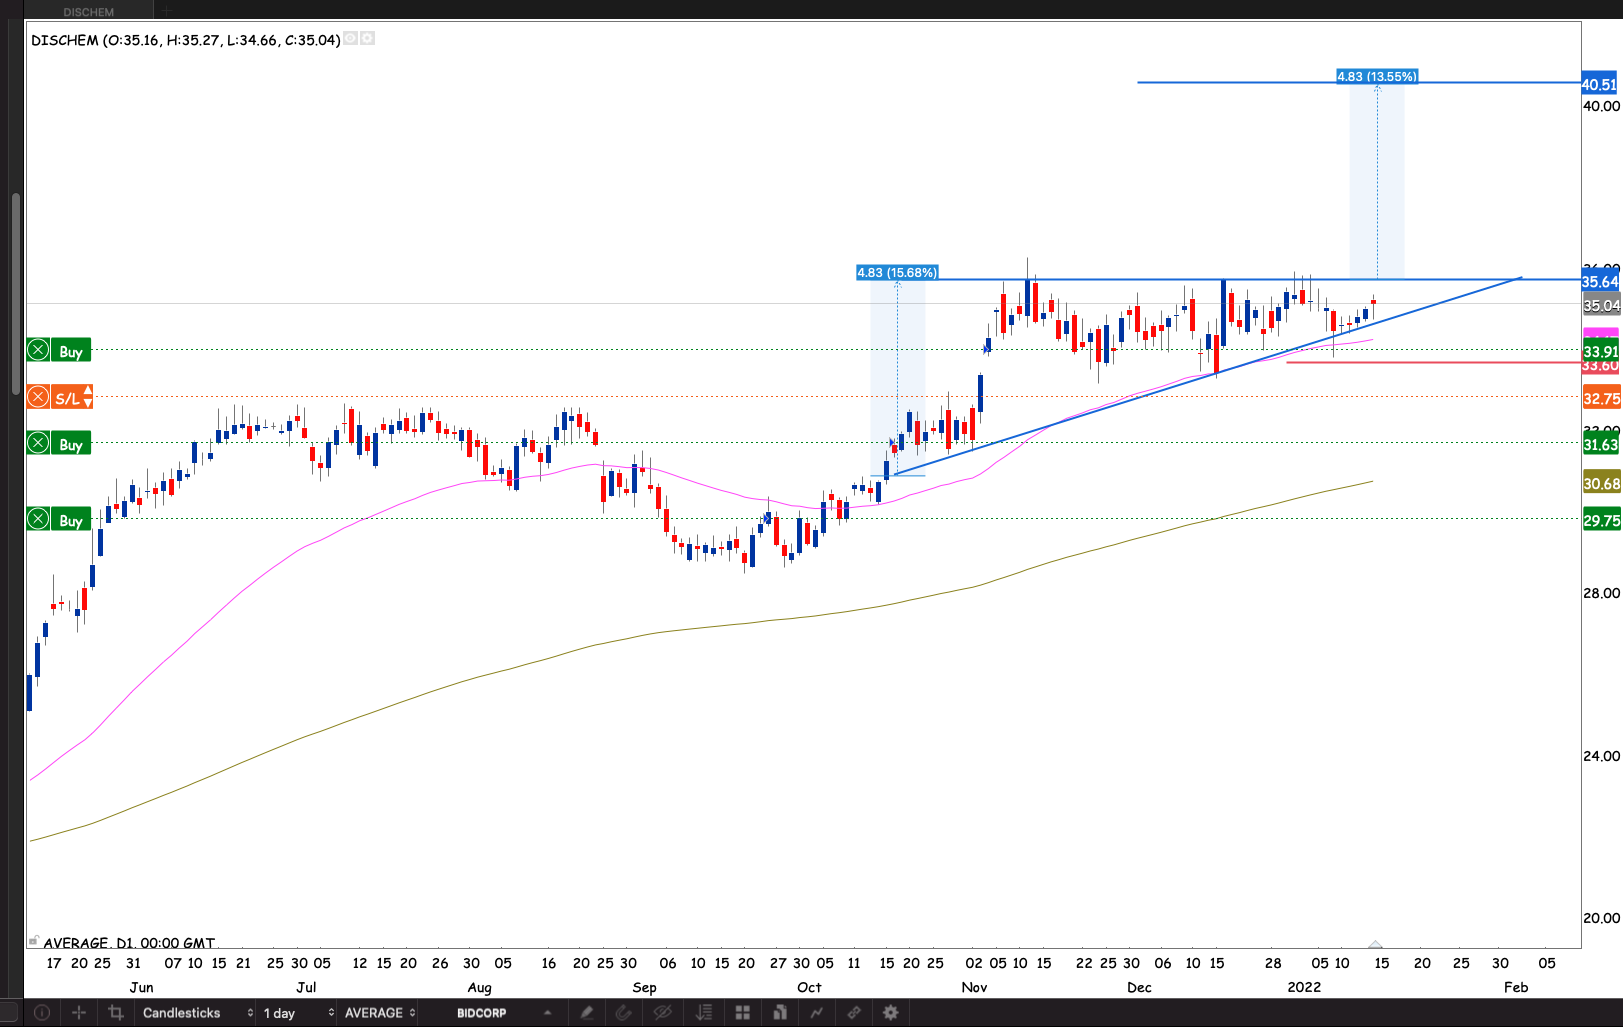
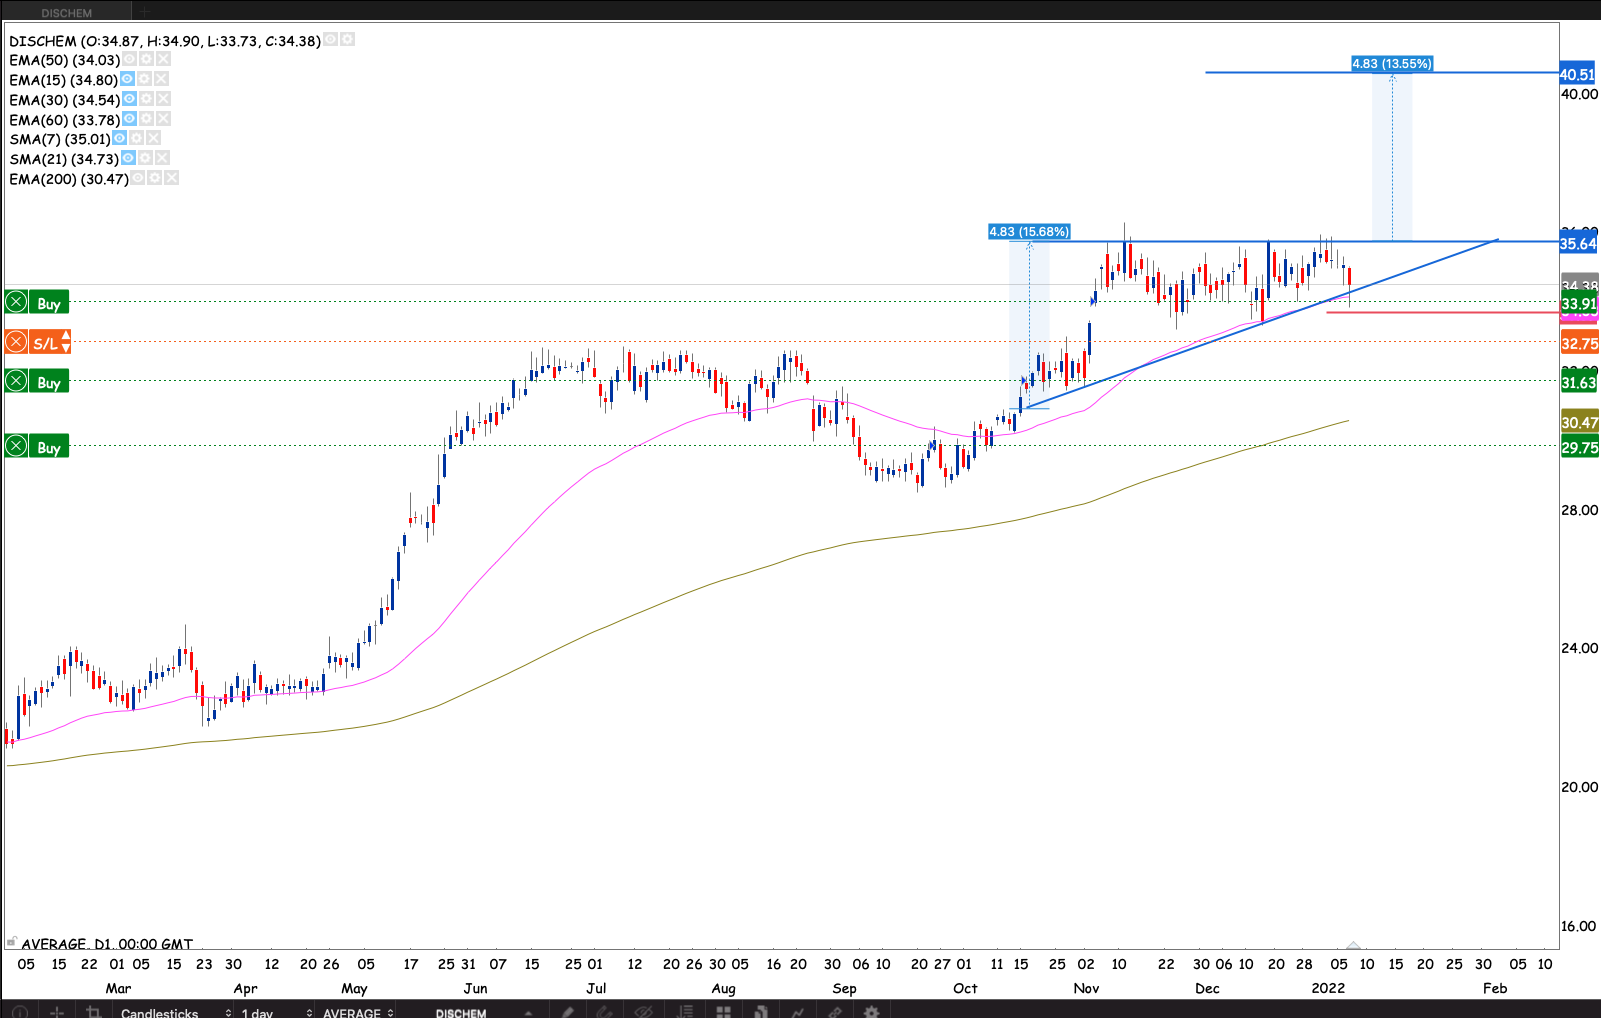
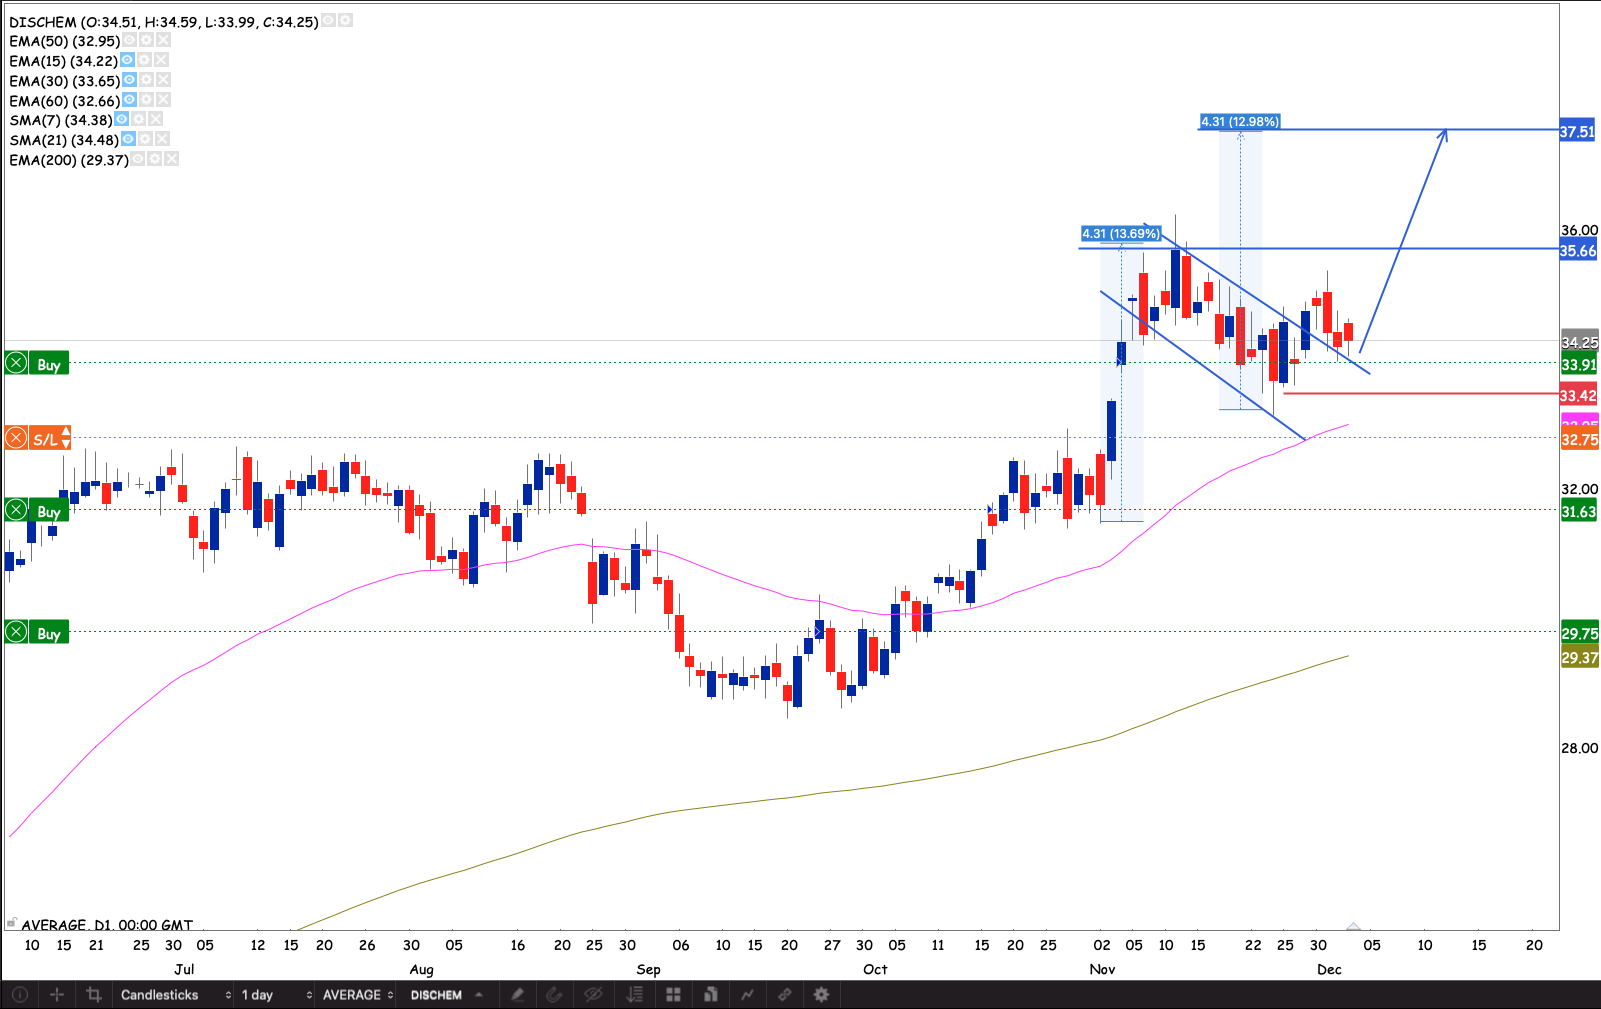
Dischem
I like how Dischem is moving at the moment. There’s an old resistance at R39 which seems to hold so far. We last saw these prices in 2018. If the market can break above R39. I will raise my stop loss to R36.62 and add to the position.
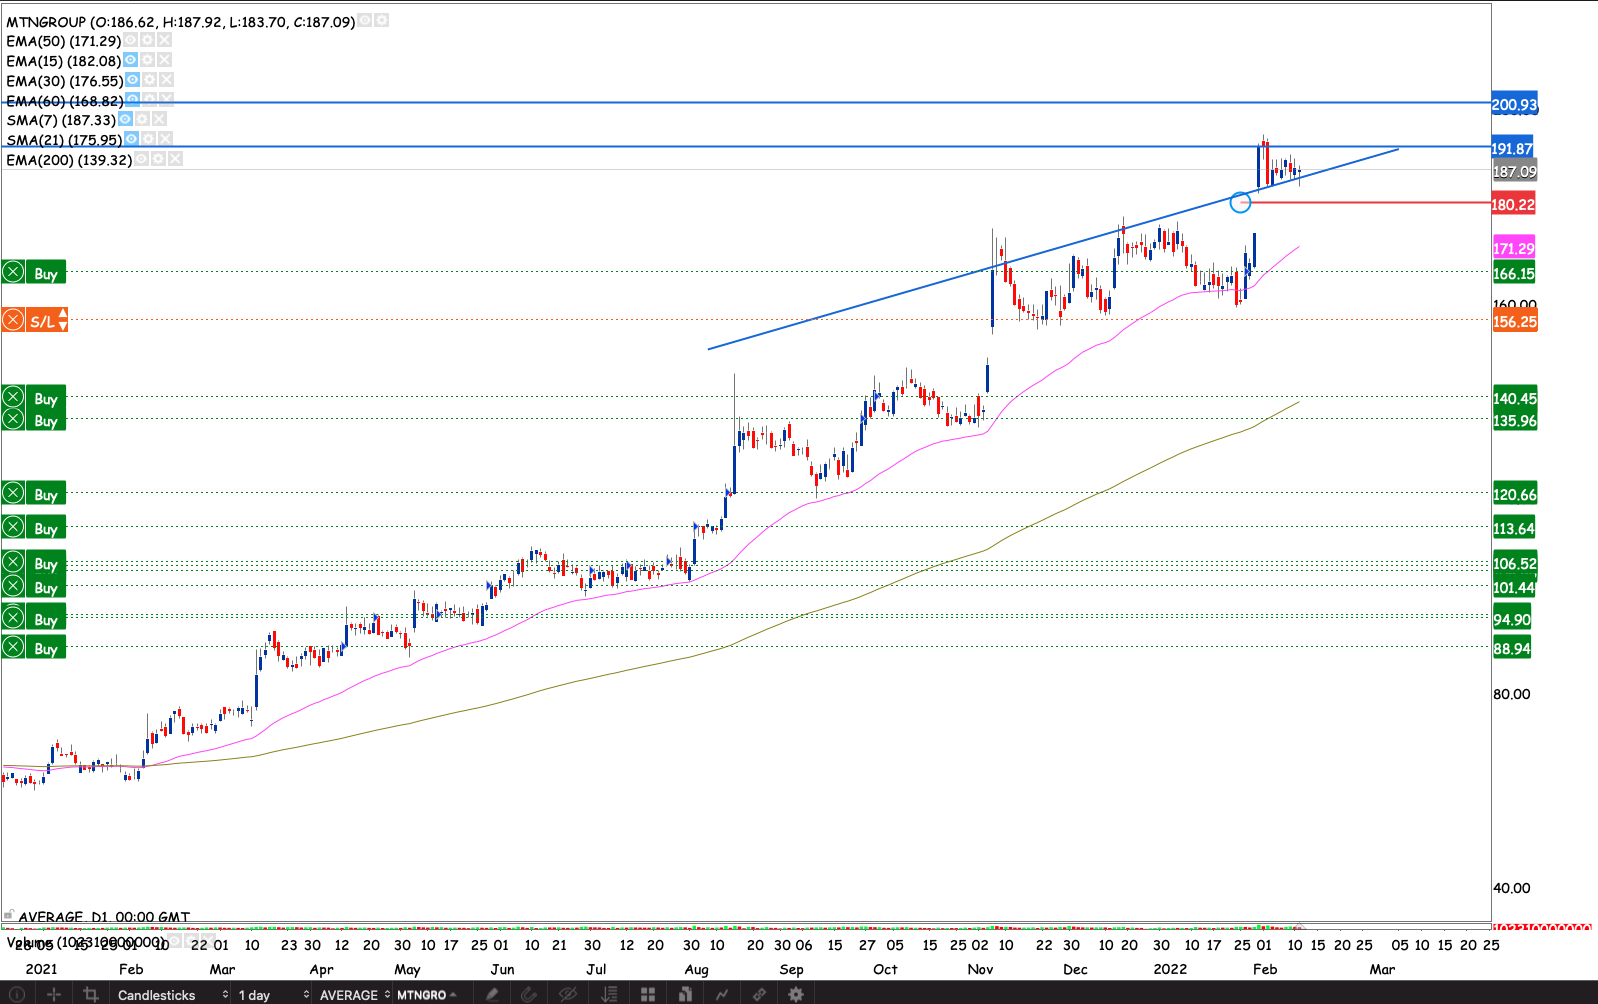
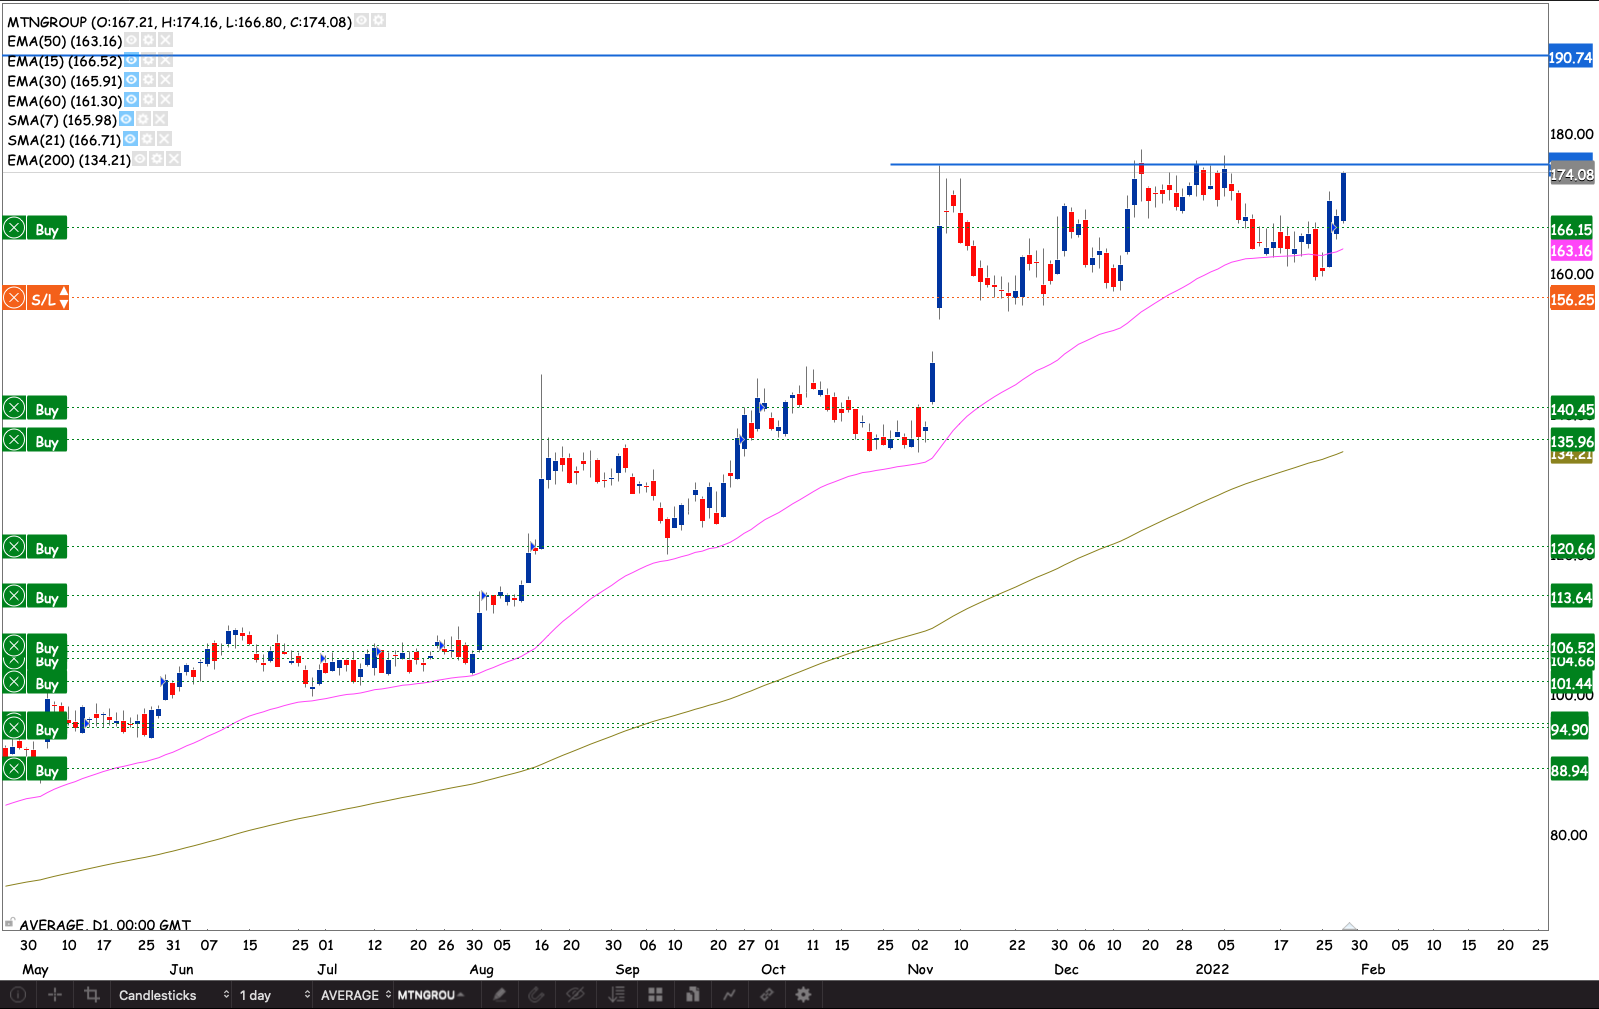
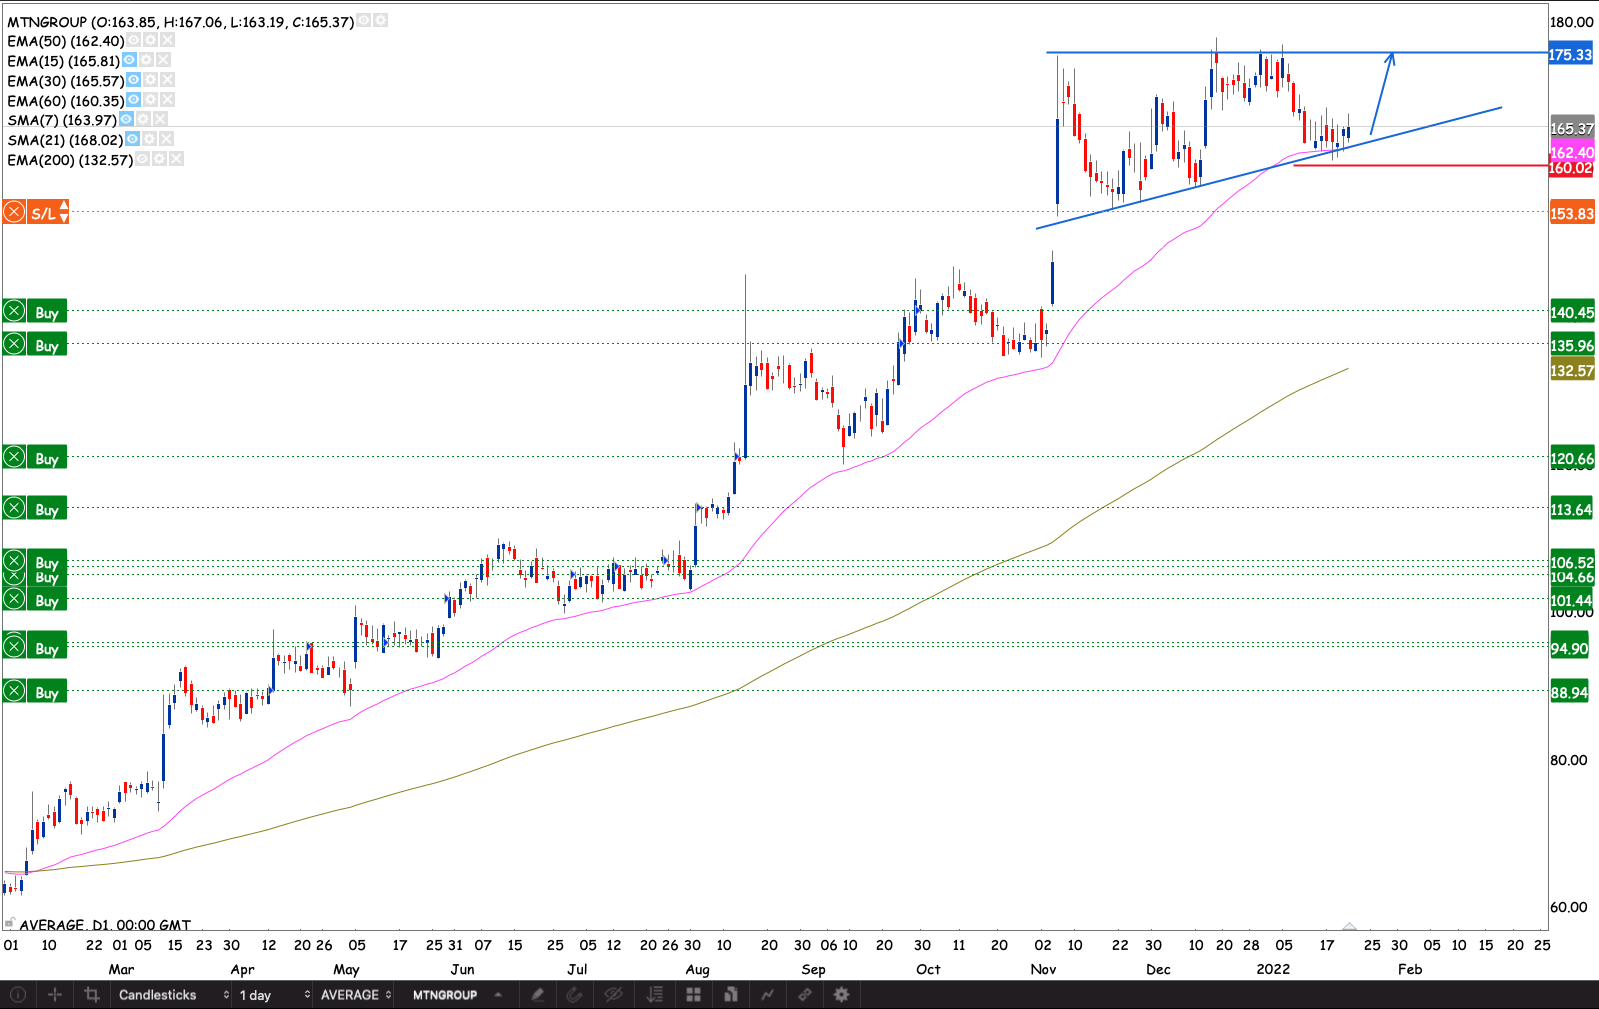
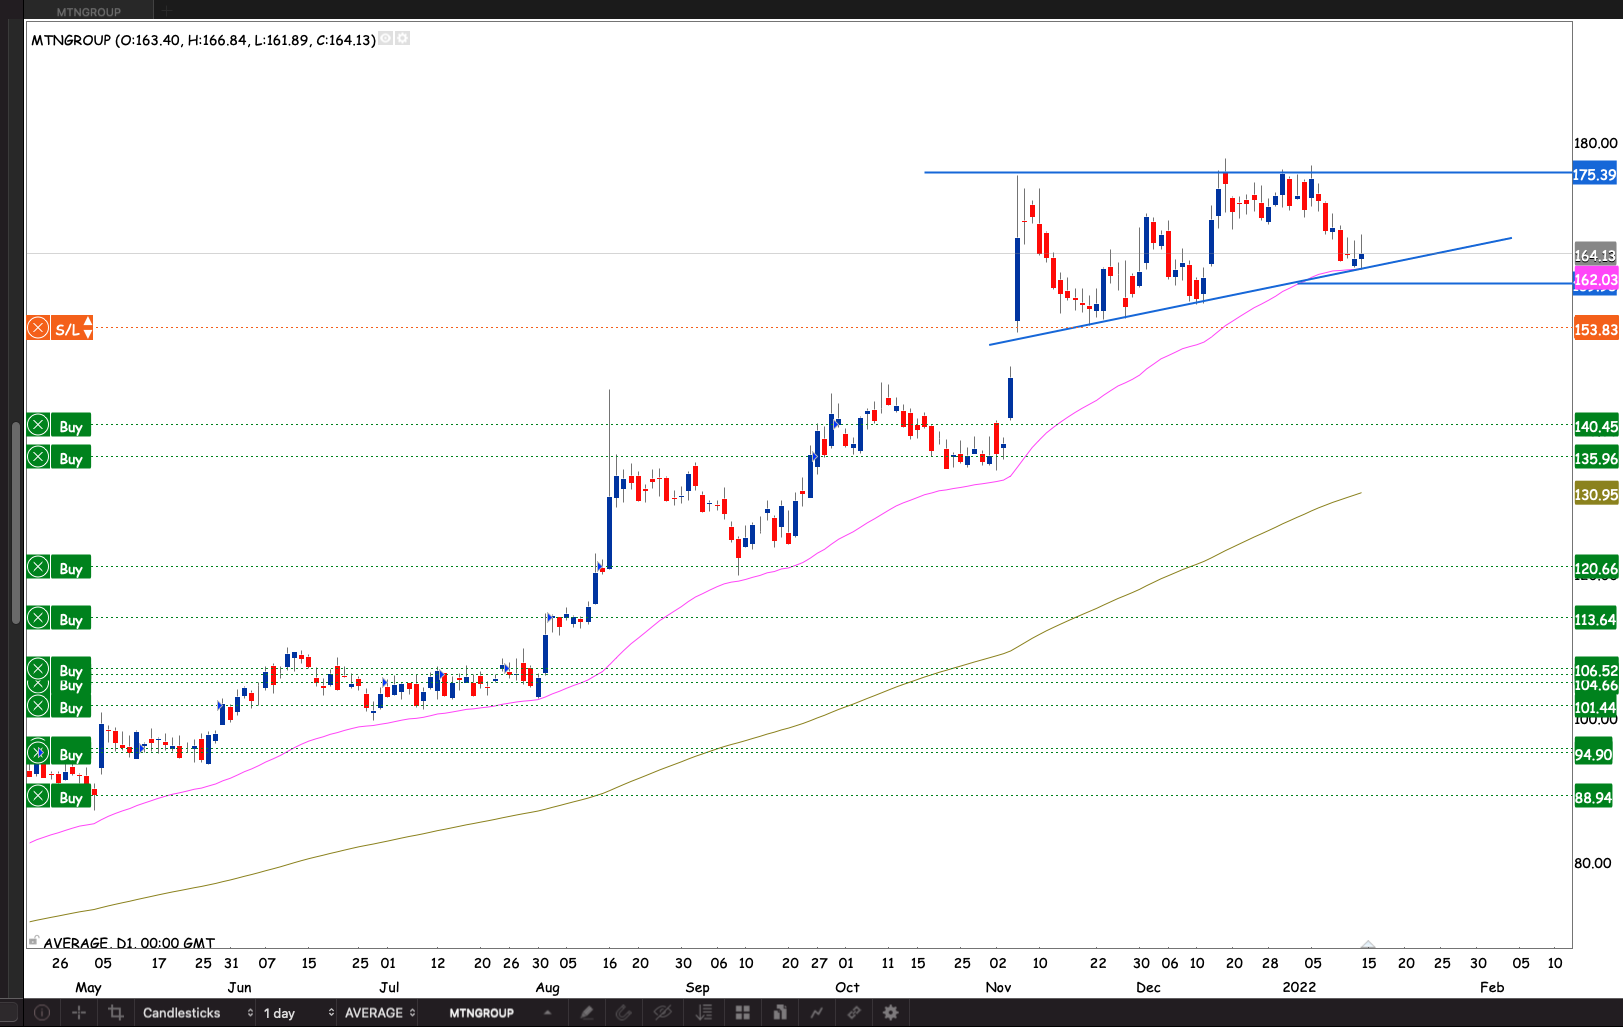
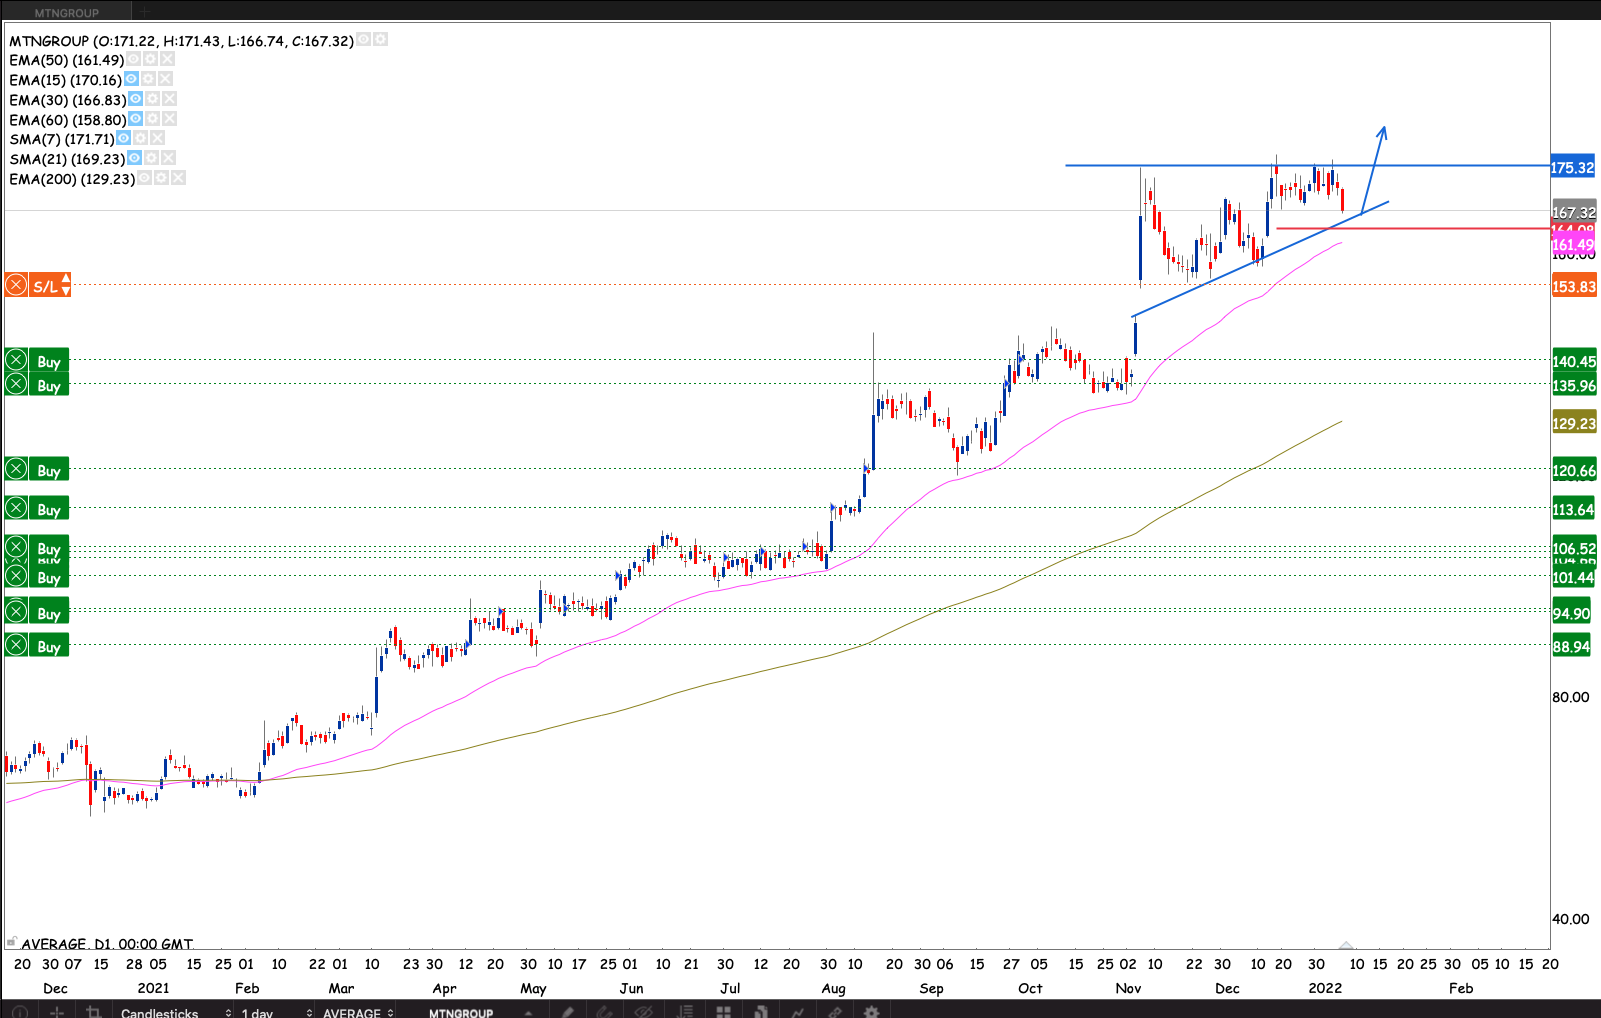
MTN
Since the giant gap at the back of a strong update from MTN nigeria. It has since been holding the trendline with higher lows. Closing Friday doji. I’m looking for a break higher. The market remembered the R191.90 old resistance. There’s another old support at R200. For now I’m waiting for a close through R200 to raise my stop loss and add to the position. However, if R191 continuts to hold and the stock takes an attempt on closing the gap. Perhaps to test the 50 day EMA. I will raise my stop loss and add on the break above R191.90
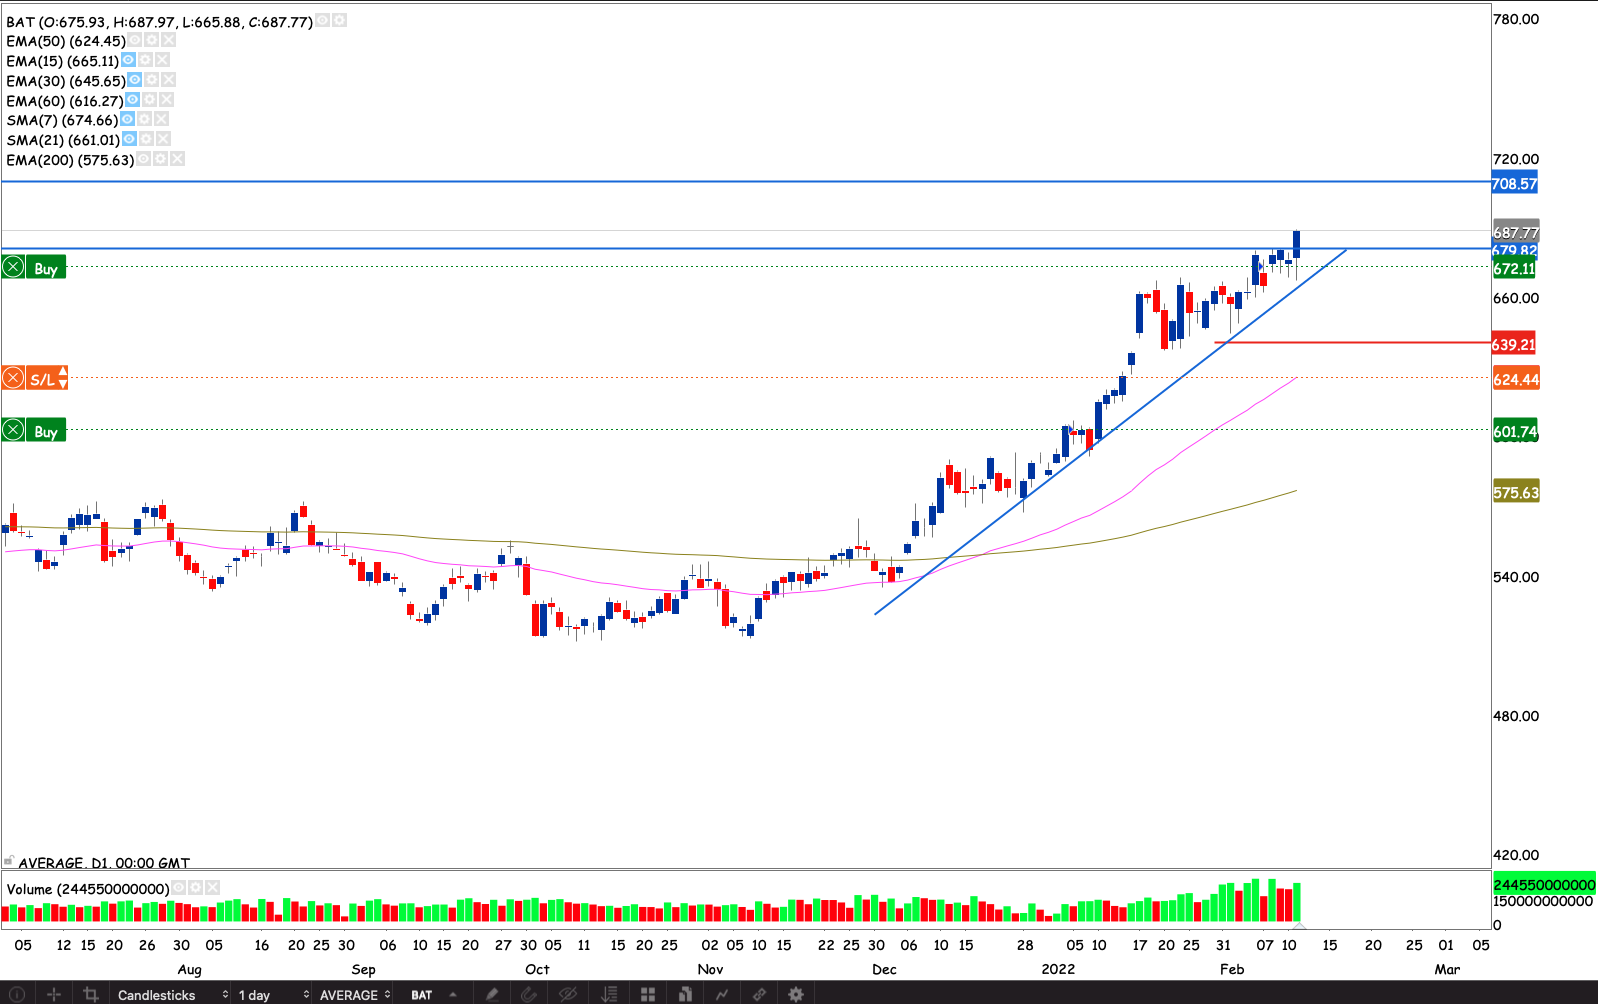
British American Tobacco
The company announced a share buy program of £2 billion. The stock had been deadwood for a while that suddenly sprung to life. The buy back program is the wind at the back. There’s an old resistance at R708. If the market takes out this level. I think we will see the stock hit the R950 highs perhaps higher.
Ab InBev
We had a golden cross, the initial rally didn’t hold. The sold off, but holding the 200 & 50 day EMAs. I’m waiting a close above R966.45 to start building a position on this stock. Offers a decent risk reward opportunity with a R1108 start and a R925 stop loss
Astral Foods
The market liked the trading update last week, EPS expected to be up 100%. The R189 resistance held a bit of a fight. I suspect from state bulls. Close Friday with a bullish engulfing candle that engulfs the entire week. I have a short term target at R220

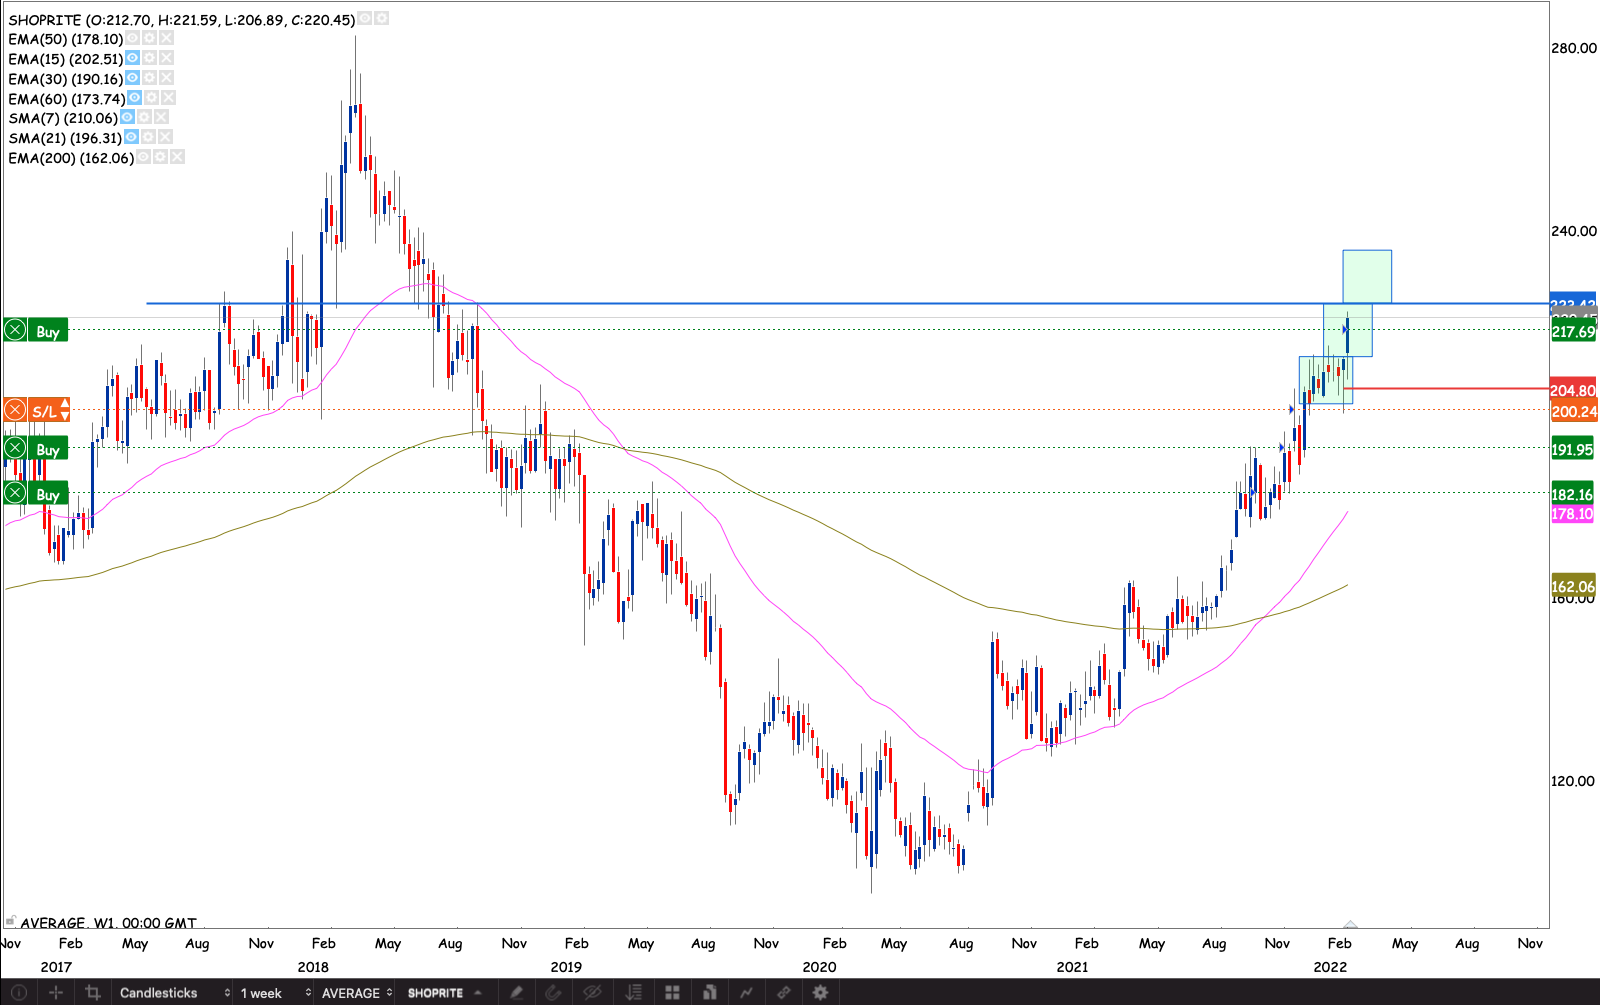
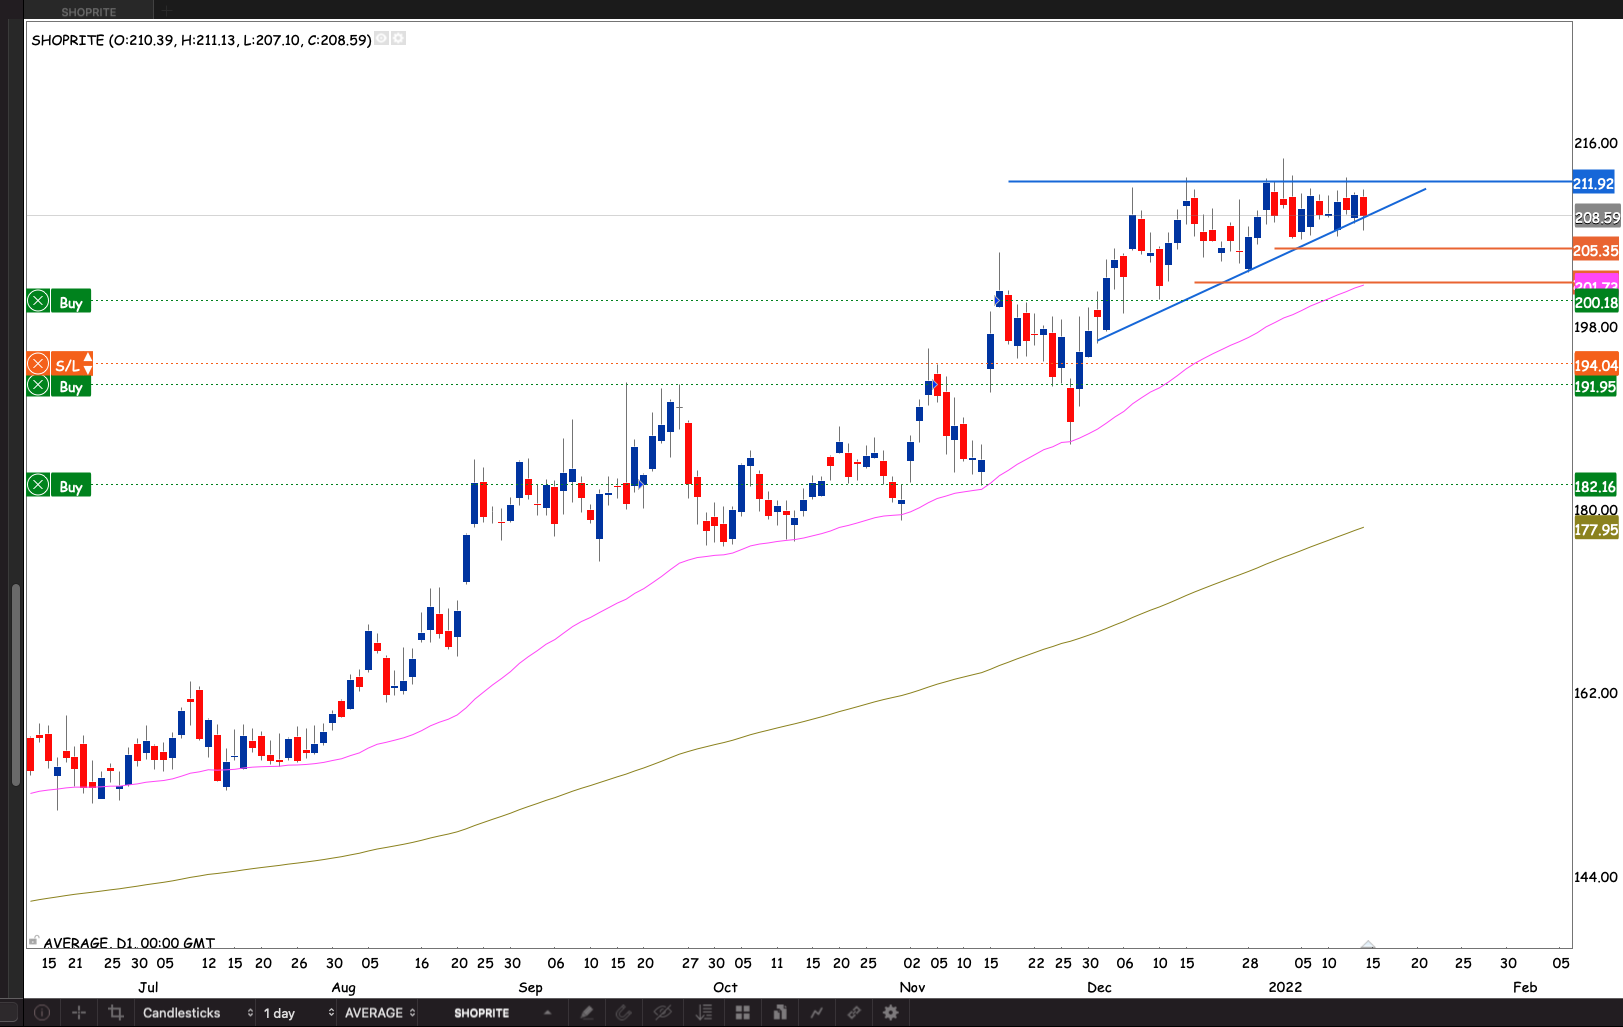
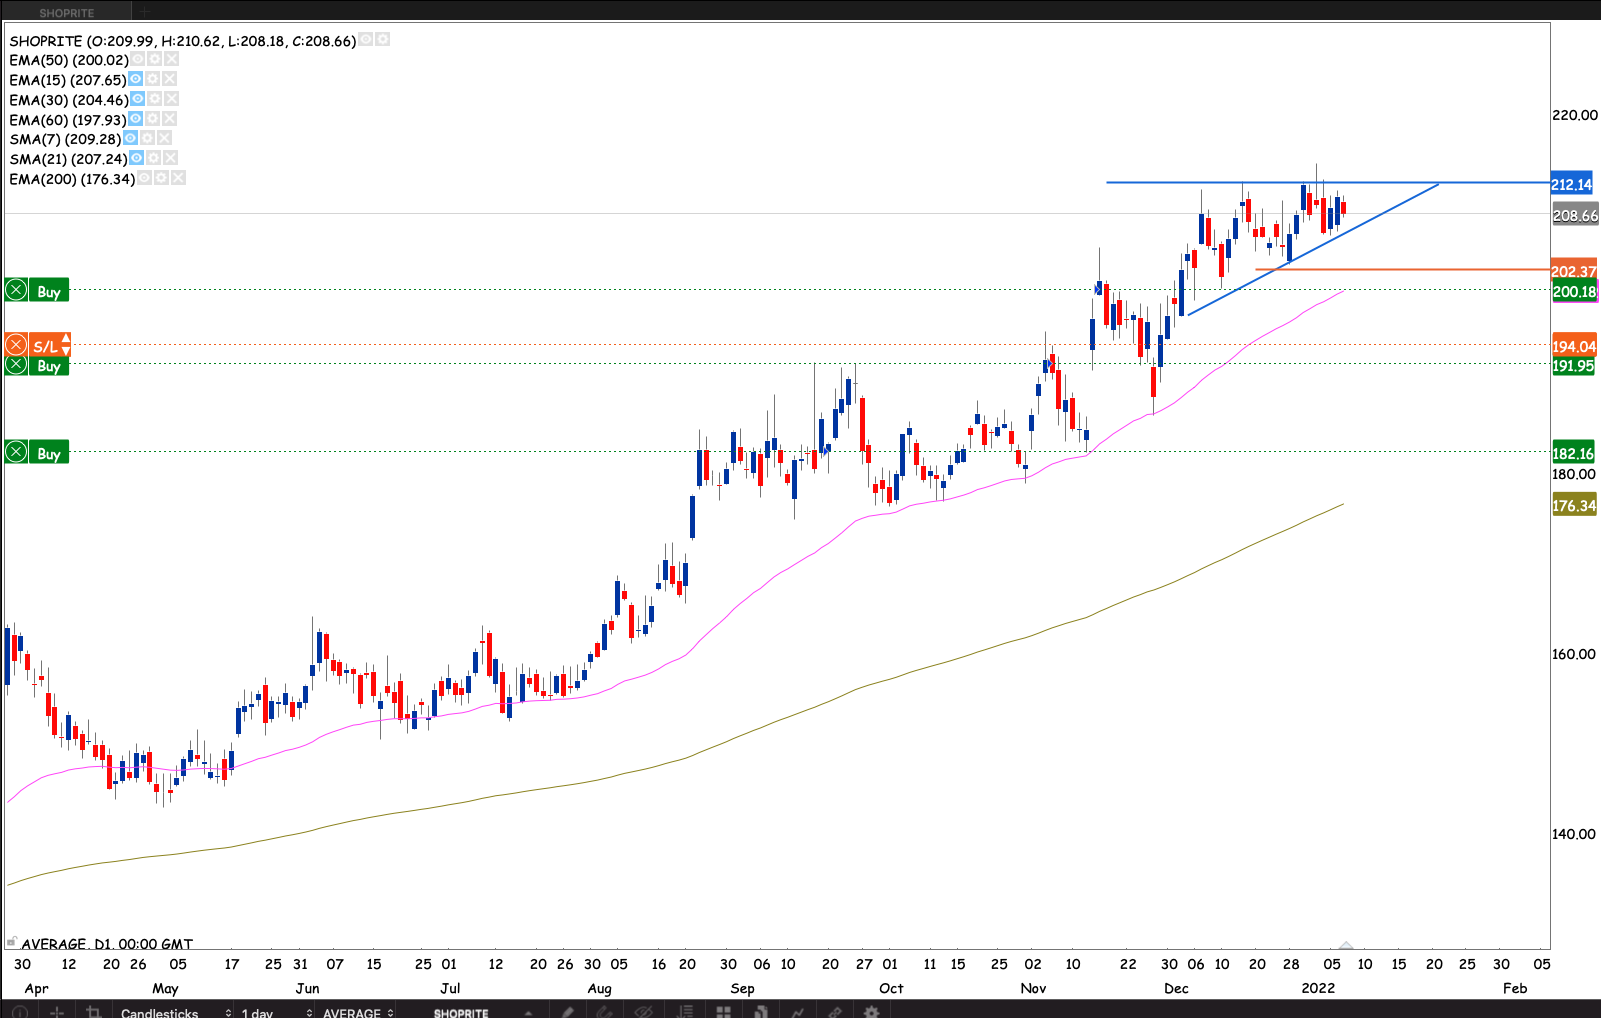
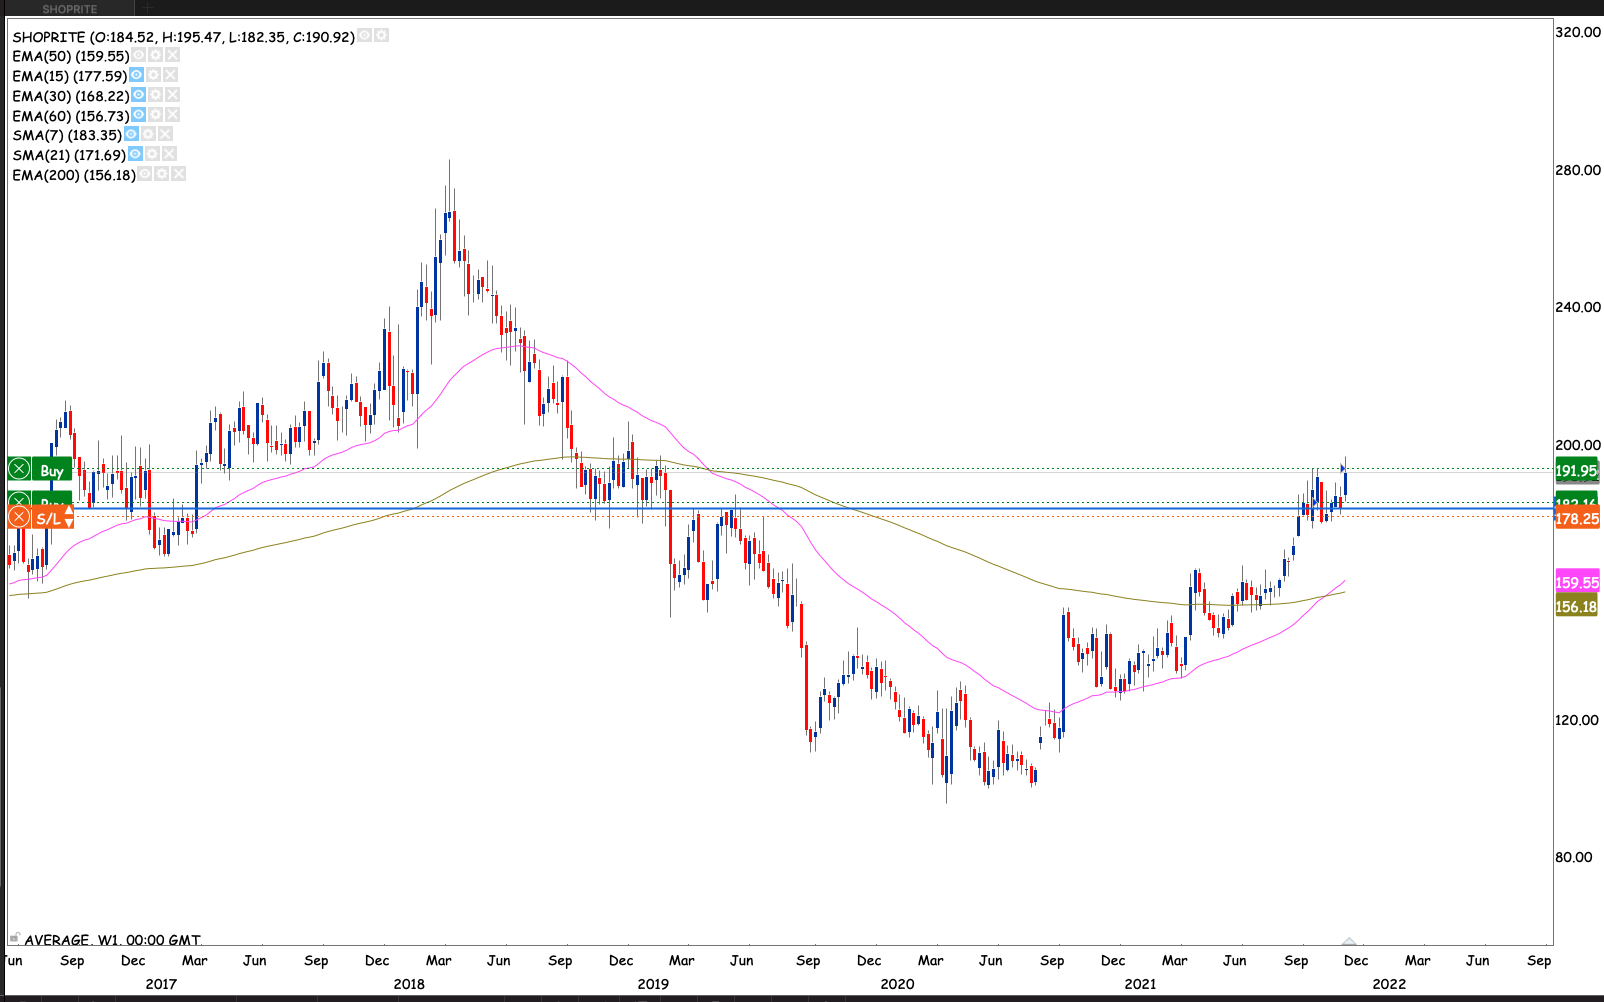
Shoprite
Shoprite has been flirting with the higher box. Dipping to the lower box albeit modestly. It has been a tough hold in the past. I’m giving my stop loss some room. When it establishes itself to the higher box. I will hold off on raising stops

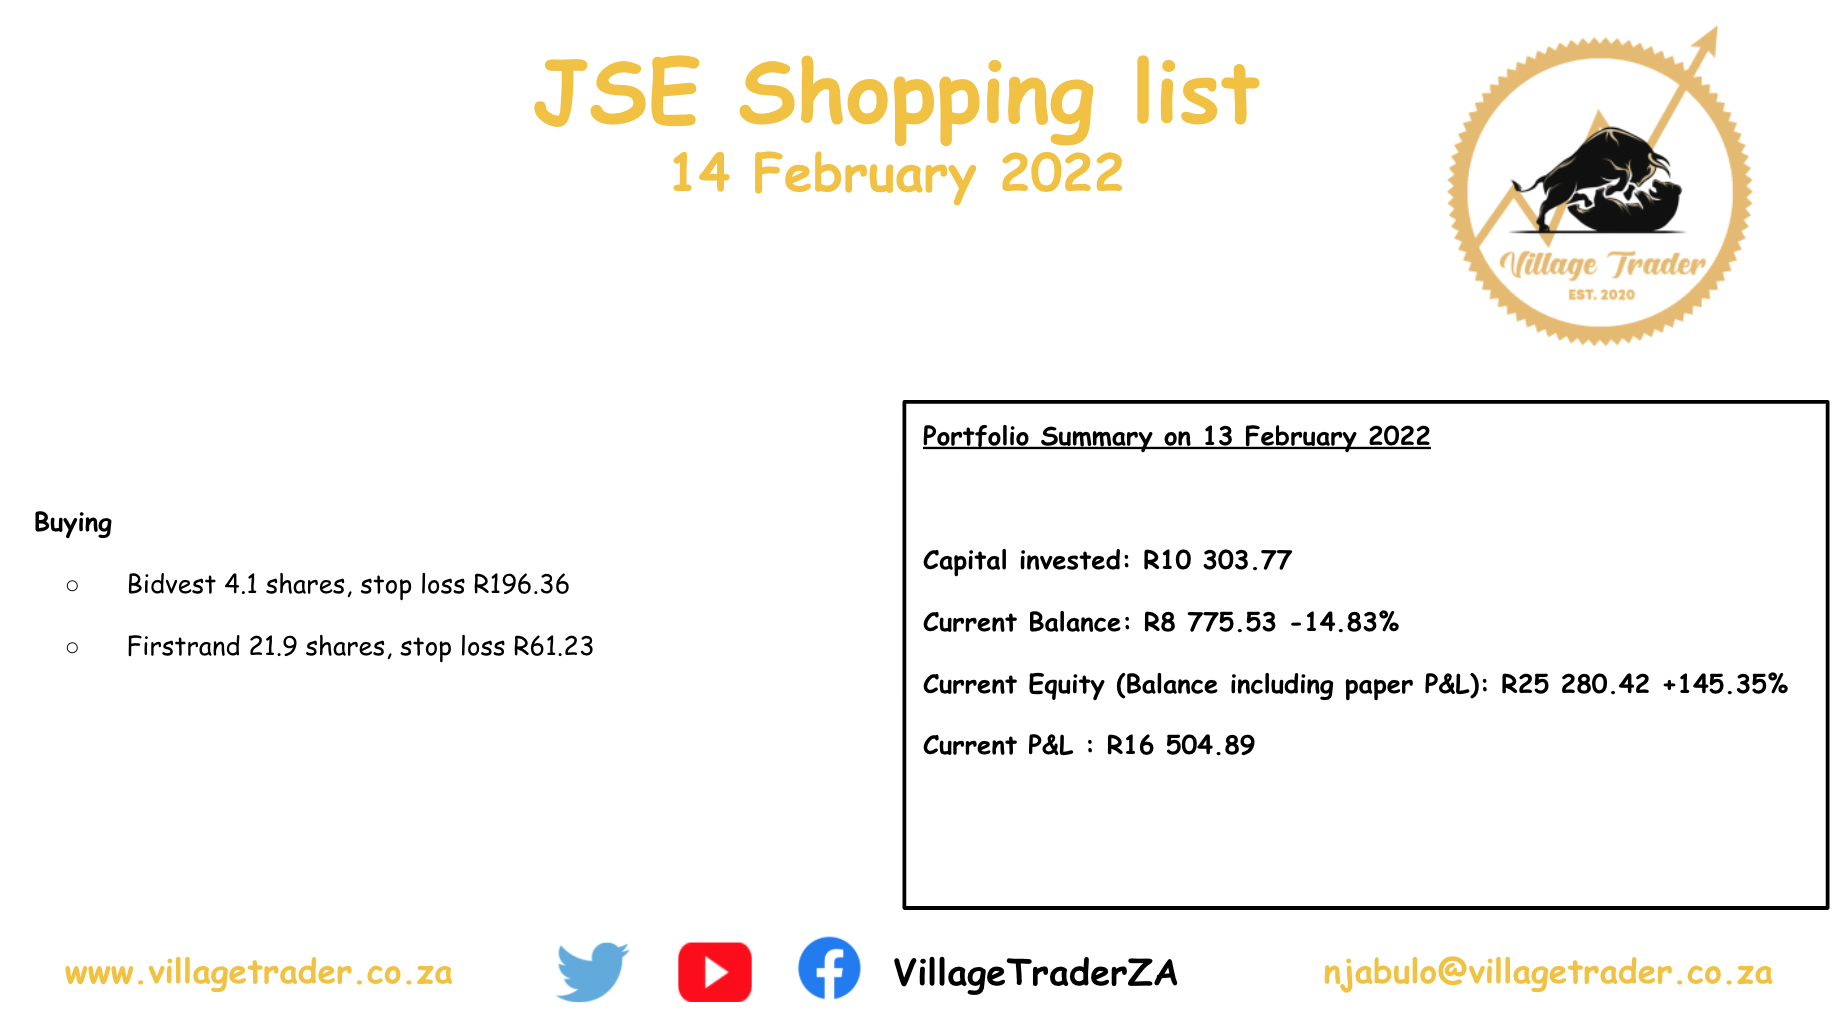
Portfolio Summary on 13 February 2022
Capital invested: R10 303.77
Current Balance: R8 775.53 -14.83%
Current Equity (Balance including paper P&L): R25 280.42 +145.35%
Current P&L : R16 504.89
Equity curve Vs Benchmark (Satrix 40 ETF )
Closed trades statistics and distribution
Open trades statistics and distribution assuming all stops are hit
Thank you for reaching far. For any questions feel free to email me at njabulo@villagetrader.co.za
]]>Banks and Financials
Absa
Banks continued to look positive. Absa saw a bit of a bull back. I’m expecting the market to break through R173 to enter the higher box. Then I will raise my stop loss to R186, and add to the position. If I wasn’t in already I was going to monitor and enter at the break of R170
Discovery
The stock hasn’t looked back since breaking from the symmetrical triangle pattern. The stock made new 52 week highs breaking right through R155. A price we last December 2020. I added to my position in the past week. Now I’m waiting for a close through R166 to add to the position

Investec
I have a fairly substantial position is the stock weighting 16% of my portfolio. My risk on the trade is a +22.64% profit. The stock is breezing through the higher box. I raised my stop R81.93 just below the 50 day EMA. I will be monitoring the price action in the box, for higher stops and opportunities to add to the position. But if it runs R99.50 without stopping, I will add to the position.

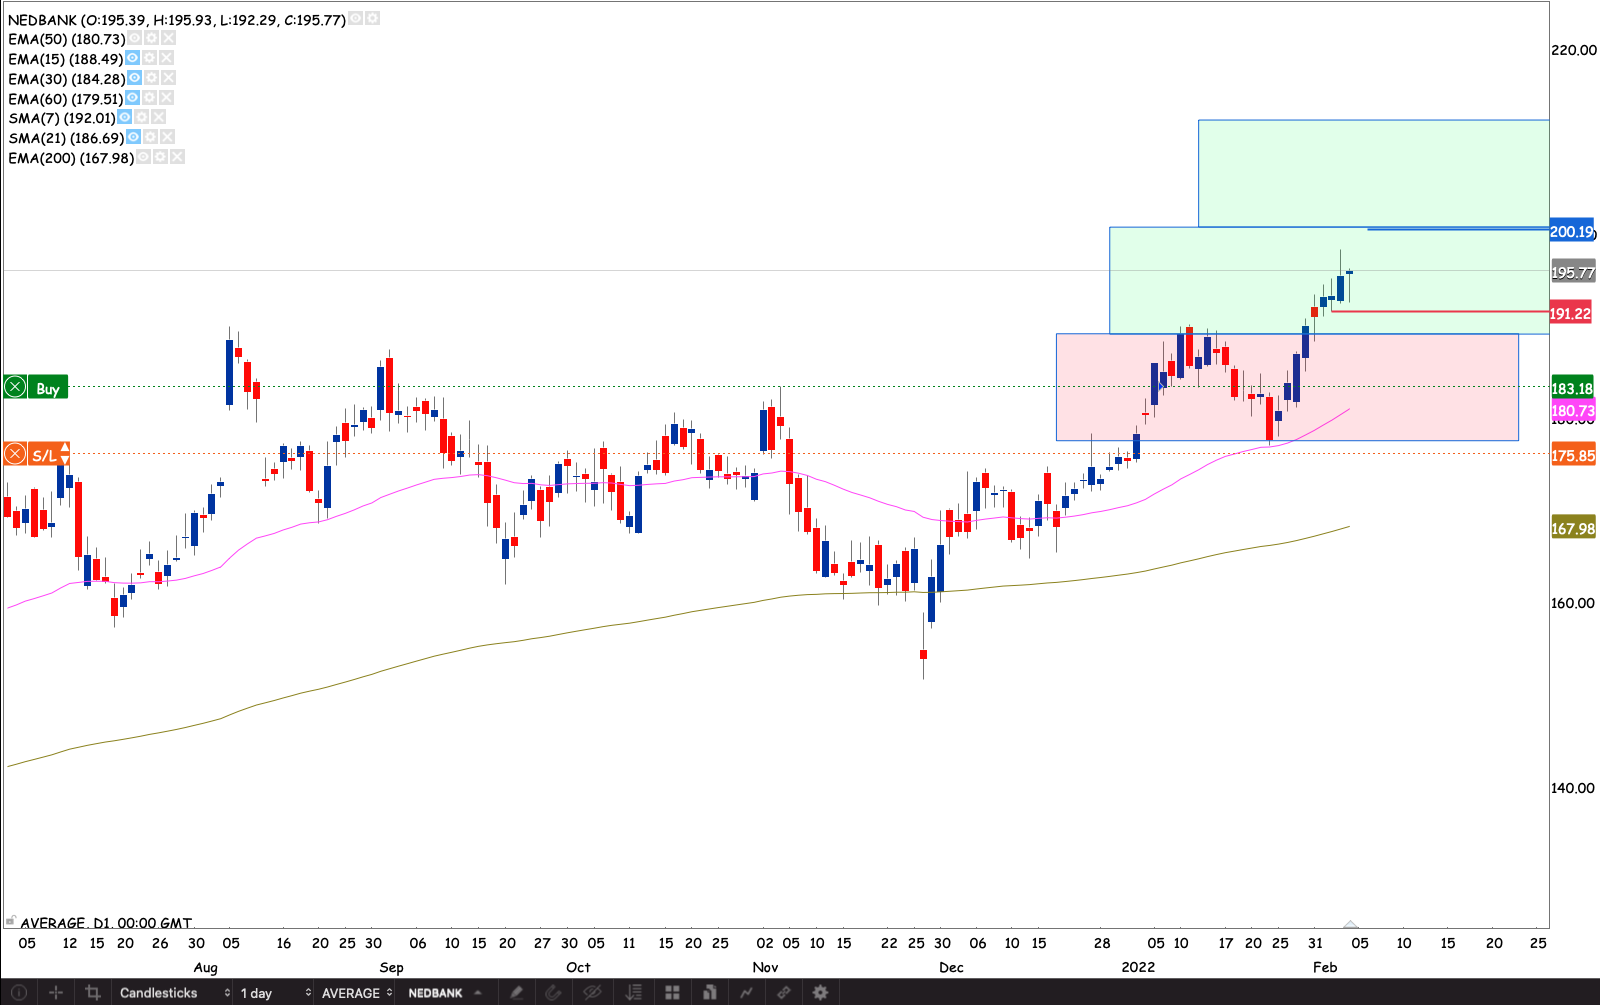
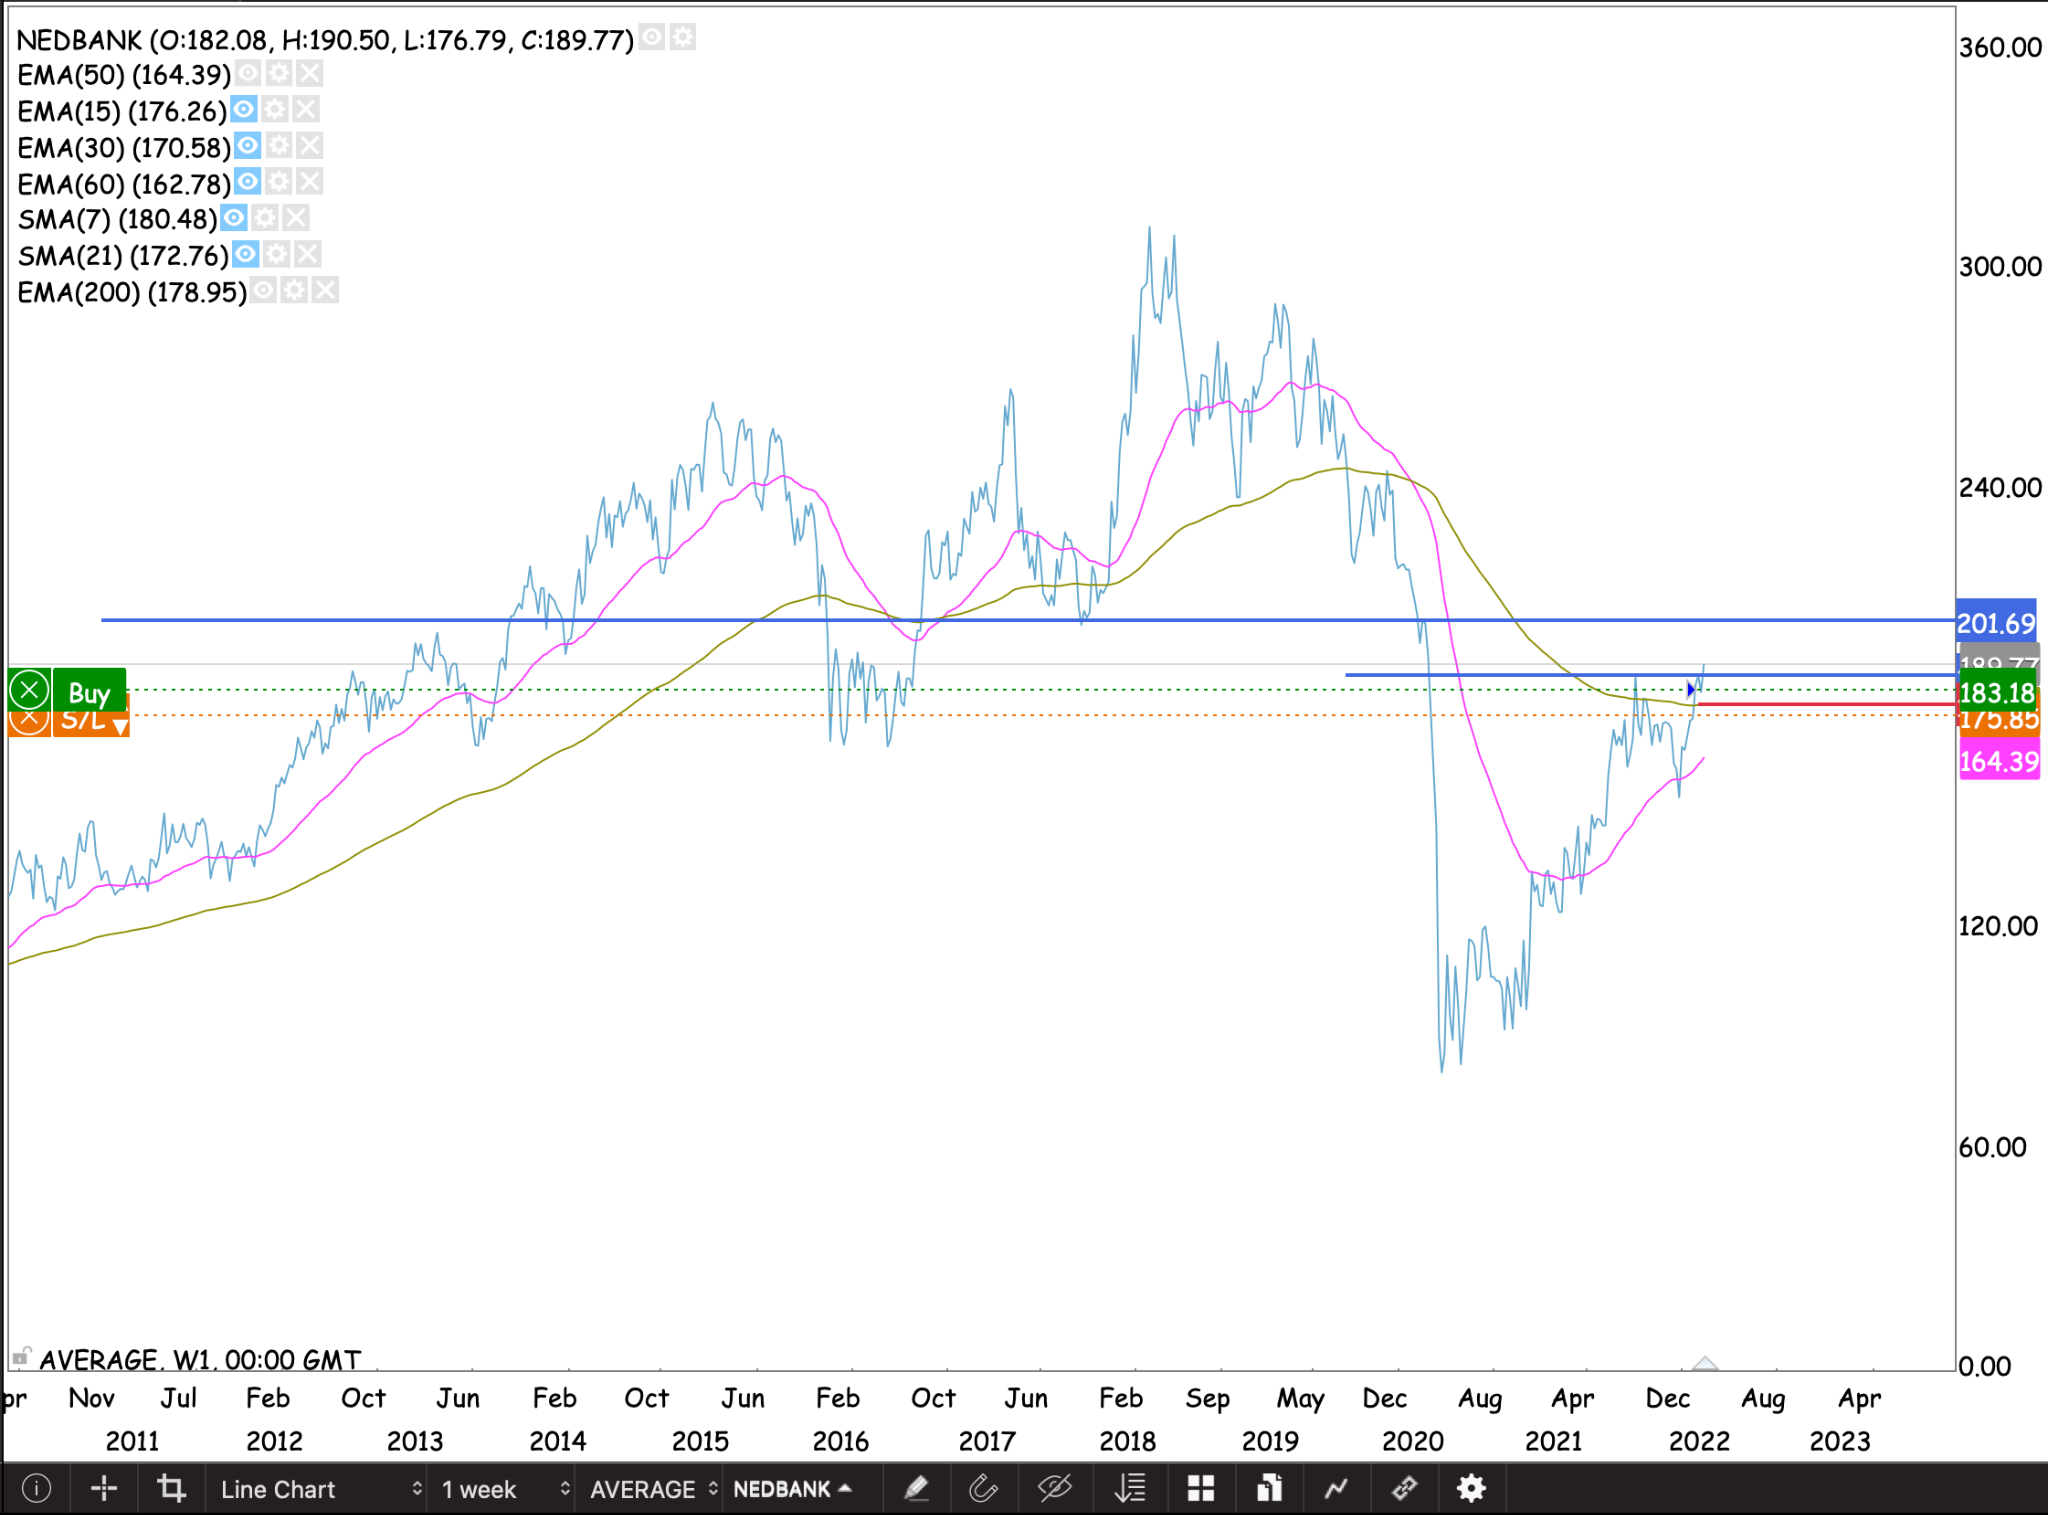
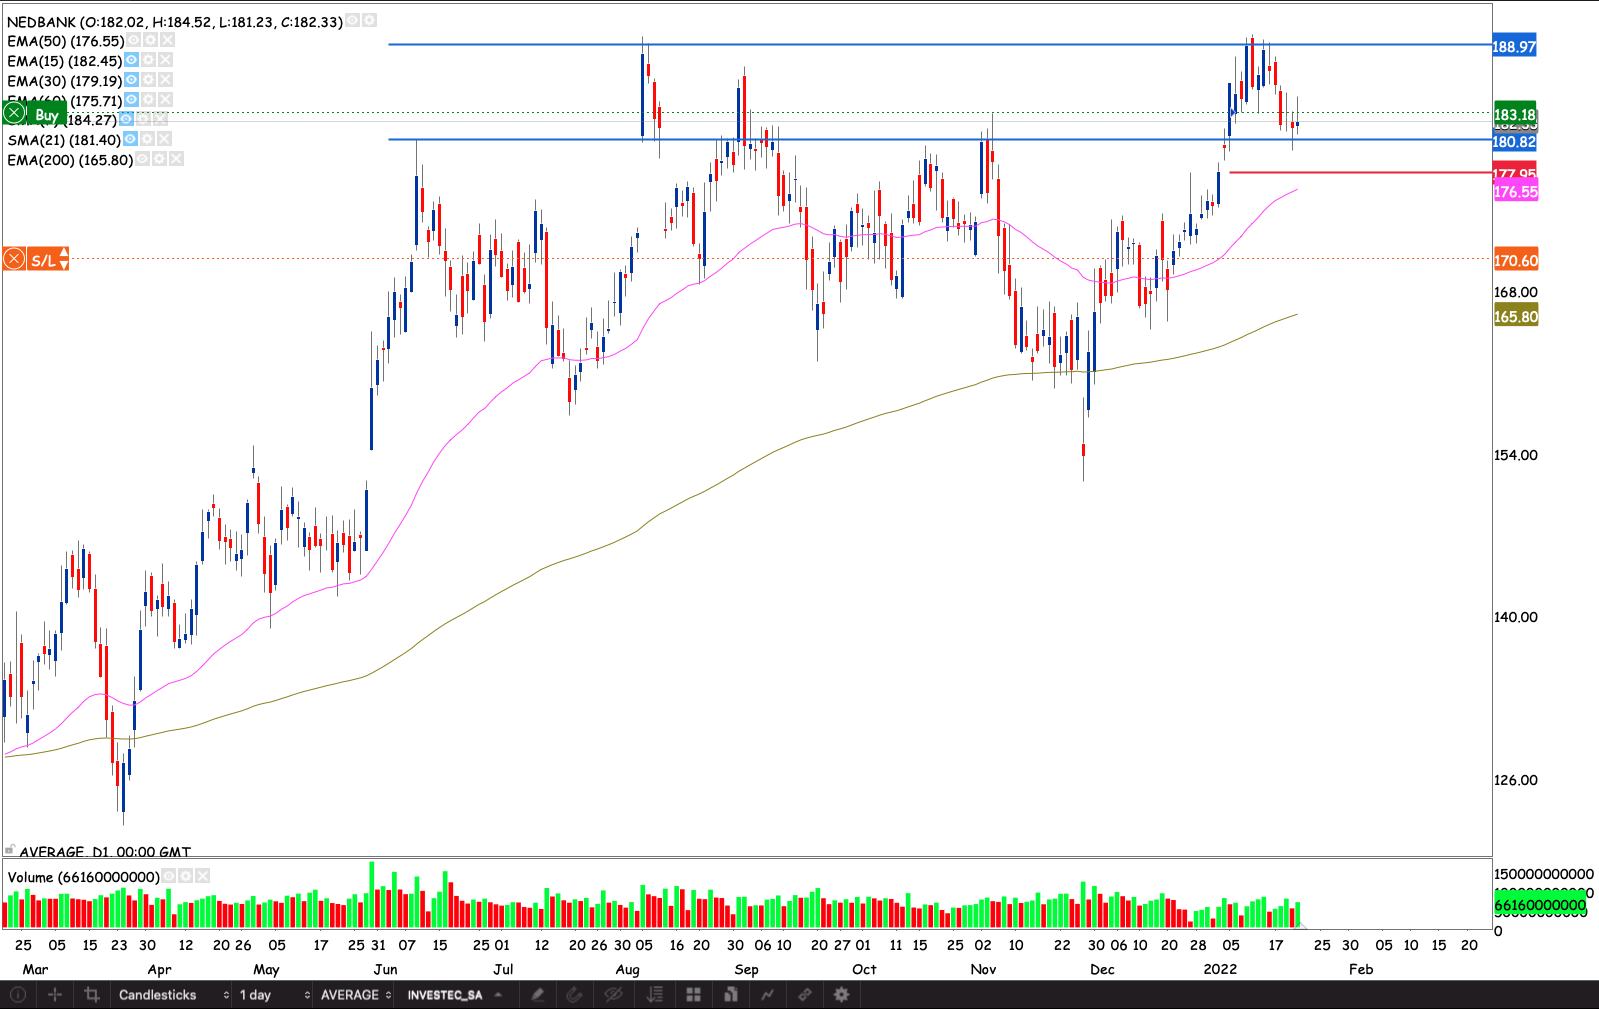
Nedbank
The rate hike helped Nedbank to break the R186.60 resistance. As the stock comes back above the 200 week EMA. Waiting for the stock to move into a higher box. But I will monitor price action on the current box for opportunities to raise my and add to my position.
Resources
African Rainbow Mineral.
We have a bullish flag, the stock still battling with the weight of the 50 & 200 day EMAs. PGMs are starting to come back into play. If the stock can break the back above the 200 day EMA. I’m putting it on a buy. Monitoring the R250 resistance, if the market takes out this level. It’s all systems go for the R304 target.
Amplats
The stock has been an up-trend channel, backed by a golden cross. With the 50 day EMA servicing as trendline support. I’m waiting for a close through R1971.75. I will then raise my stop loss to R1770.45.
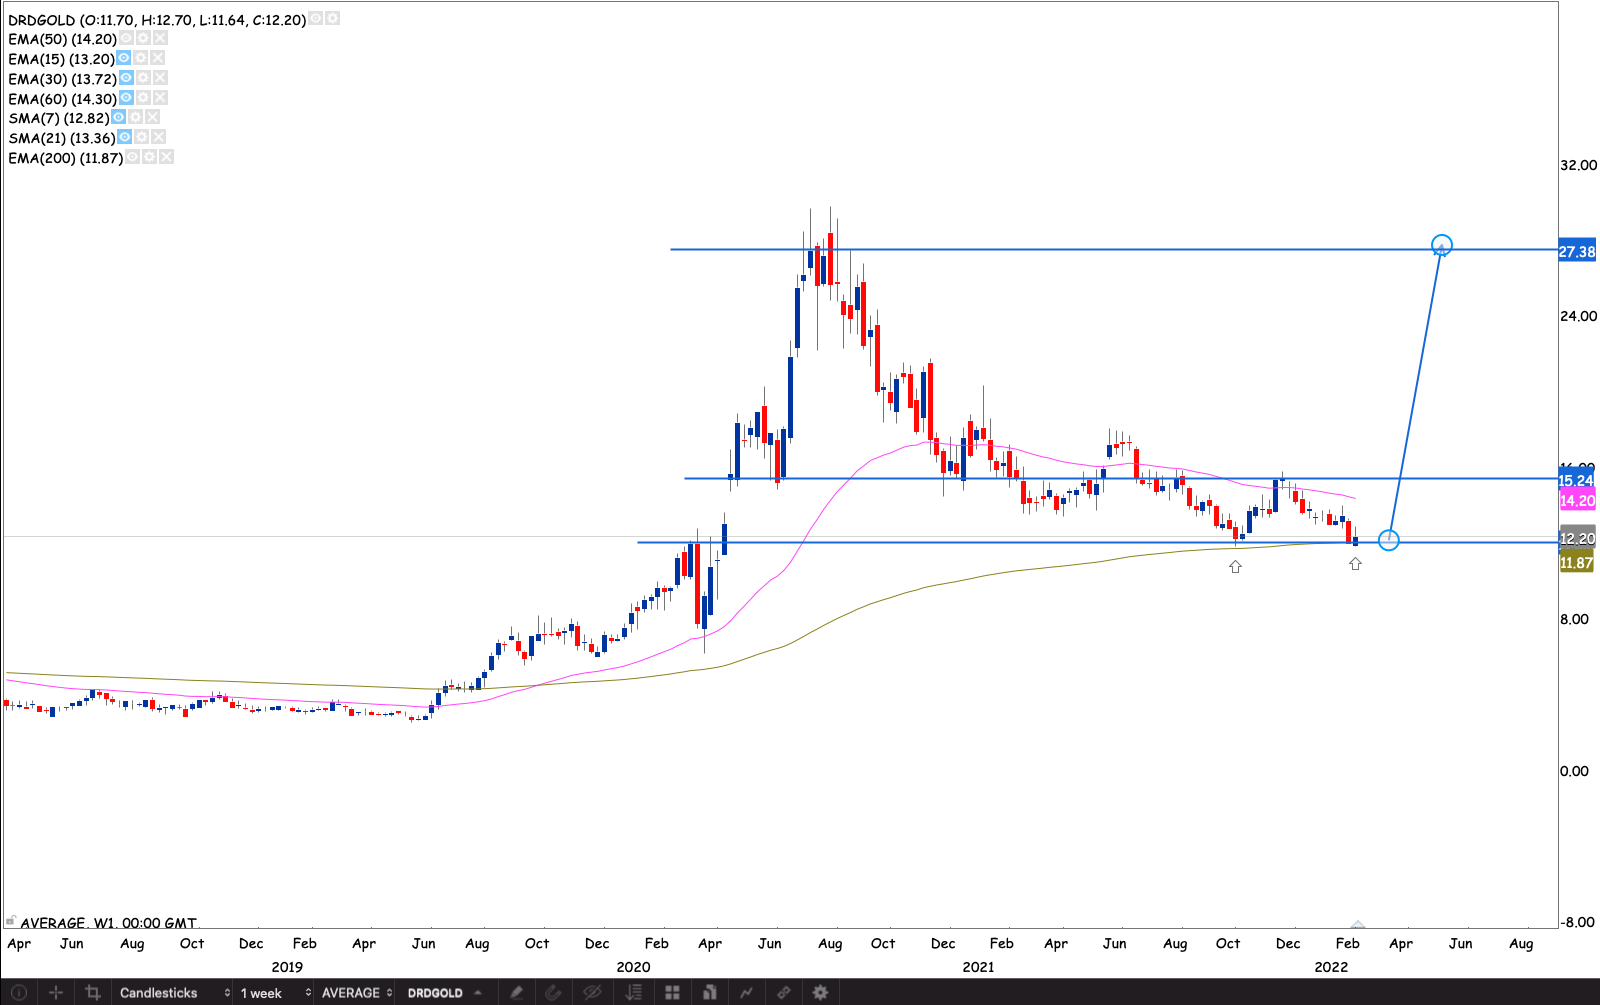
DRD Gold
We have a double bottom on the weekly chart. Holding the 200 week EMA. Looks like sellers are running out of stock or DRD got cheap. If the stock can break R15, I think we set for the R17 highs.
Kumba
Iron ore prices have been surging. Breaking out a Head and Shoulders pattern.
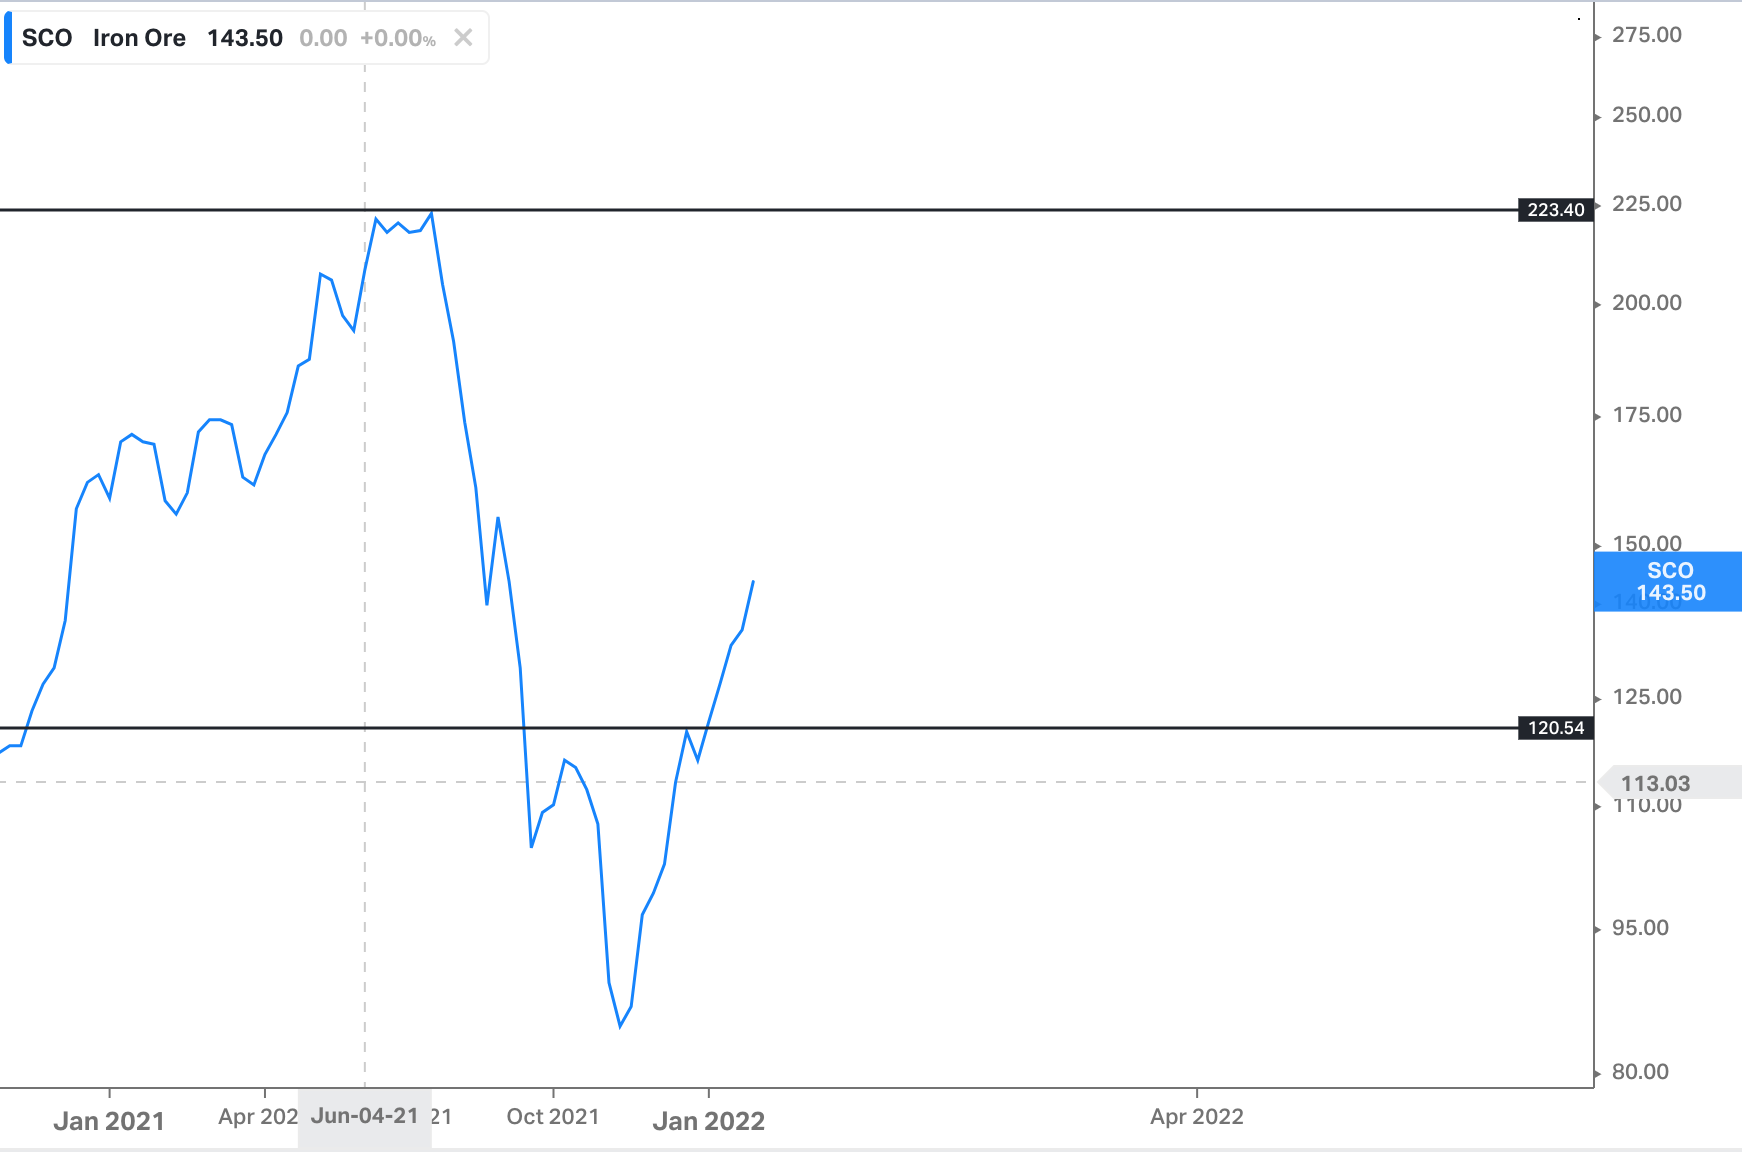
Kumba is well positioned for to profit from this rally. It bottomed out in November last year. Now back above the 200 day EMA, hasn’t looked back since.
Sasol
There is some great wind at the back of this Sasol trade. Oil prices have been surging, Sasol is only one of the only plays in town. On the oil trade. The stock fitted with entering the higher box, breaking the R350 old support . If the market breaks back to the higher box, I will raise my stop loss and add to the position
Telecoms
MTN
This stock is my biggest position, nearly a third of my portfolio. More than half my profit comes from this trade. With risk being a 61.19% profit, it’s a comfortable hold. The stock gapped up about 5% last week, it’s been making higher lows. If the stock breaks below the up-trend line in an attempt to close the gap, I expect the R175 old resistance to hold support . For now I think we’re going to see an ascending triangle as the stock rectacts to R200. With oil being a strong bull market. I think MTN will eventually break R200. At which point I will add to the position.

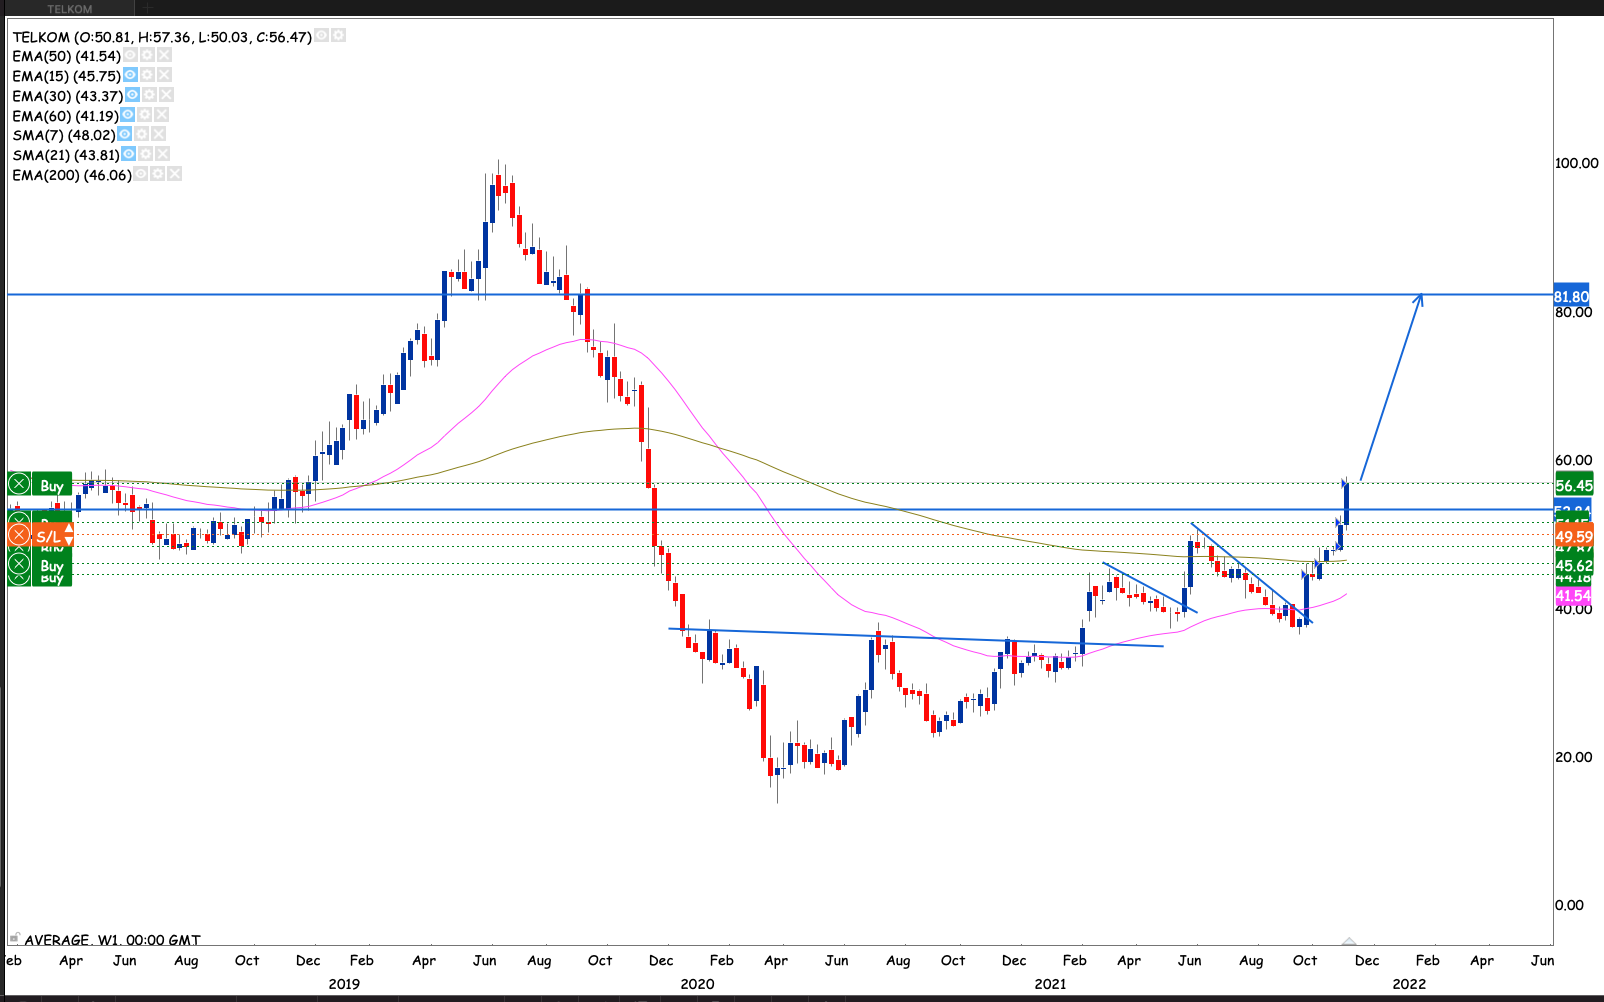
Telkom
Telkom has been a tough hold. I’ve been stopped quite a few times. Problem is the deep draw down. The stock is now back above the 50 day EMA after testing the 200 day. I will build a position in the stock with an initial stop loss at R46.20. Putting on a 1% risk with 20.7 shares

Others
British American Tobacco
The stock broke the R667 resistance I was waiting for. I raised my stop loss to R624.44. Raising my position to a +0.5% profit. I will add another 1% risk to the position with 1.7 Shares on Monday’s open. Now waiting to see how the R708.75 reacts. If the market break that level. I think we set for the R959 highs
Bidcorp
The stock finally broke the R335 resistance. The stock last closed above this resistance in February 2020. It came back to retest it from above and held. I started building a position on the stock. Now waiting for a close through R354 to raise my stop loss.

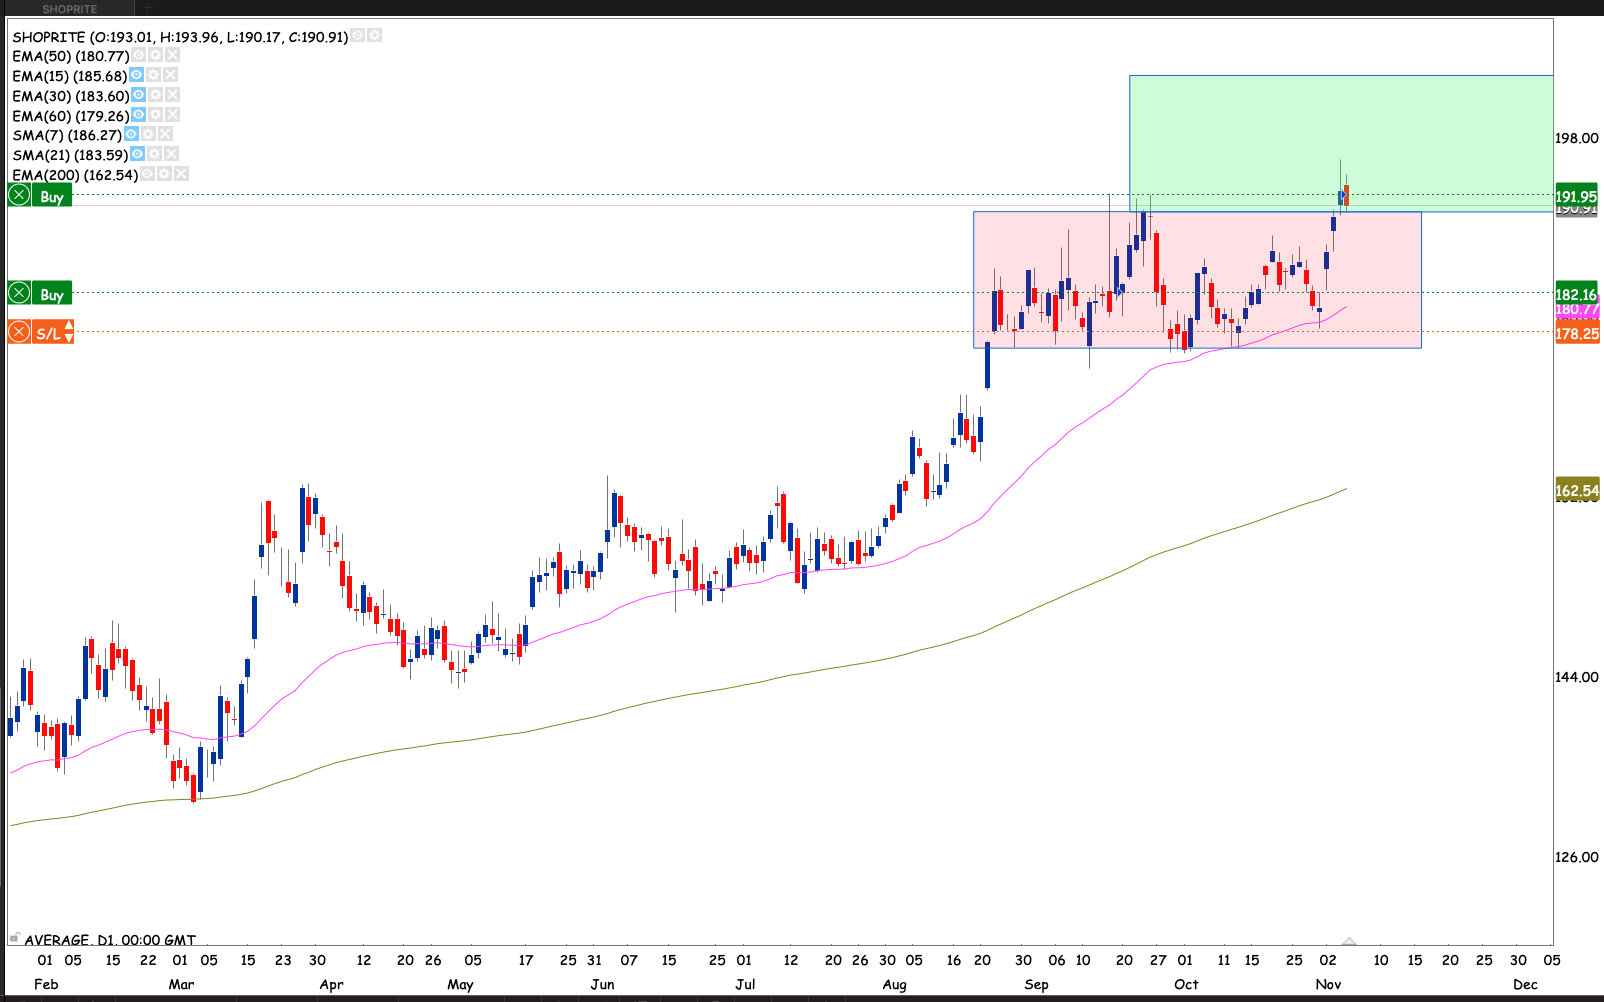
Shoprite
A strong update last week, the market loved the update stock gapped straight into the higher box. While it’s peers are having a tough time, the stocks are making lower lows. Waiting to see how the market will treat the R233 resistance. Because last time we were here the stock more than halved. Took roughly two years to recover from the fall. There may be a lot of stale bulls happy to finally break even. I expect the stock to react and hold R233 before continuing to break higher. Then I will add again to the position
Portfolio Summary on 6 February 2022
Capital invested: R10 303.77
Current Balance: R8 938.13 -13.25%
Current Equity (Balance including paper P&L): R24 312.95 +135.96%
Current P&L : +R15 374.82
Equity curve Vs Benchmark (Satrix 40 ETF )
Closed trades statistics and distribution
Open trades statistics and distribution assuming all stops are hit

Thank you for reaching far. For any questions feel free to email me at njabulo@villagetrader.co.za
]]>The MPC announced another 25bps rate increase when they met on Thursday. The market expected the 25bps increase. You could see that by how the banking stocks were acting from Tuesday after the Monday sell off. The banks began the rally after the announcement. Most breaking short term resistance.
Resources have been building a rally, oil continuing its run, benefiting Sasol and MTN. Its been a generally good week for resources.
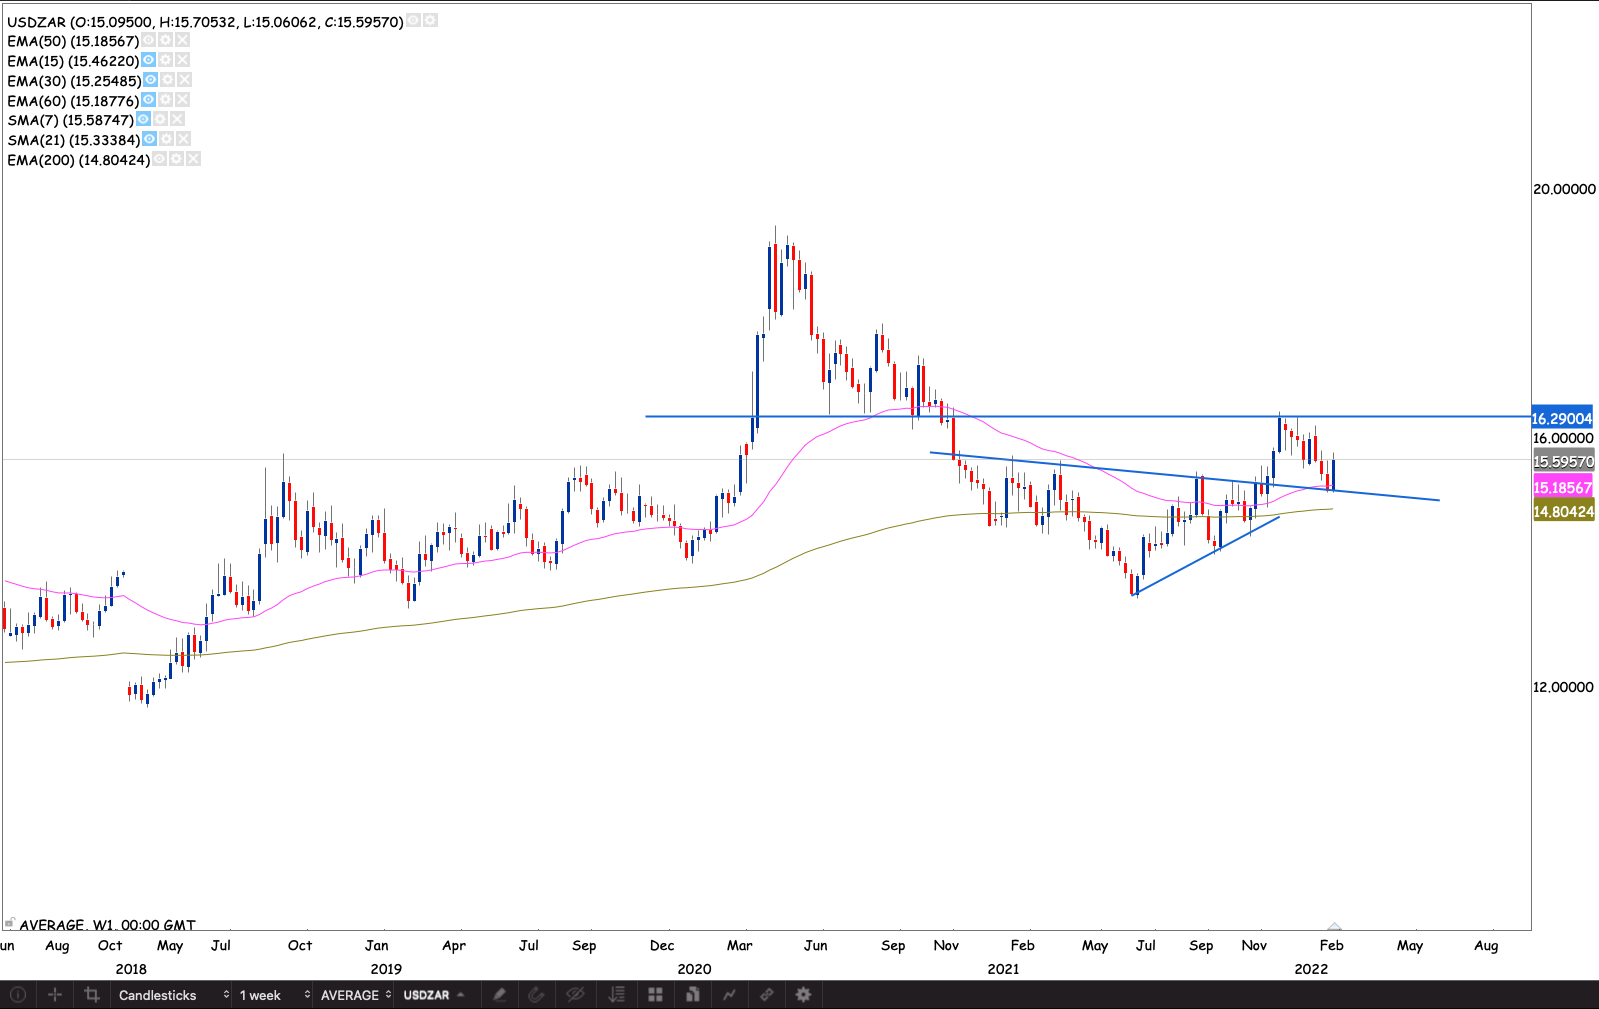
ZAR showing some weakness. Looks like it’s headed towards R16 and perhaps breaking through this level.
This should boost commodity stocks and companies with hard currency revenue exposure
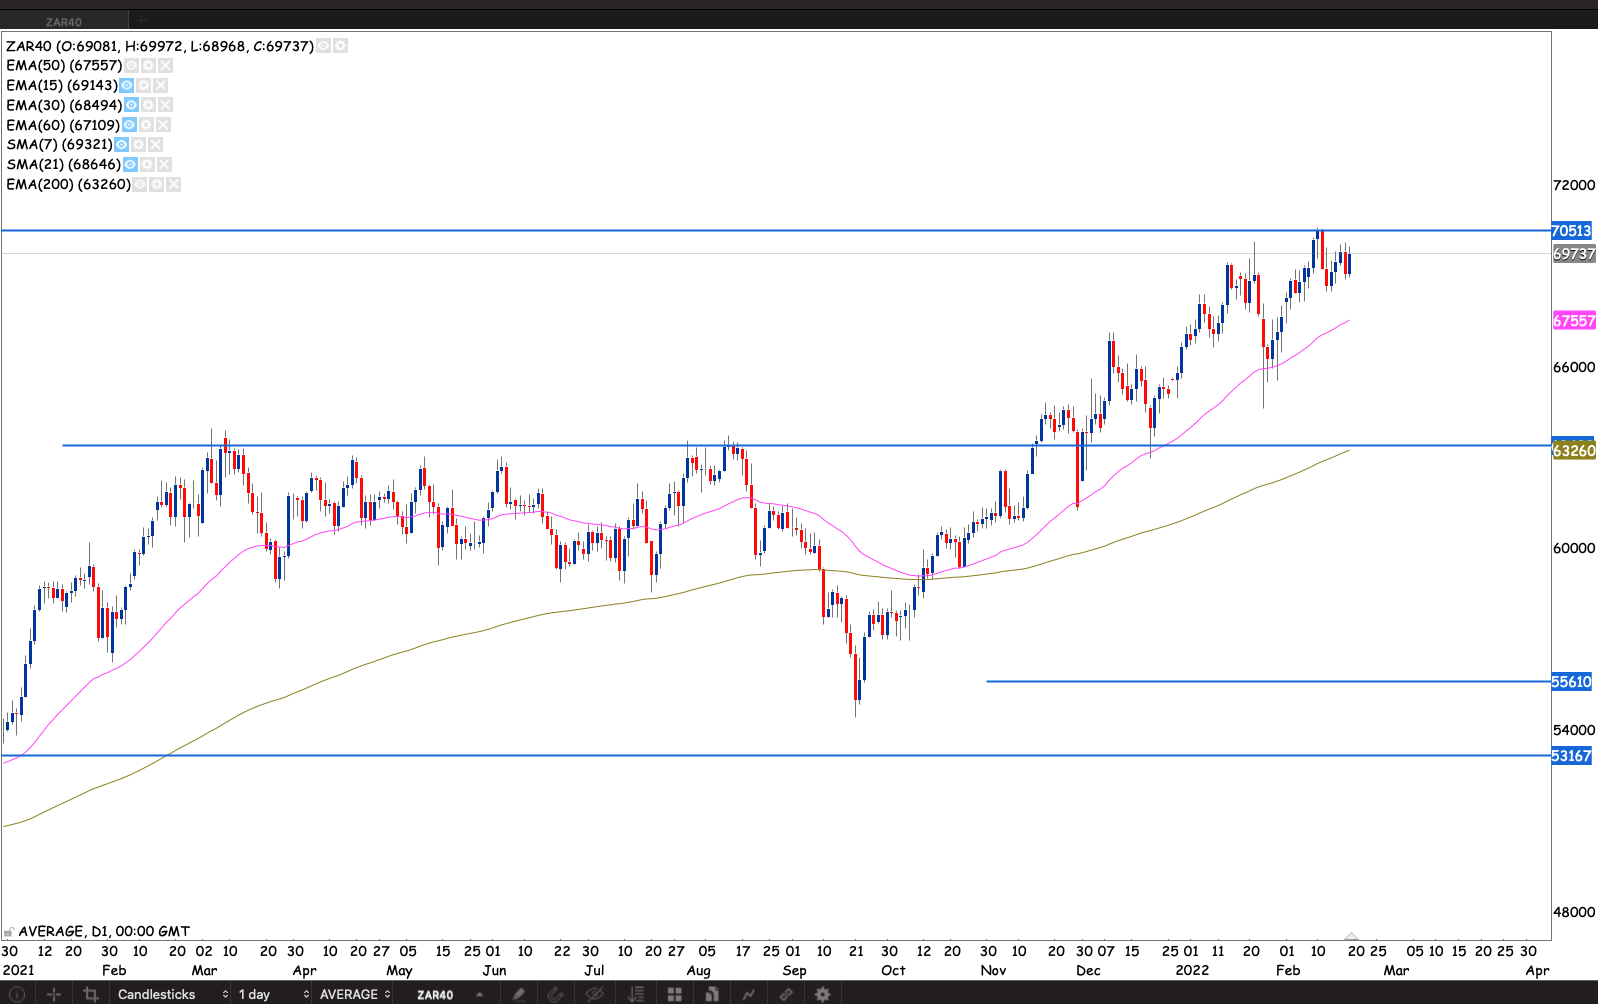
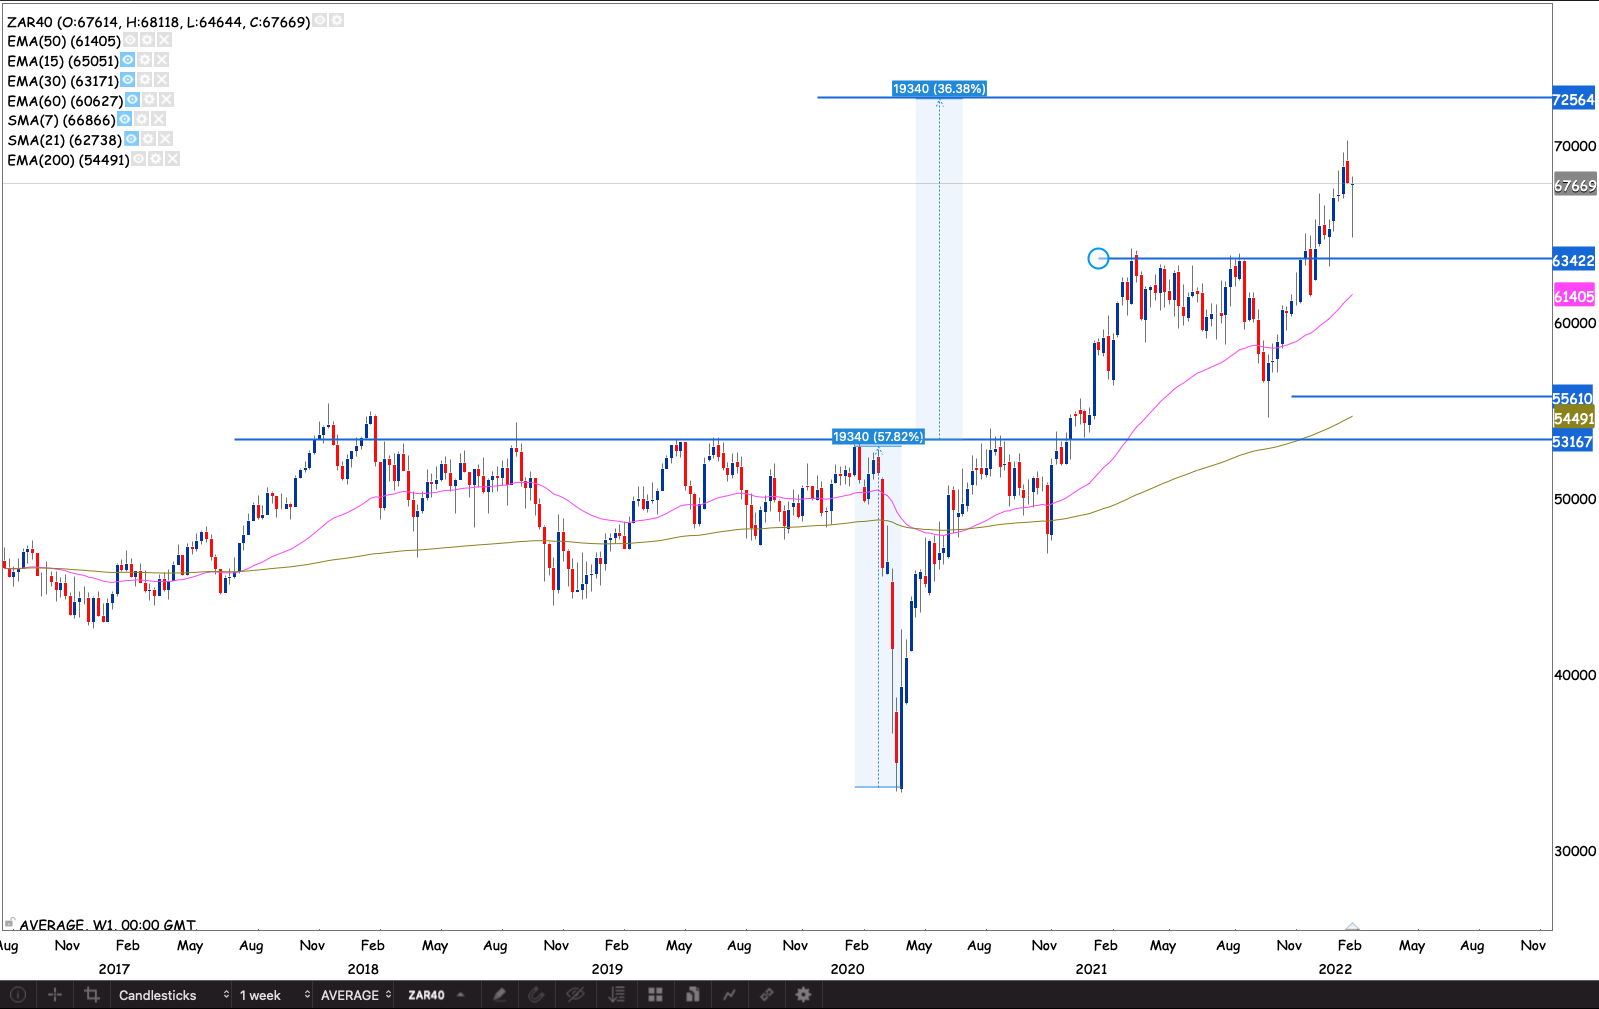
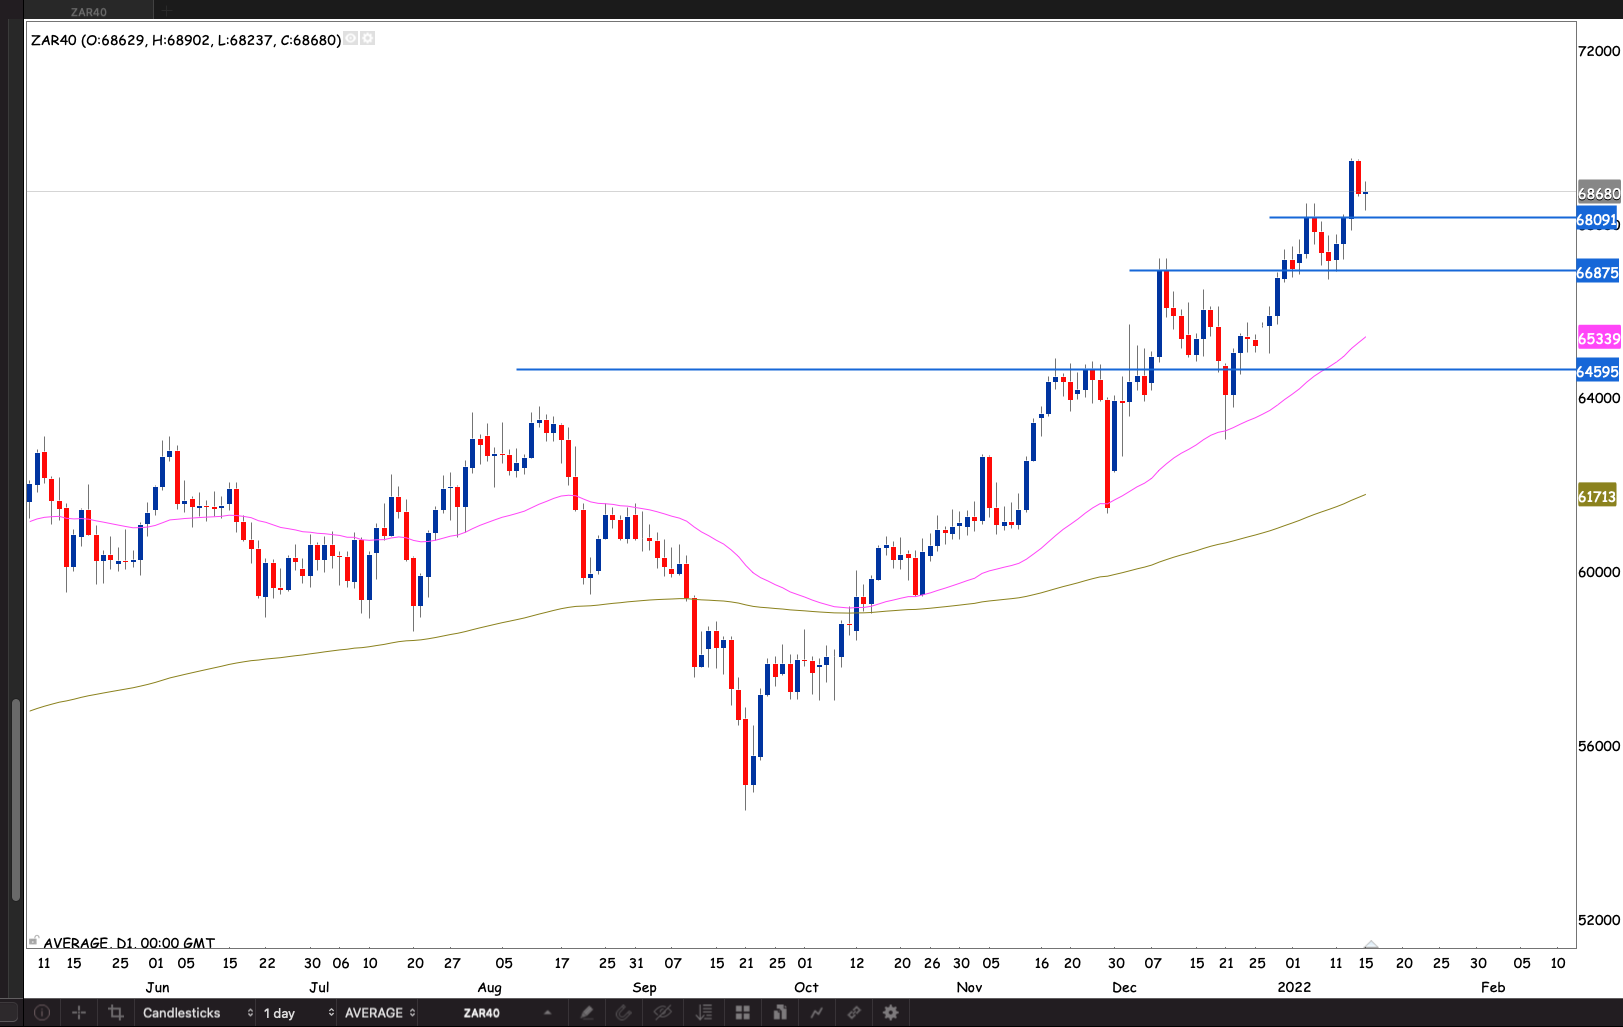
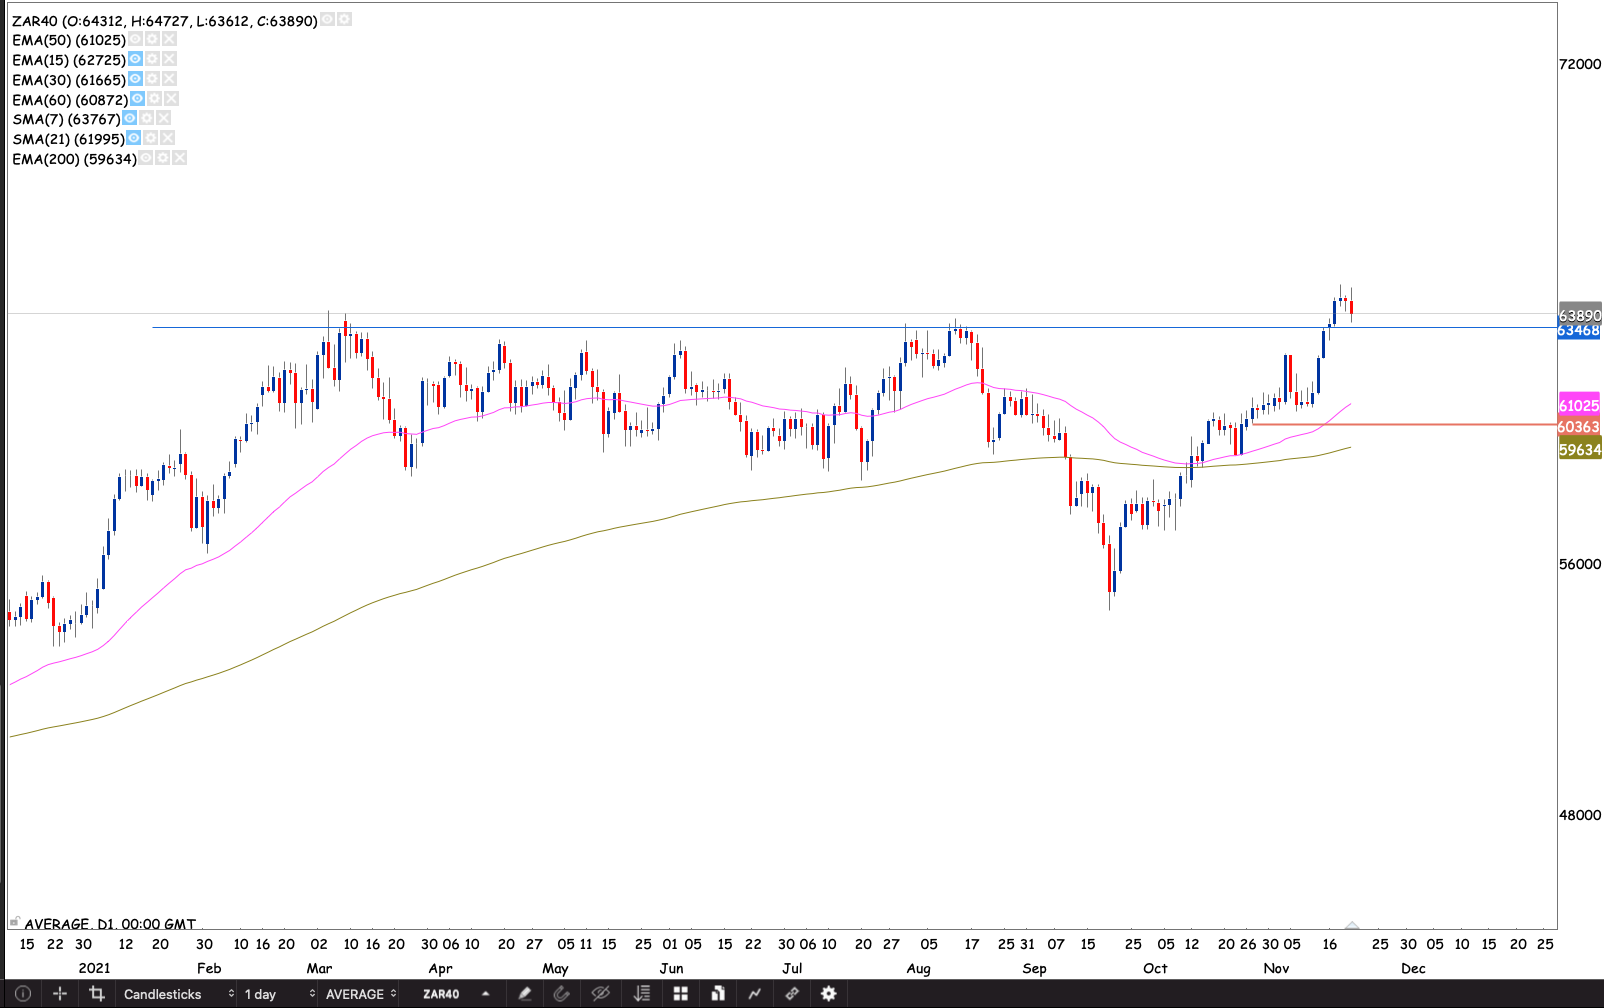
Top 40
Back in 2020 we had an ambitious target of 72.5K from a head and shoulders pattern. We’re now only about 7% away from that target. WIth the weakening rand we should hit this target in a few months or weeks. Nice reversal doji as the market tried to retest the R63.4k resistance.
Let’s have a look at this week’s stocks in play
Absa
We recently had a weekly golden cross. At the back of the MPC announcement the stock broke out of its box with a bullish engulfing candle. I raised my stop loss to R156.69. Raising my position to just above break even at +0.2%. The stock breaks to the higher box this week. I will raise my stop loss and add to the position.

Capitec
The stock was saved by the 50 day EMA. Capitec legged the group and is yet to rally post the MPC announcement. At least it stopped falling. There seems to be a topline resistance at R2008 level. I don’t expect that level to hold for too long. I’m gonna wait for the market to break the resistance. I will start building a position on the stock.
Discovery
The symmetrical triangle pattern play continues to work well. It is certainly boosted by Thursday’s announcement. There was a reversal of the doji candle as the stock bounced off the 50 day EMA. It proceeded to make a new relative high. There is an old resistance at R156. I think the market will react to it. When the market breaks this level I will raise my stop loss and add to the position
Investec
Investec is my second largest holding. It looked like I was going to get stopped out there for a moment. When the stock closed below the 50 day EMA. it came back with a 3 white soldiers pattern. Still waiting to see if it will hold R90. If the market breaks the that level. I will gradually raise my stop loss.
Firstrand
Firstrand held the 50 day EMA with reversal bullish engulfing candle. Looking well poised to complete and break out the head and shoulders pattern. I’m waiting for the R64.50 neckline to break. Then I will raise my stop loss to just below the 50 day EMA.
Nedbank
The stock made a new relative high close breaking a long term base at the back of the MPC announcement. I raised my stop loss to just below the 50 day EMA. There’s long term support/resistance R200. I’m expecting the stock to react at that level. When the market break this level I will add to the position.
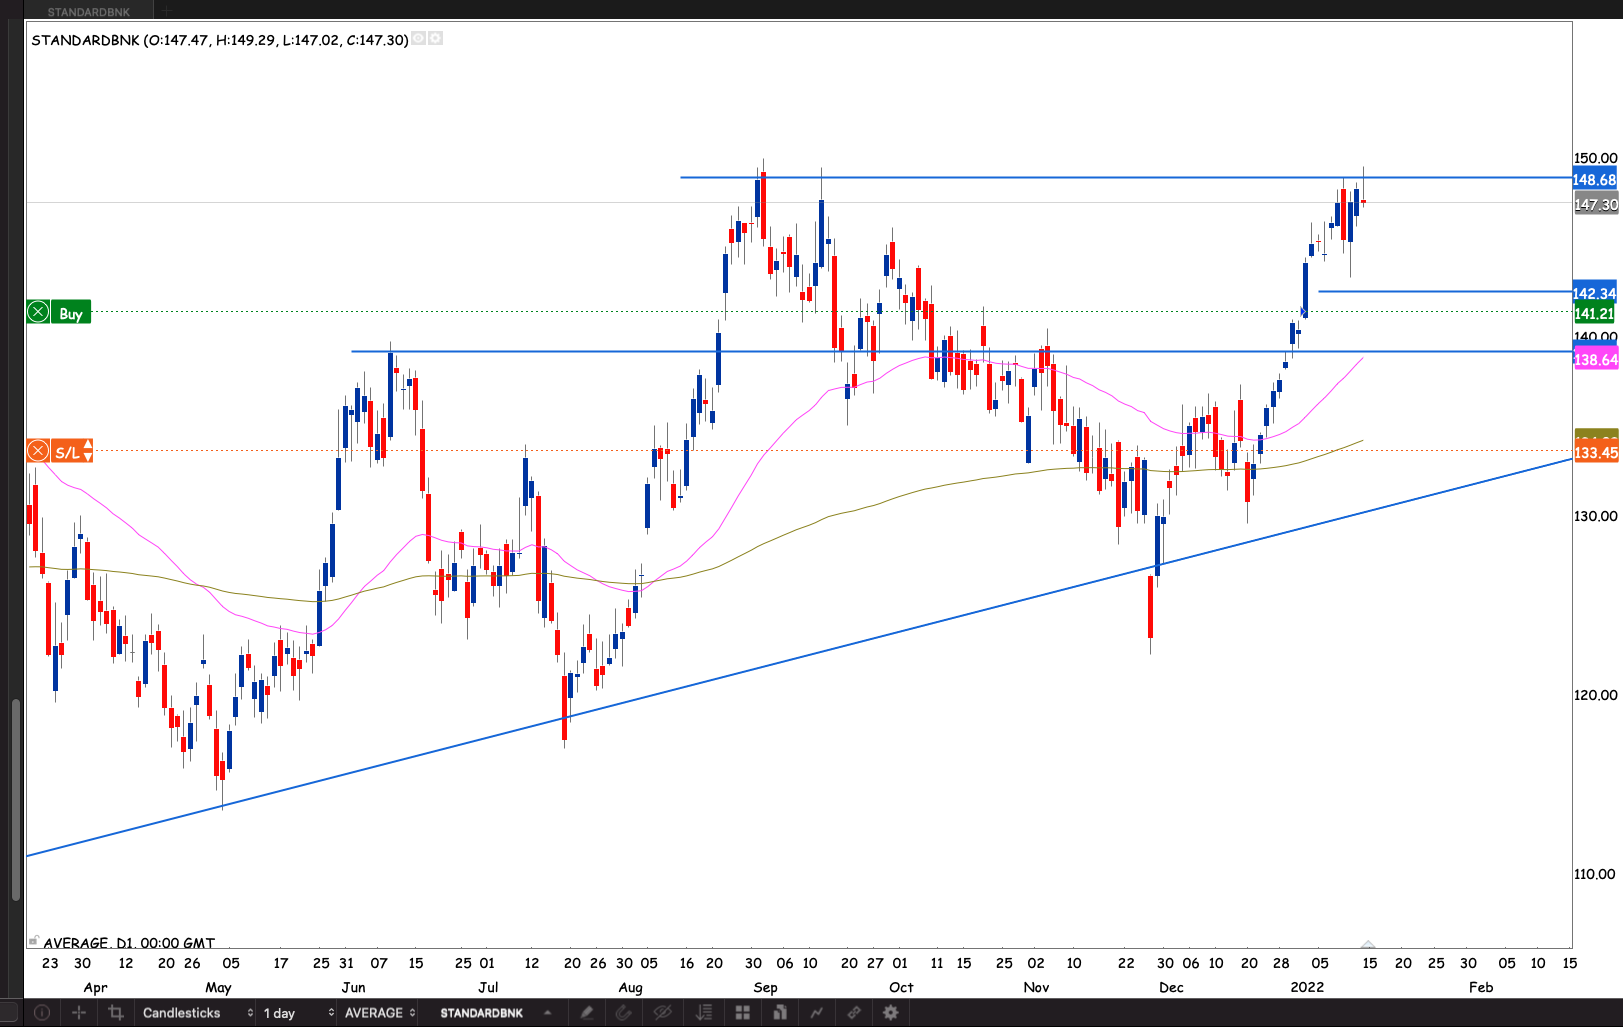
Standard Bank
The stock broke the R148 resistance after bouncing off the 50 day EMA. I raised my stop loss to just below the 50 day EMA to R139.79

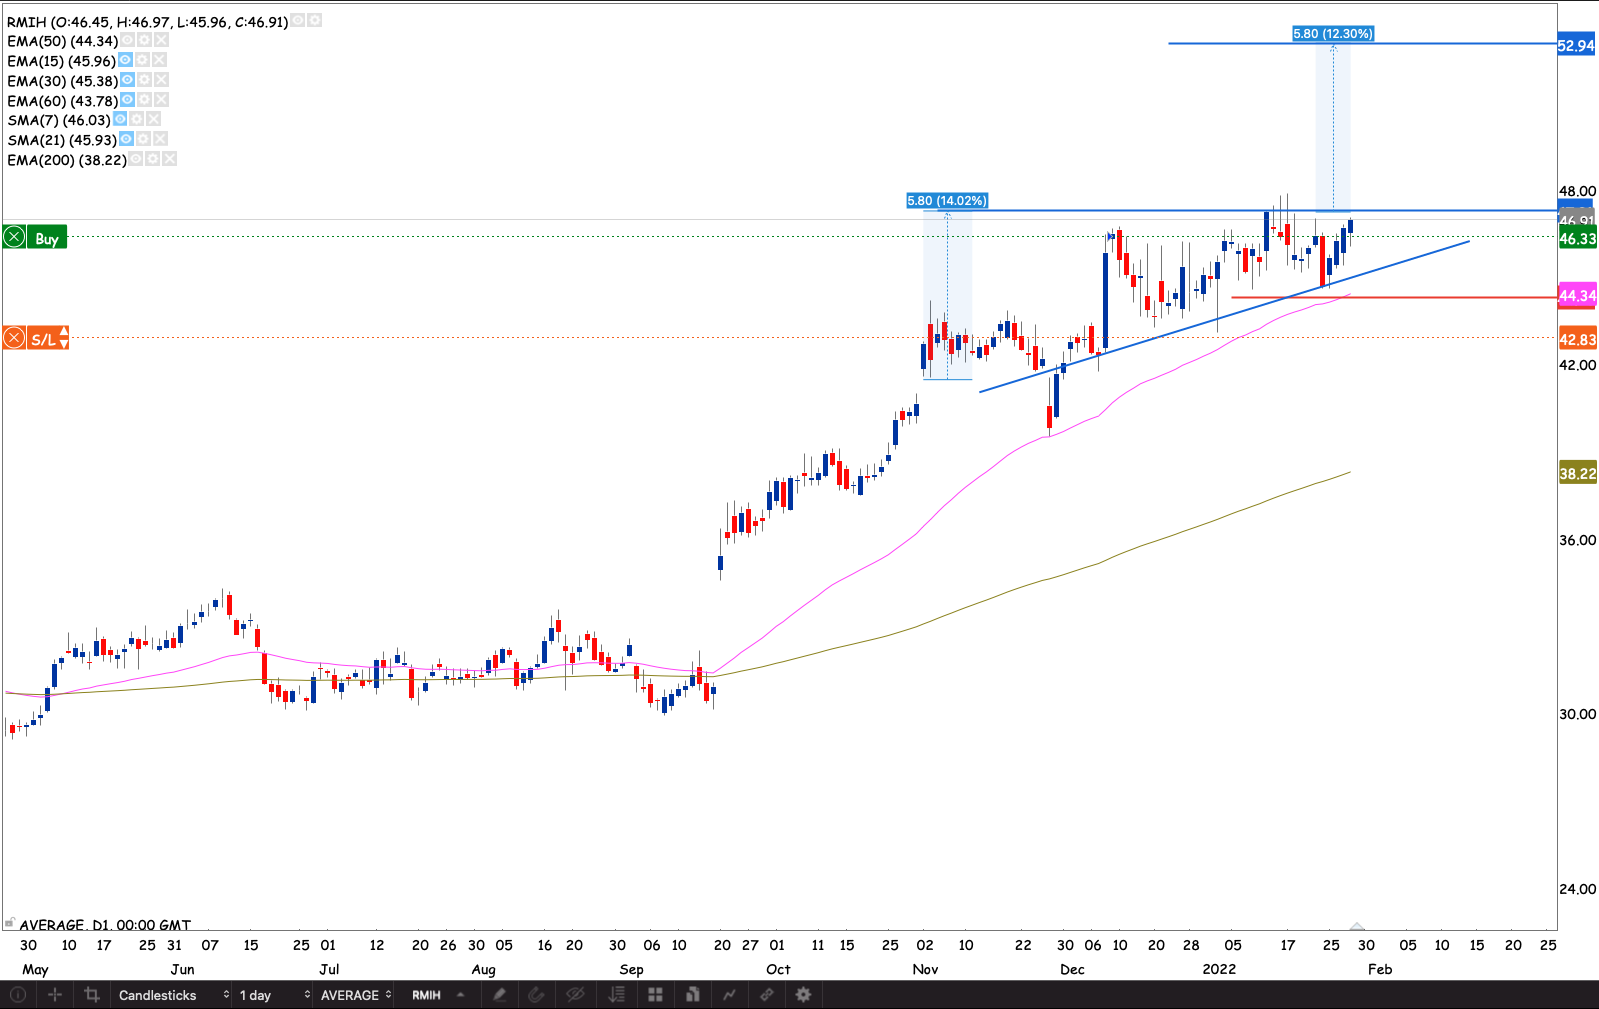
Rand Merchant Investment Holding
We have a nice ascending triangle pattern looking ready for a breakout. Just waiting for a close through R46.90. To consider it a buy, but I will instead raise my stop loss to around R44 , just below the the 50 day EMA
British American Tobacco
Continuing to rally, it had a pause this past week but ended the week strongly. There’s an old support at R667 which was touched when the stock made a new relative high. I’m expecting the market to react there again, but eventually break through. If it breaks R667 it’s a good buy. I will raise my stop loss to around R630 and add to my position.
Gencore
The stock had a sharp sell off. Buyers came in to defend the 50 day EMA. There was a bit of resistance on the prior rally around R84.30. I expect the stock to react but ultimately break through it. Commodity prices provide a fair bit of wind at the back. If the market breaks the R84.30 level. I will raise my stop loss to R78.90 and add to the position.

Sasol
There was a massive base breakout on Sasol this week. Boosted by the rally in oil price and a weakening rand. There’s a strong old support at R358. With the current momentum I expect the stock to break right through it. However, a reaction to retest R315 is on the cards as well. Above R358 there are far fewer stale bulls, meaning there’s gonna be fewer and more shallow draw downs on the share enroute to the new ATH above R651. It’s gonna take a while of course

MTN
I added to the position this past week. Now just over a third of my portfolio is on MTN. There’s still an overhead resistance at R175. But with oil prices running as they are MTN should benefit from that rally, and break right through R175. Then the next level where we might find some selling will be around R190.
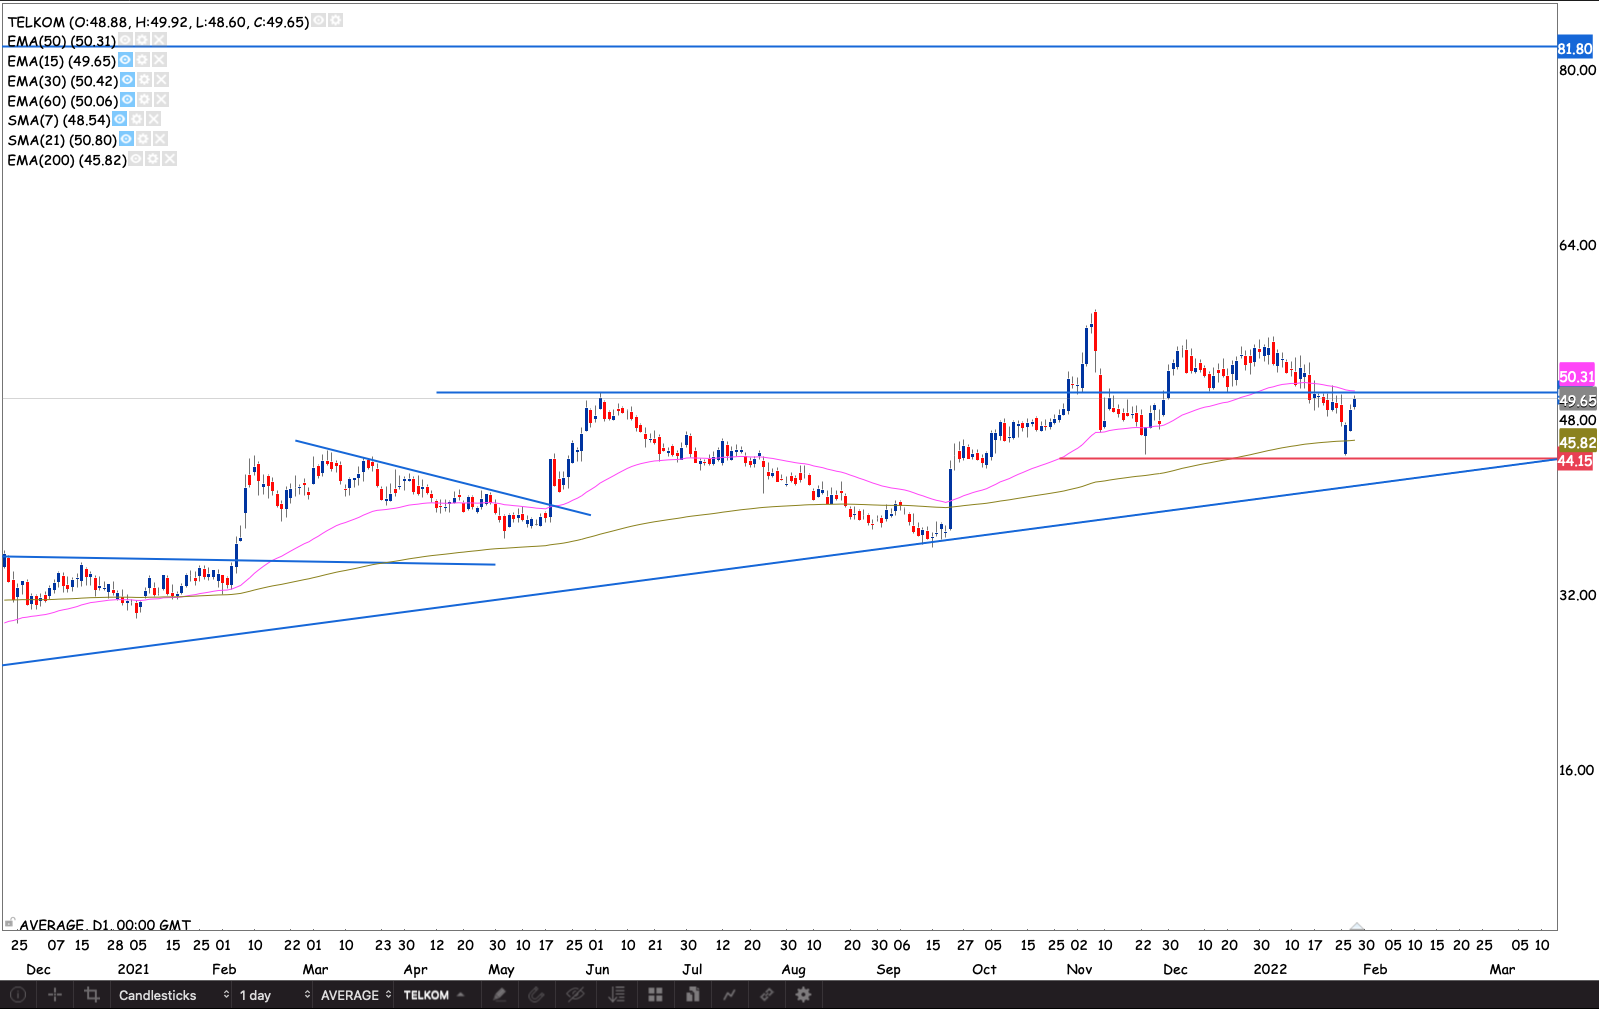
Telkom
It’s been quite a challenge to hold the Telkom rally. The stock has particularly deep draw downs. Controversies don’t help the situation. However, I remain bullish on the stock. It held the 200 day EMA well with 3 white soldiers. I’m waiting for the stock to come back above the 50 day EMA, to rebuild a position on the stock.
Pepkor
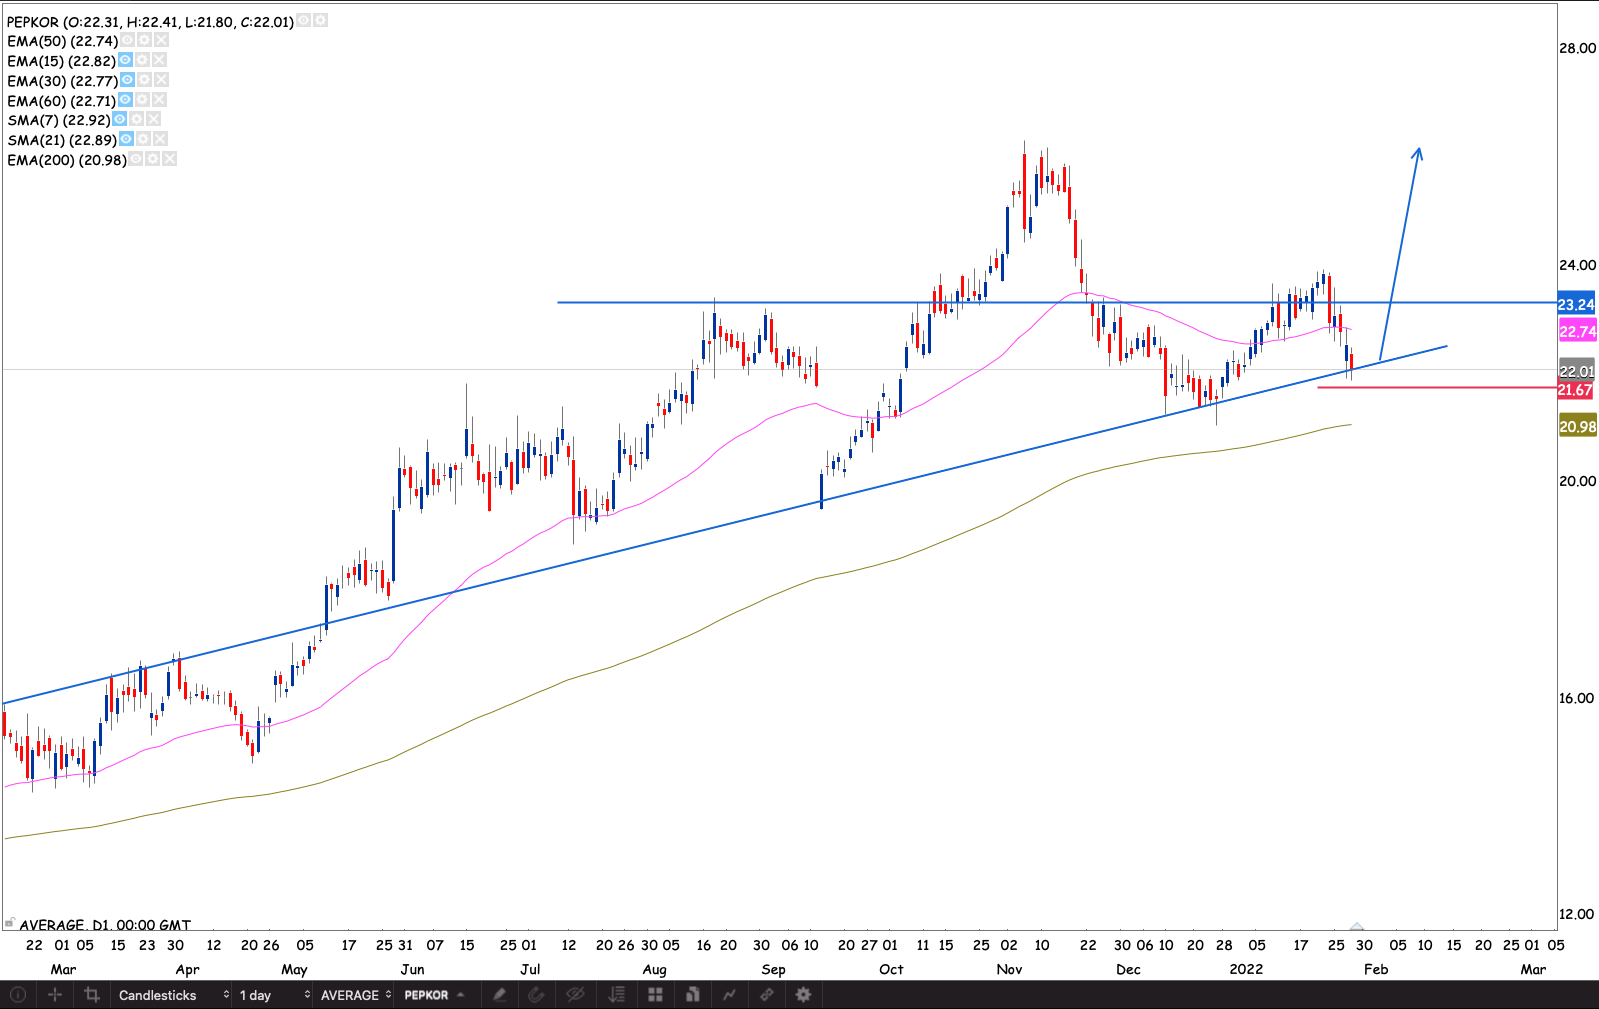
Pepkor continues to hold the long term trend line. Steinhoff is still a risk, as they may sell some Pepkor shares to reduce the heavy debt pile. At this level the stock provides an excellent risk reward ratio. However I will only start to rebuild a position above R23.25 and keep my stop loss as wide as I can until the Steinhoff risk is reduced.
Shoprite
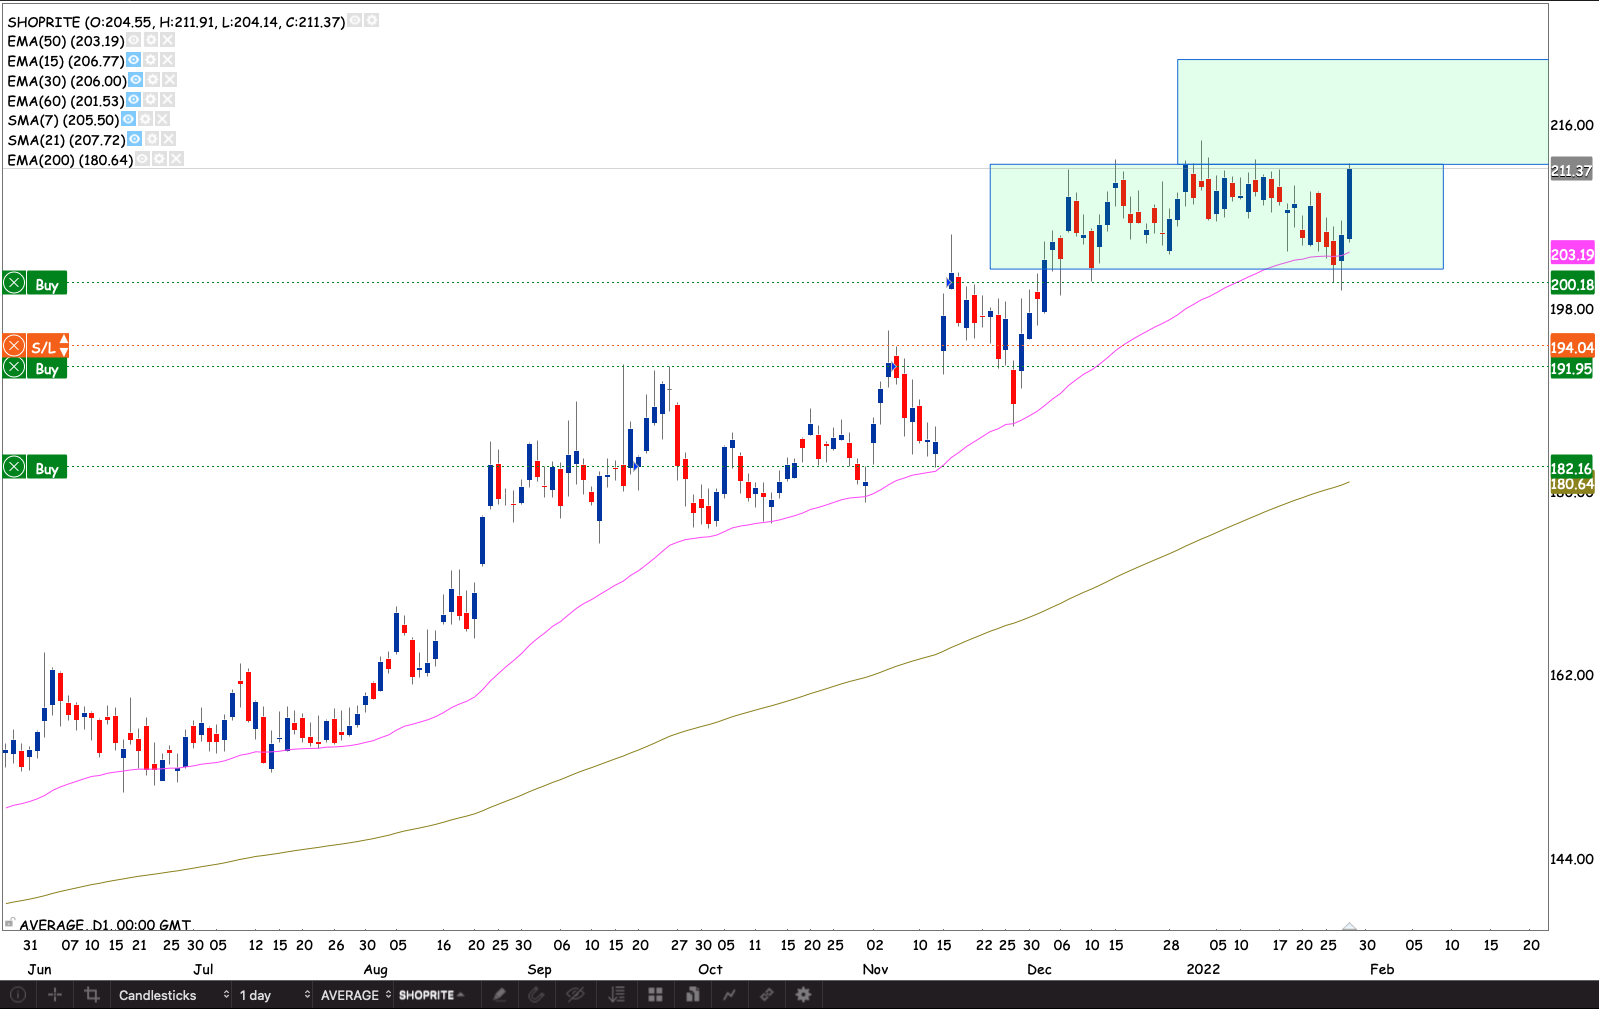
The retailer repelled from the 50 day EMA like it was a hot stove and went to flirt with the higher box yet again. I’m waiting for the stock to move to a higher box by breaking through R211, to add to my position. I will try to keep my stop loss below the 50 day EMA. The stock seems to respect this moving average a lot.
The banks we sold off as a collective the past couple of weeks, after having a strong rally. Most are now building reversal patterns. Expecting a turn in the market on our Banks
Resources
Resources stocks look very bullish at the moment. Oil run certainly helping Sasol break through R300.
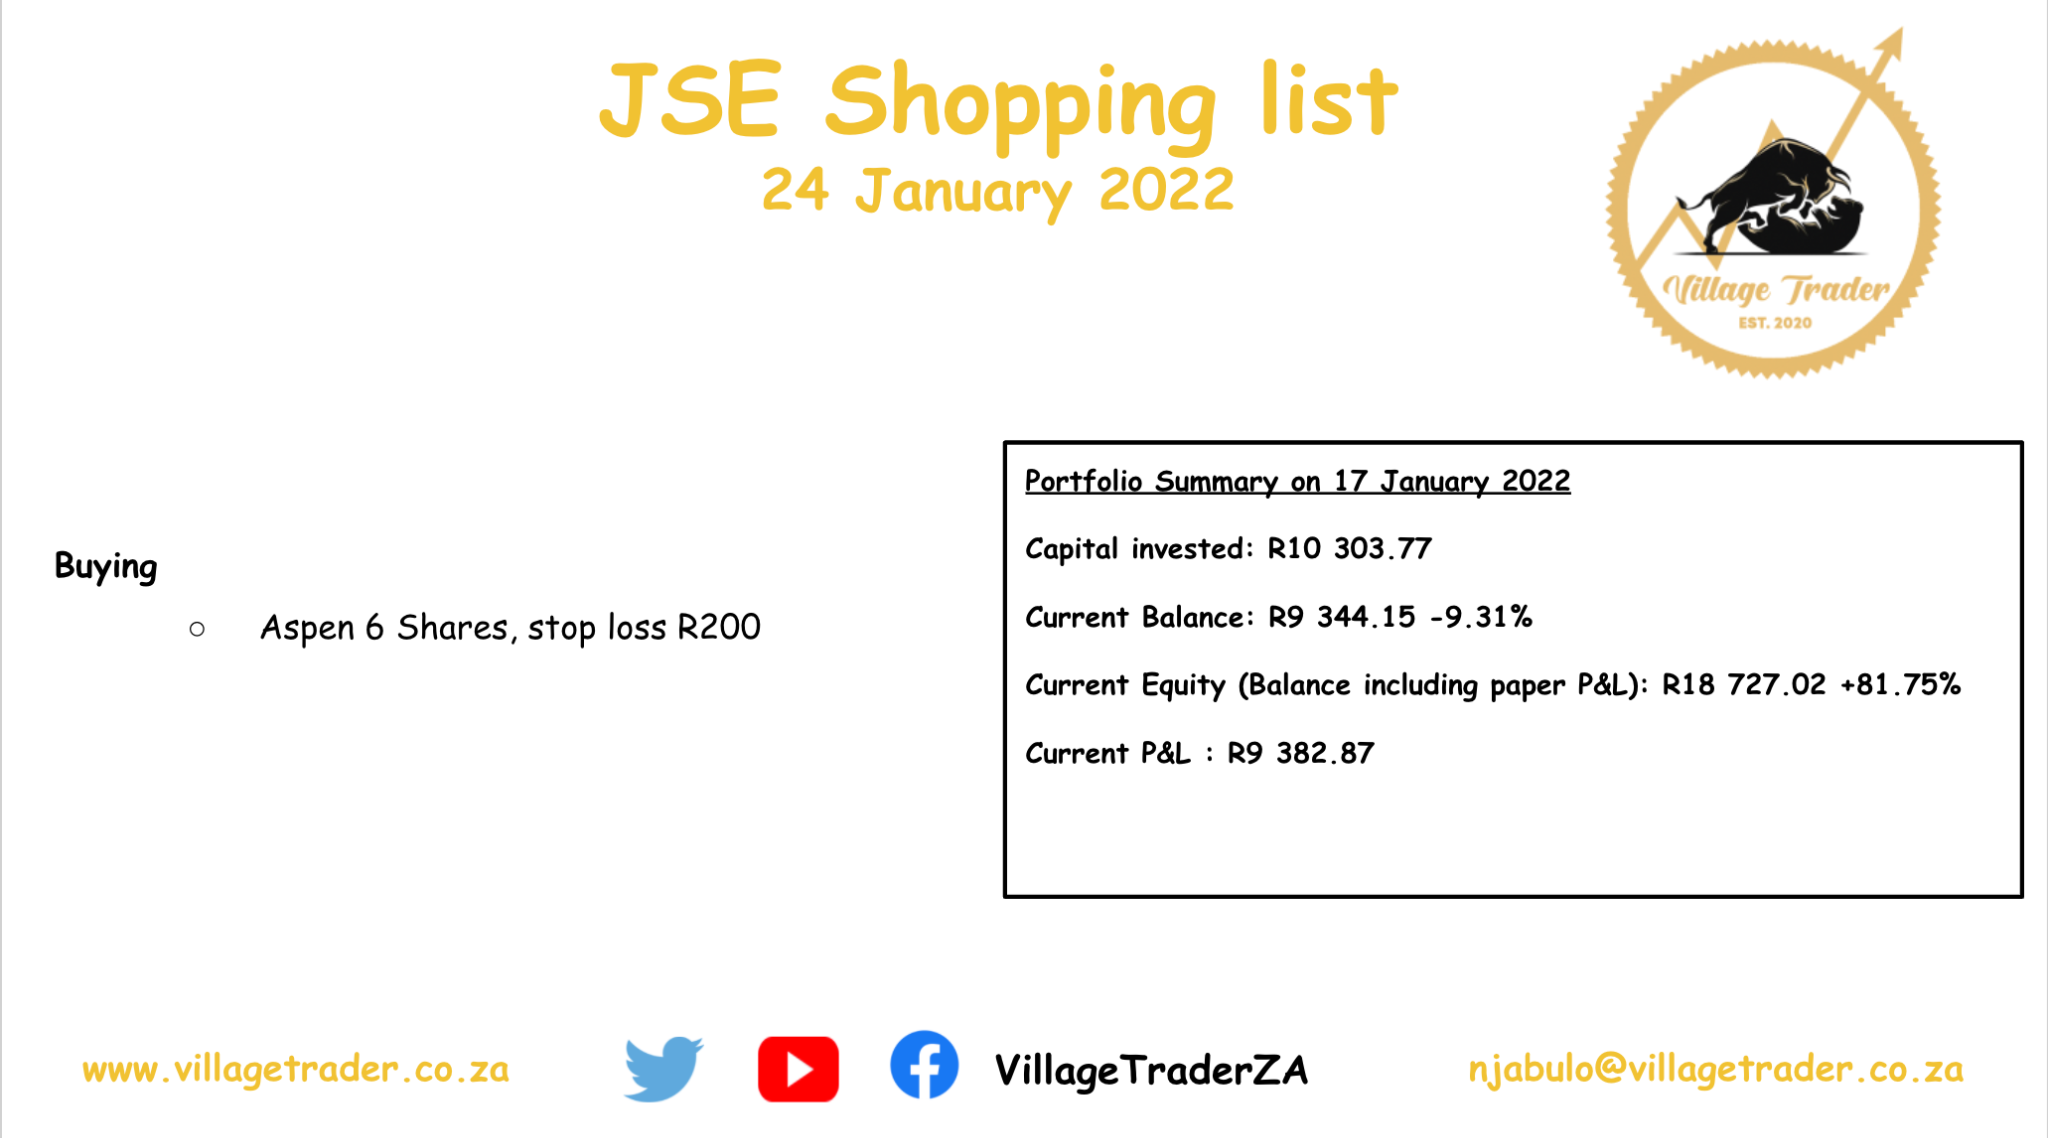
So far one stock has triggered a buyin Aspen
This week’s stock in play
Absa
The stock ran into some selling around the R165 level. This level has been a strong area of supply and demand. Coming back to test the old resistance from above and holding it. The stock could find itself range bound between R158 – 165. This means a break above R165 becomes a significant one. Triggering a buy.
Capitec
Buyers holding the 50 day EMA with a bullish engulfing. The decreased volume concerns me a bit, so I will wait for confirmation. A close above Friday’s bullish engulfing. To jump back in the trade.

Nedbank
The market came back to test the R180 old resistance. There are reversal candles, different variations of the doji candle. I’m expecting some buying to come in and hold R180. However I will wait for a close through R188 to raise my stop loss to around R177
Investec
The stock entered an area of supply and demand on Friday. I’m going to look for a reversal pattern around the 50 day EMA. Good place to “Buy the dip”. I’m going to wait for a break above R90 to raise my stop loss to just below the 50 day EMA.
Discovery
We had a reversal candle on Wednesday touching the 50 day EMA. If the stock makes a new relative high close above R149. I will raise my stop loss to just below Wednesday’s low at R140
Rand Merchant
We at the tail end of an ascending triangle R47.20 service as the top line. On that break I’ll raise my stop to R44.70. It’s a buy for a R52.95 target.
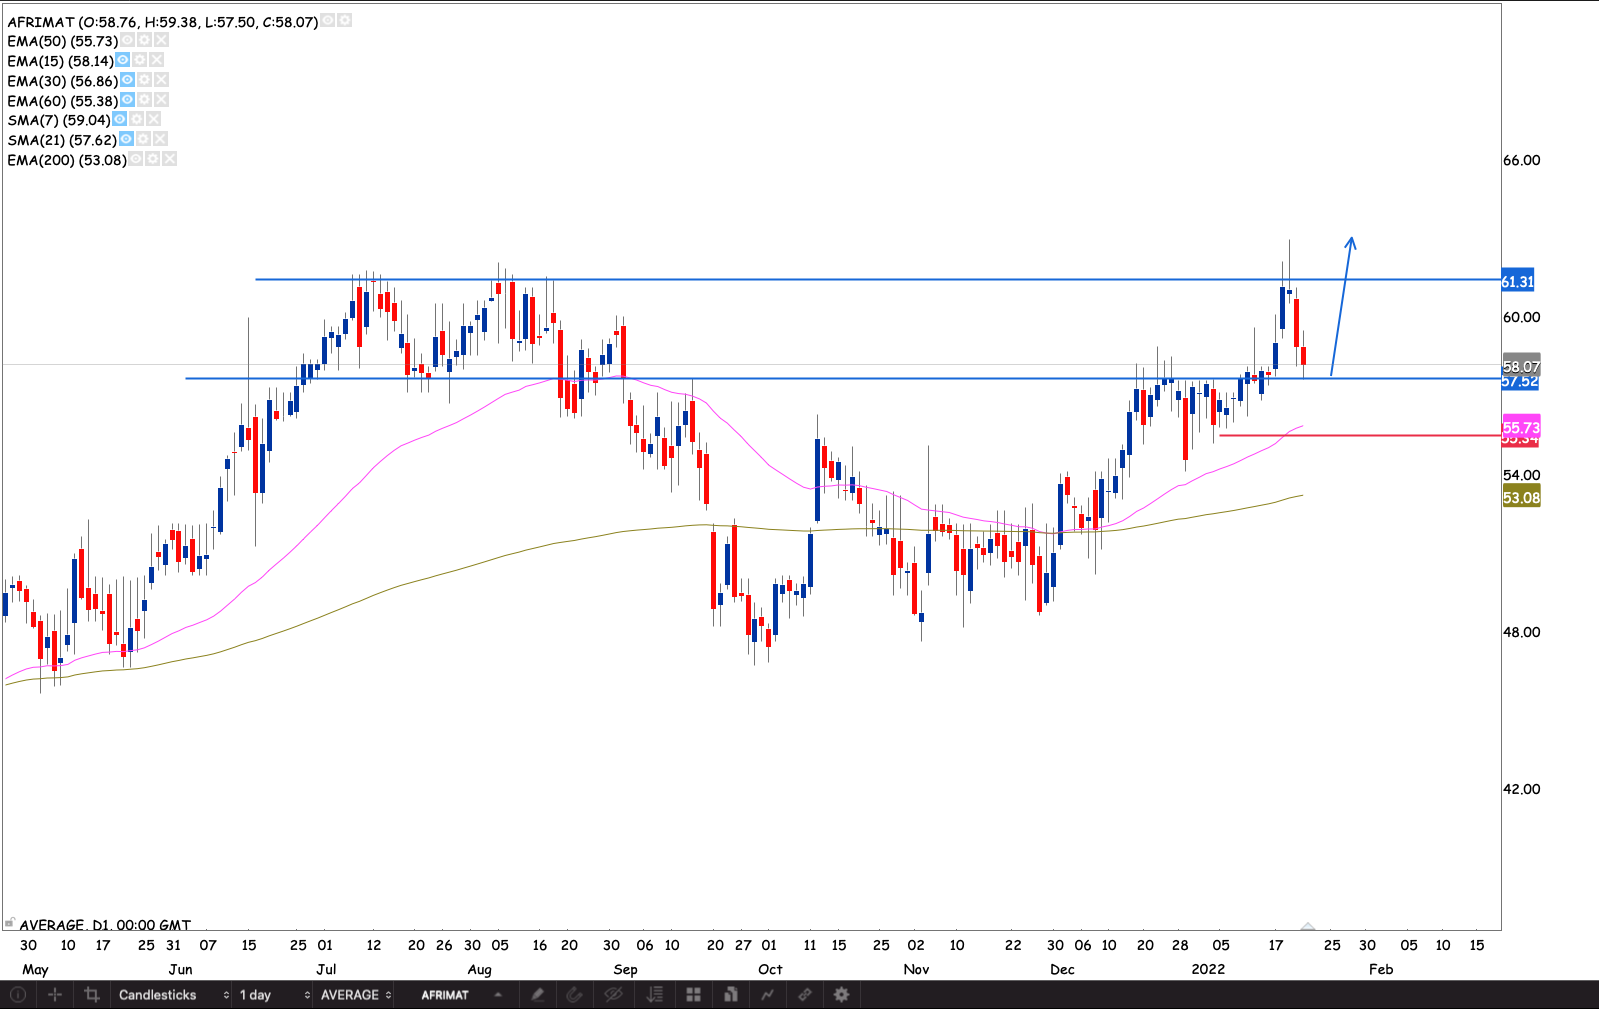
Afrimat
The stock respected the R61.30 resistance, and so far holding the R57 old resistance as support. Forecasting a reversal pattern this week. I’m going to wait for a break above R61.30 to start building a position on the stock.
Glencore
The stock found some selling at the top of the current box with a bearish engulfing candle, followed by a bap lower. However, the Friday candle was a reversal doji. Forecasting a 5% rise in the week to retest the R88 level.
Goldfields
The market violated the R157 support a bit but gapped back above the 50 day EMA. The problem with this trade is that it is closely correlated with the price of gold. At the moment gold is range bound. Increasing the likelihood that gold miners will be range bound as well. If the stock breaks above R157 I will start to build a position.
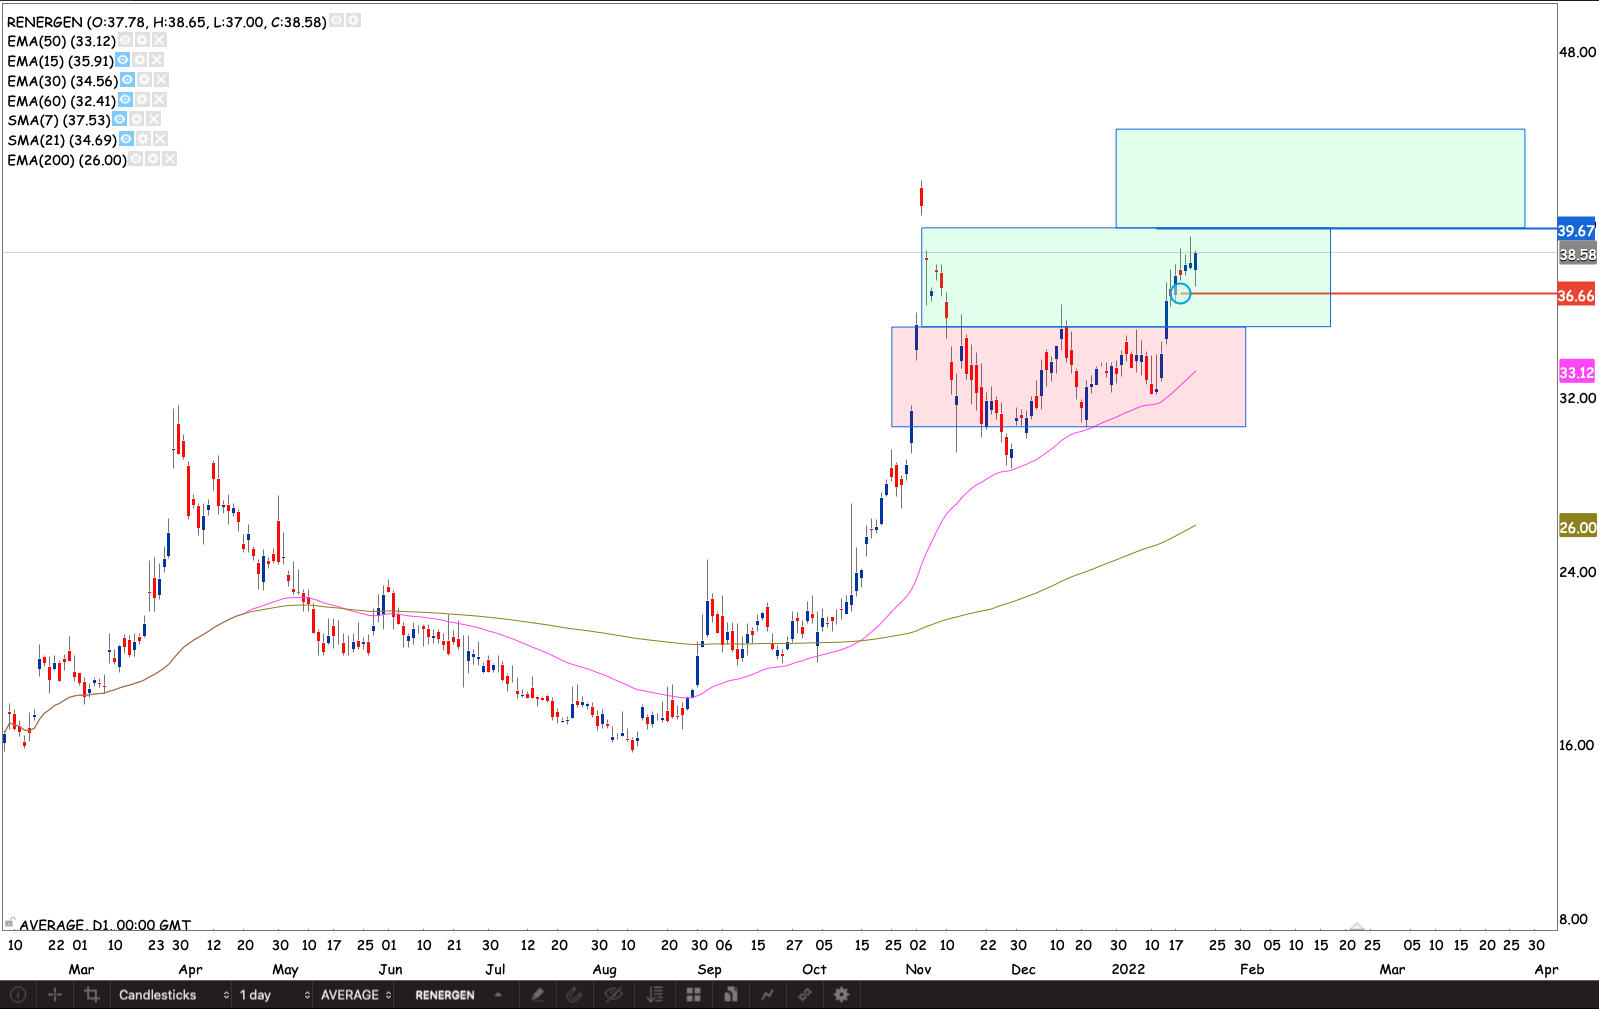
Renergen
Renergen had a great run last year. We had a golden gross, I’ve been looking at the stock for my small cap long term portfolio. The chart looked good so I decided to add to the list of stocks I trade. If the stock enters the higher box above R40 I will build a position.
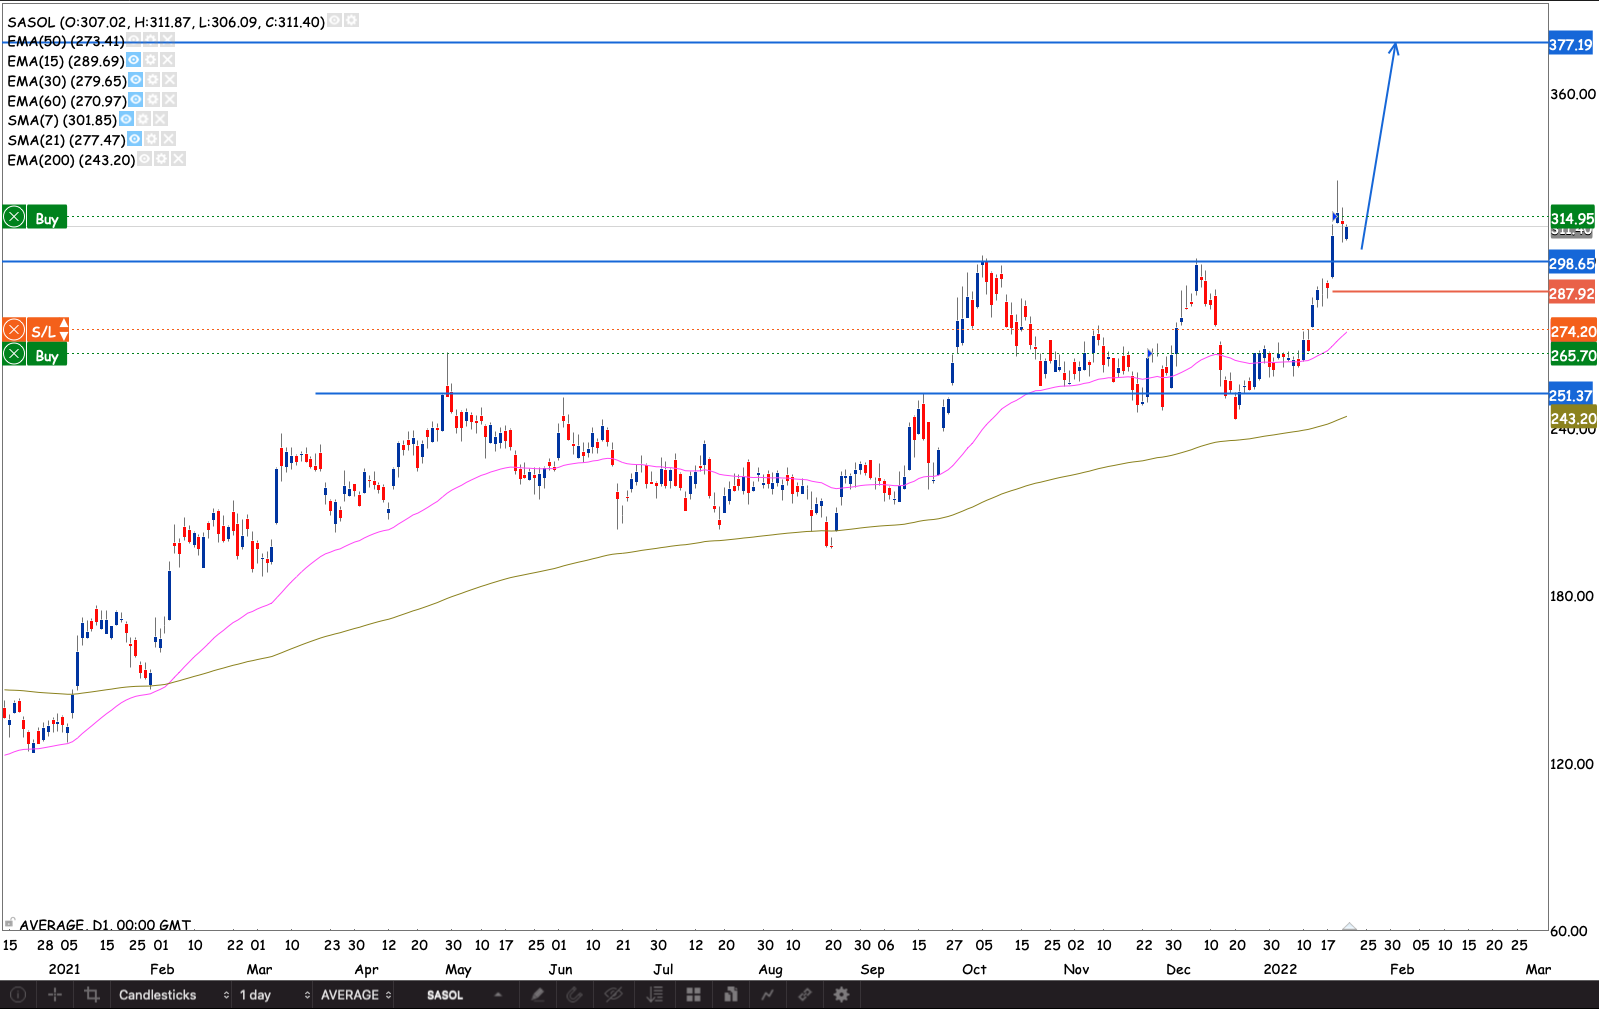
Sasol
The stock came back above R300 for the first time since. Oil prices are surging. I’m forecasting a 21% rally to R377. I will be building my position as the stock moves higher.
Retail
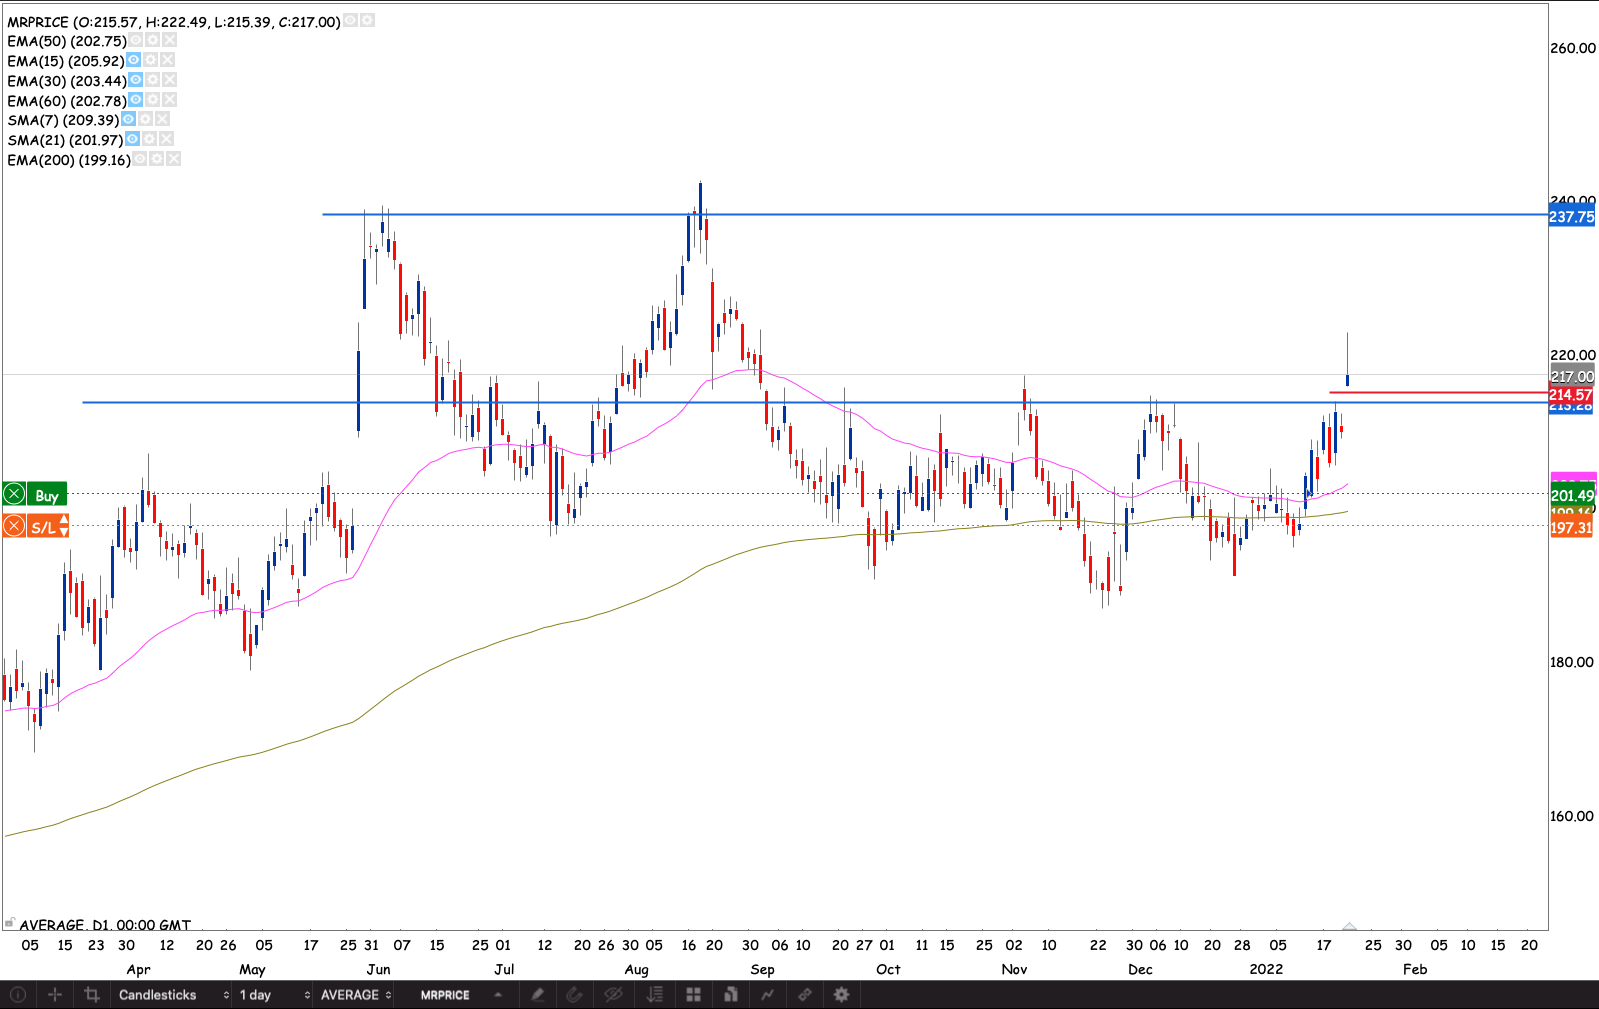
Mr Price
We had a gap and drive breakout on Friday. The kangaroo tail worries me a bit. It could be a false break or at least come to close the gap before running. If it’s a valid breakout. I forecast a 9% rise to R327.
Shoprite
We had a bullish engulfing candle on Friday. Around the 50 day EMA. I’m waiting for a R211 resistance to break. To add to my position.

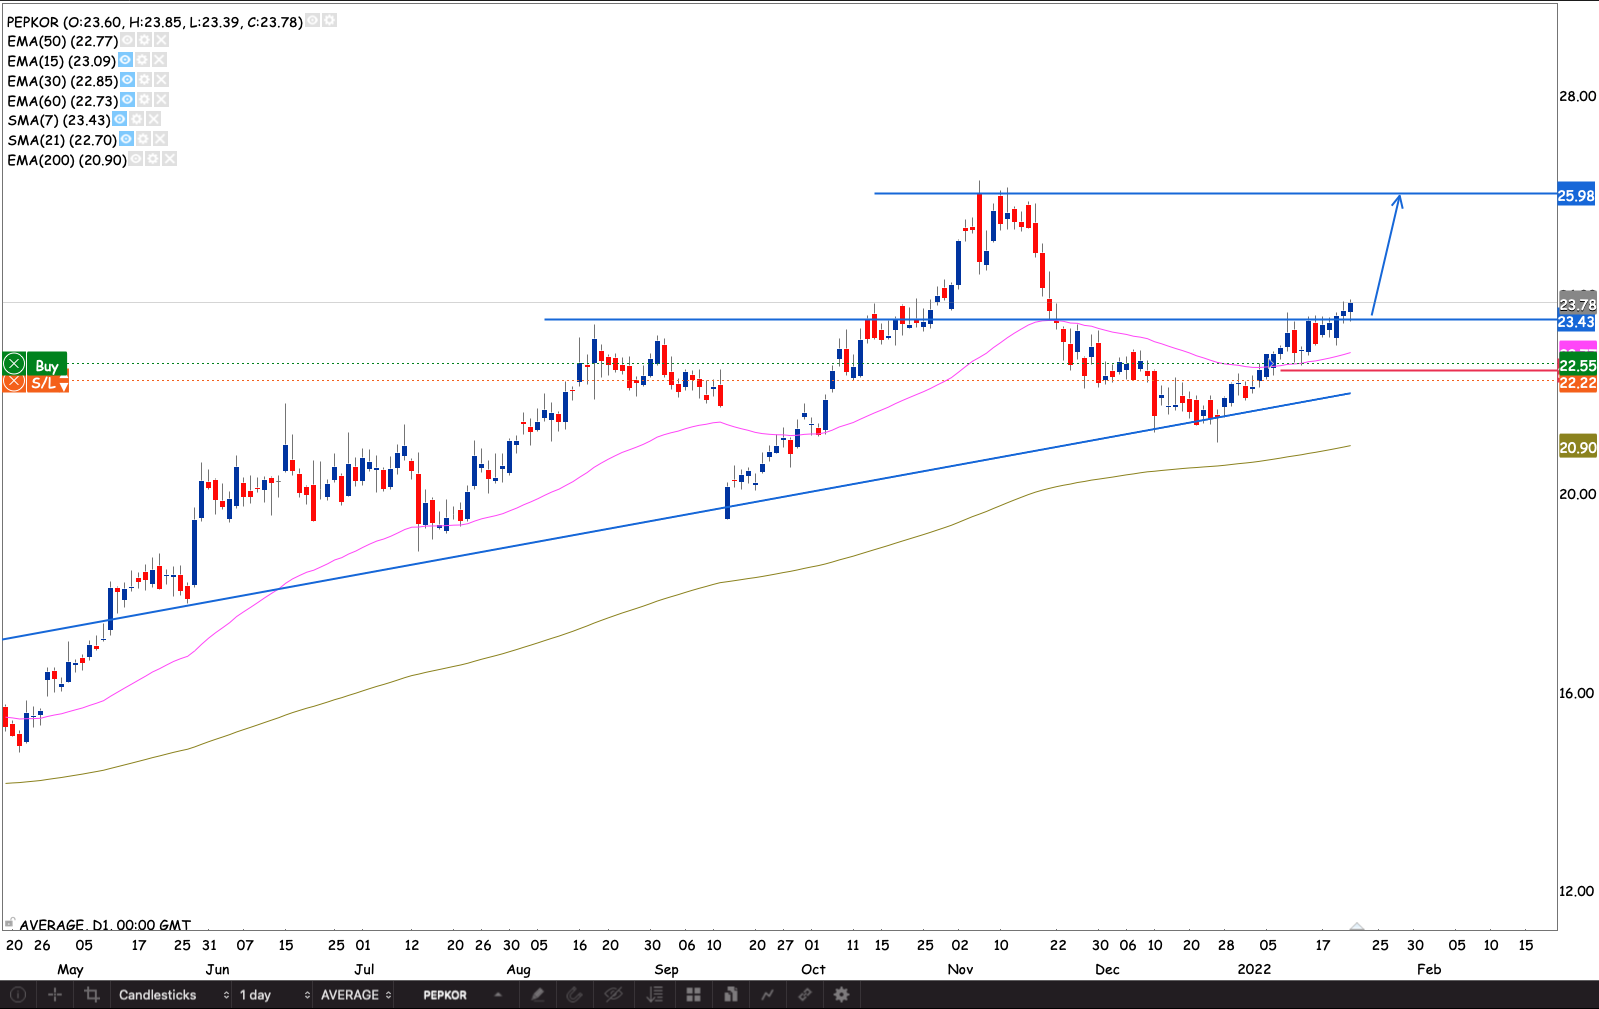
Pepkor
Came back above the 50 day EMA. I believe the stock run up to the R26. I’ll build my position. I’m waiting for a close through R26 to load up on the position..
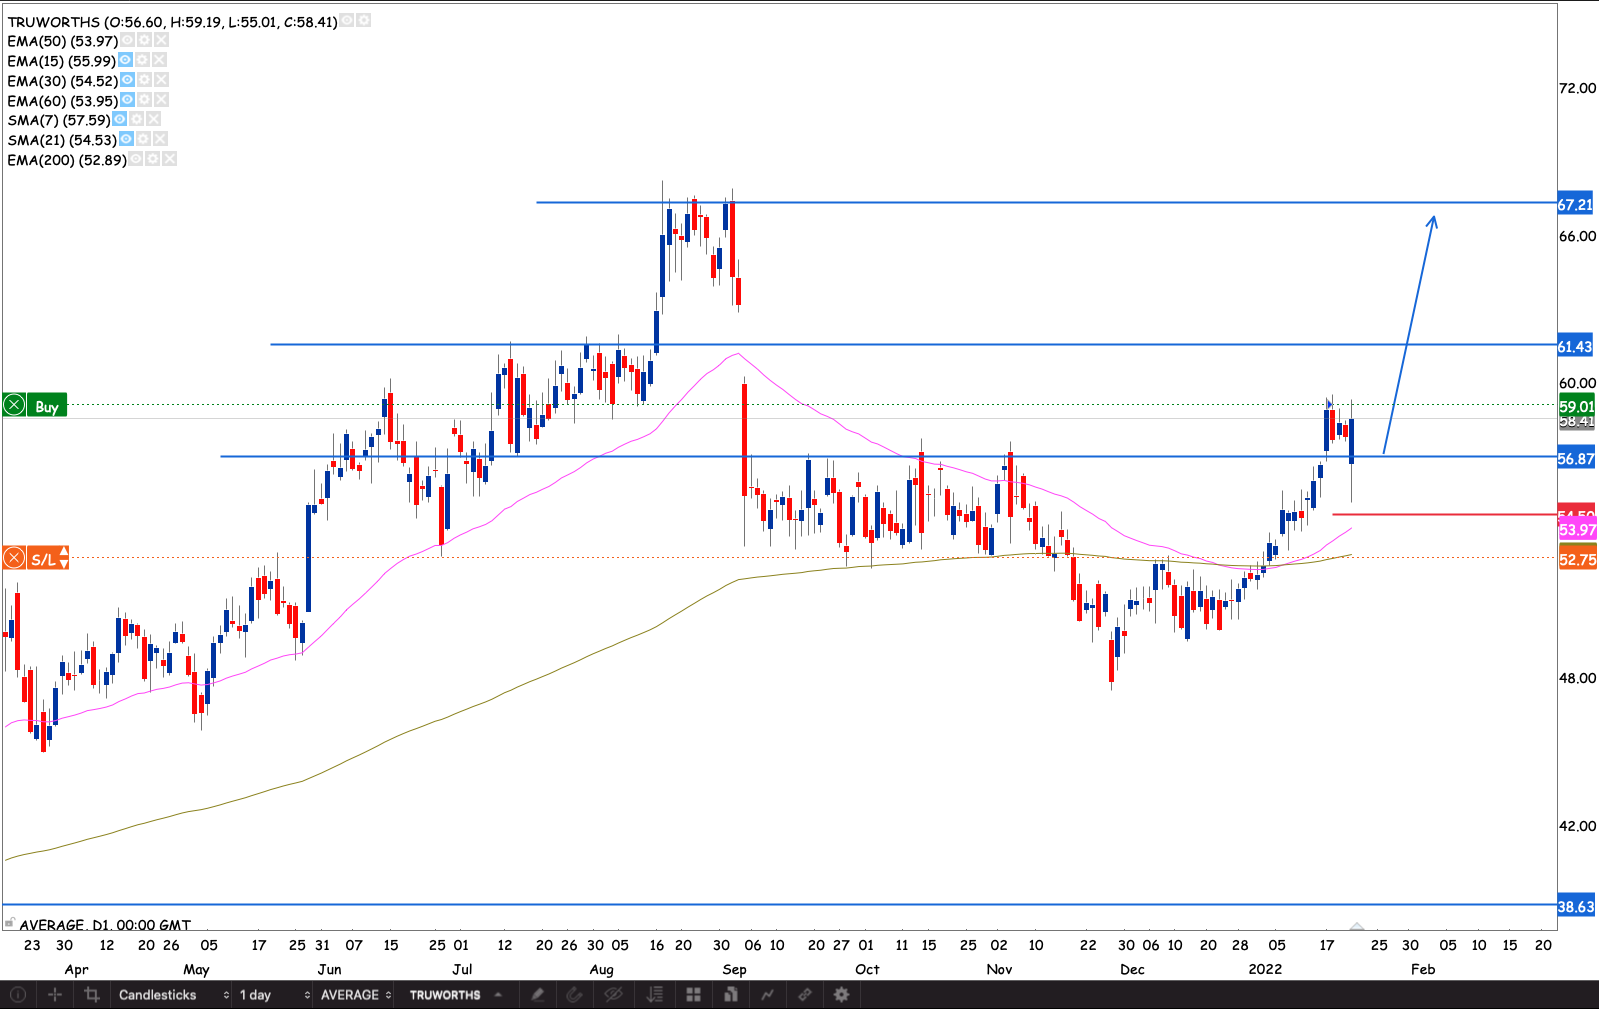
Truworths
The stock did the typical break and retest pattern. Holding strongly with a bullish engulfing candle. I’m waiting to see how the stock will react to the R61.45 level. I think if the stock breaks R67 the stock will surge
Others
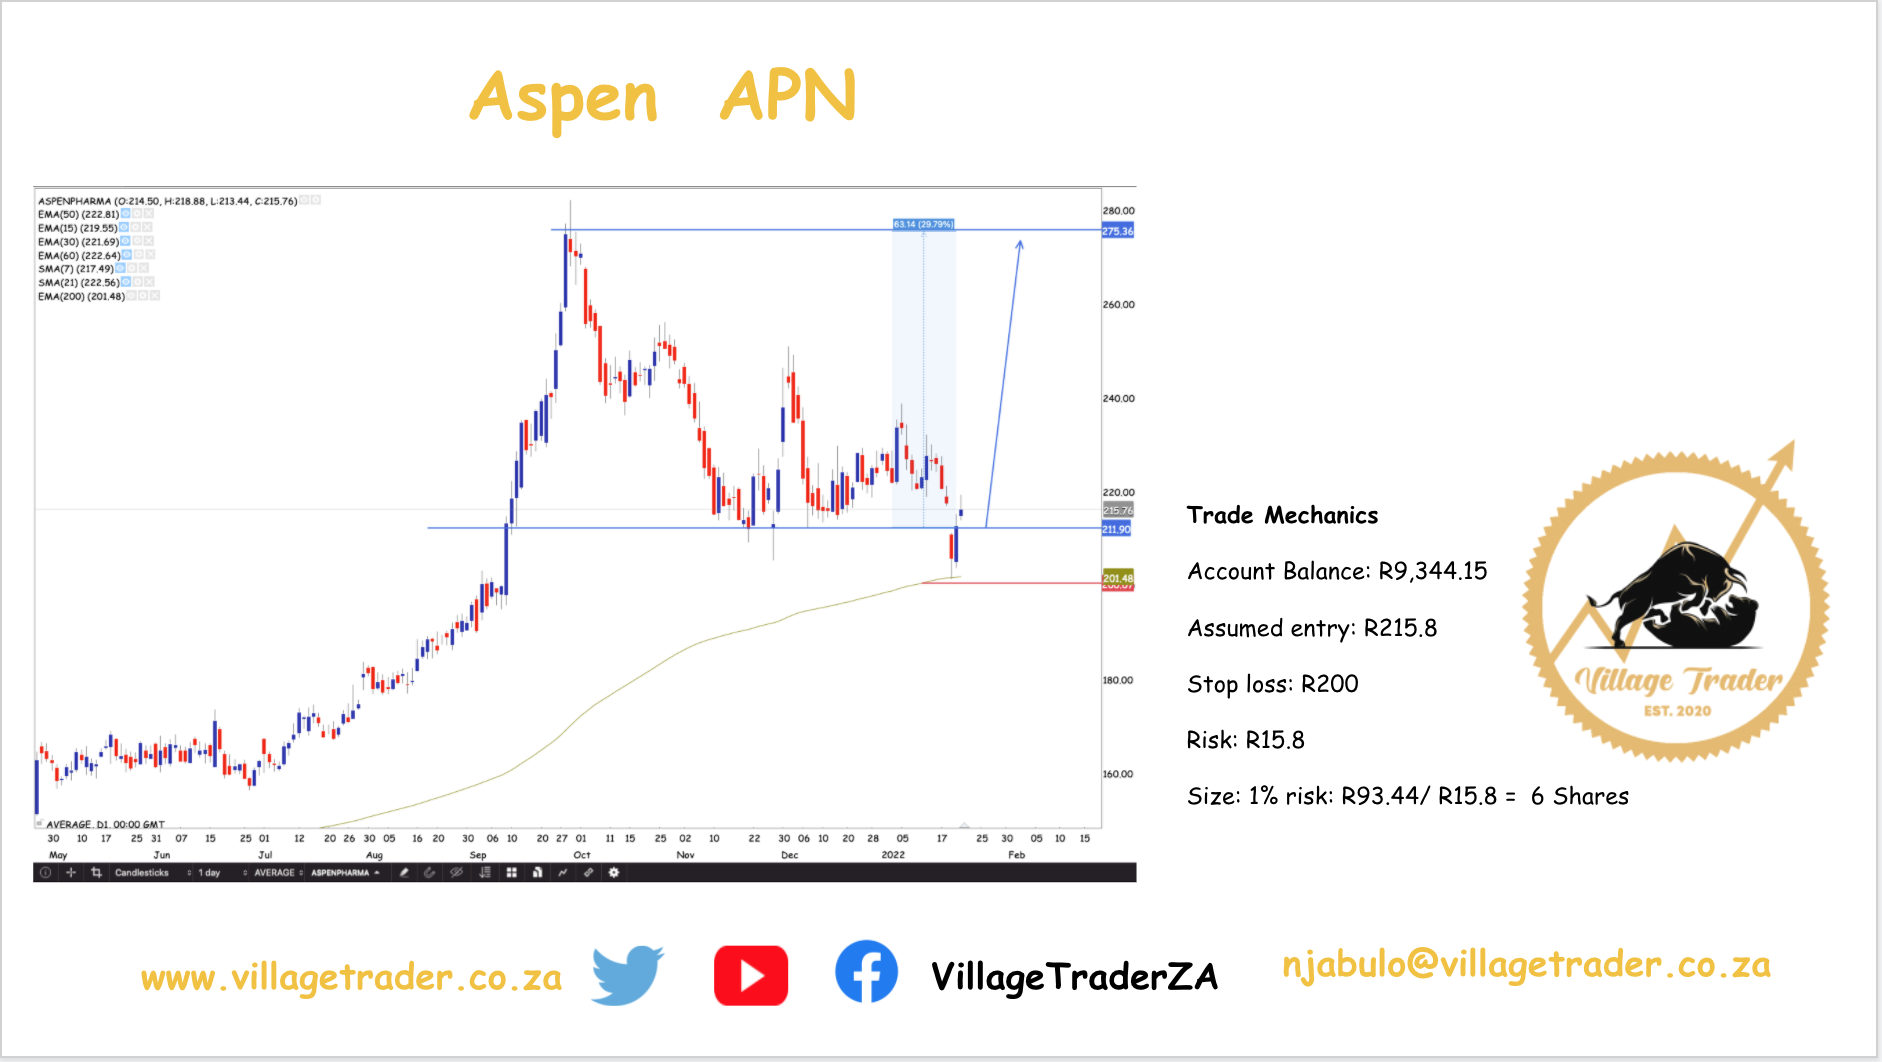
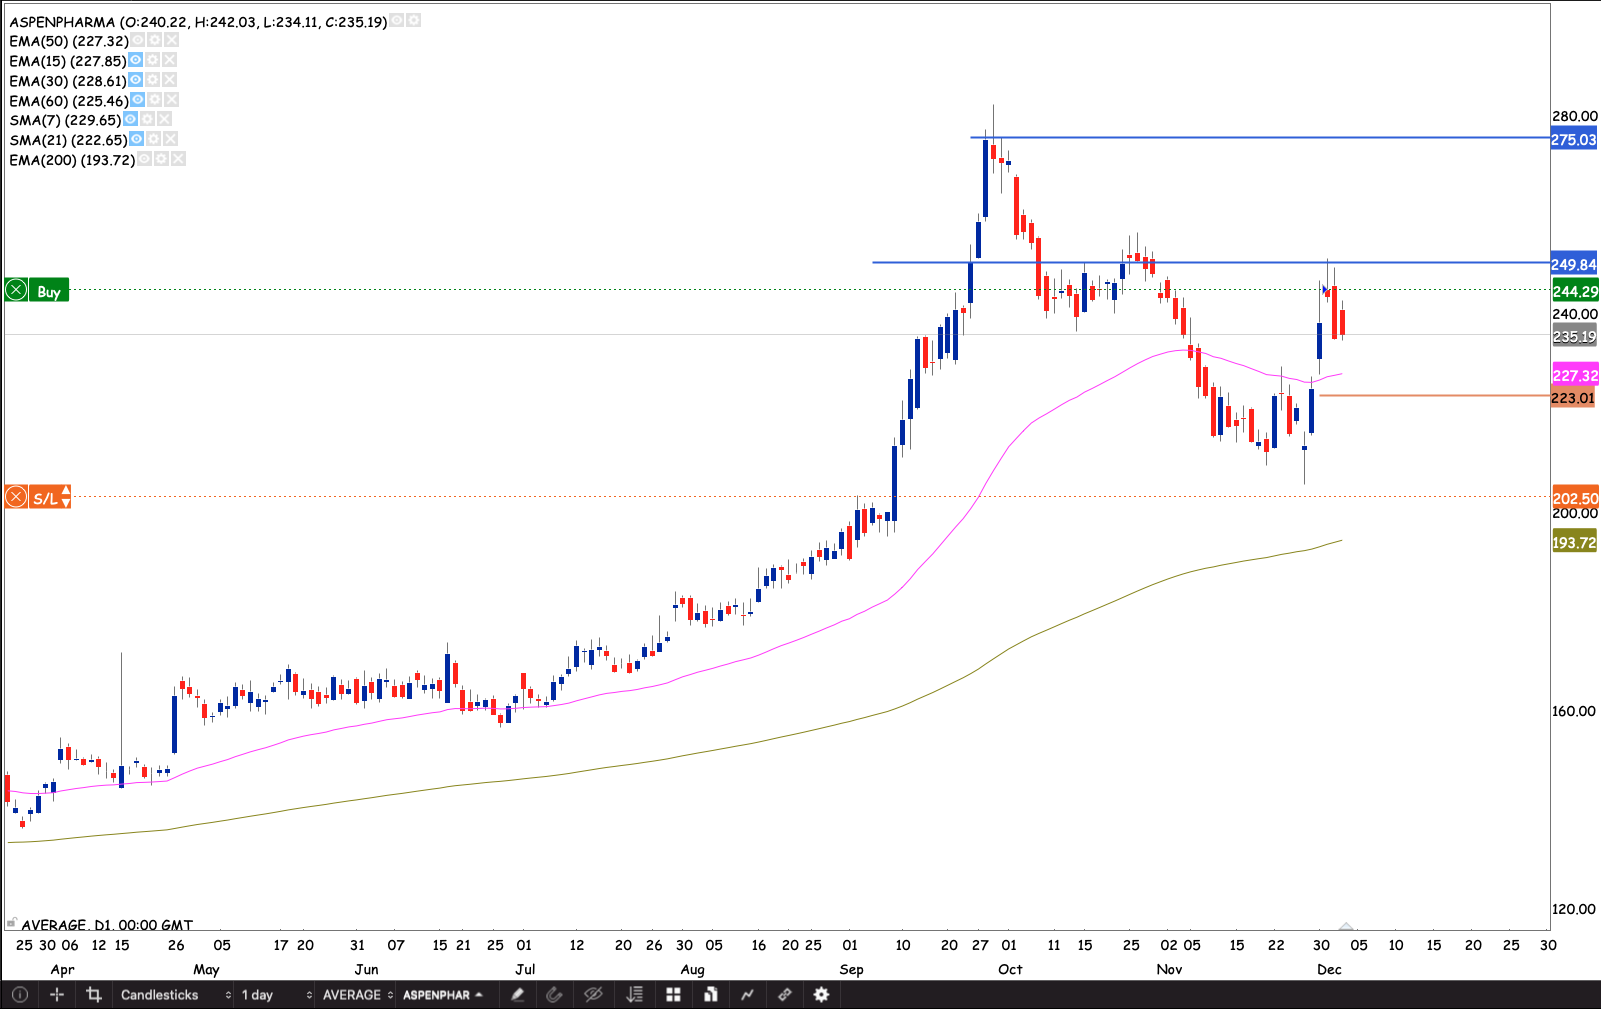
Aspen
The 200 day EMA was like a hot stove for Aspen. Which was followed by a bullish engulfing candle, which confirmed with a green close the next day. This is a support of a 30% wide range. Toppling at R275. I will start building a position at the open on Monday.
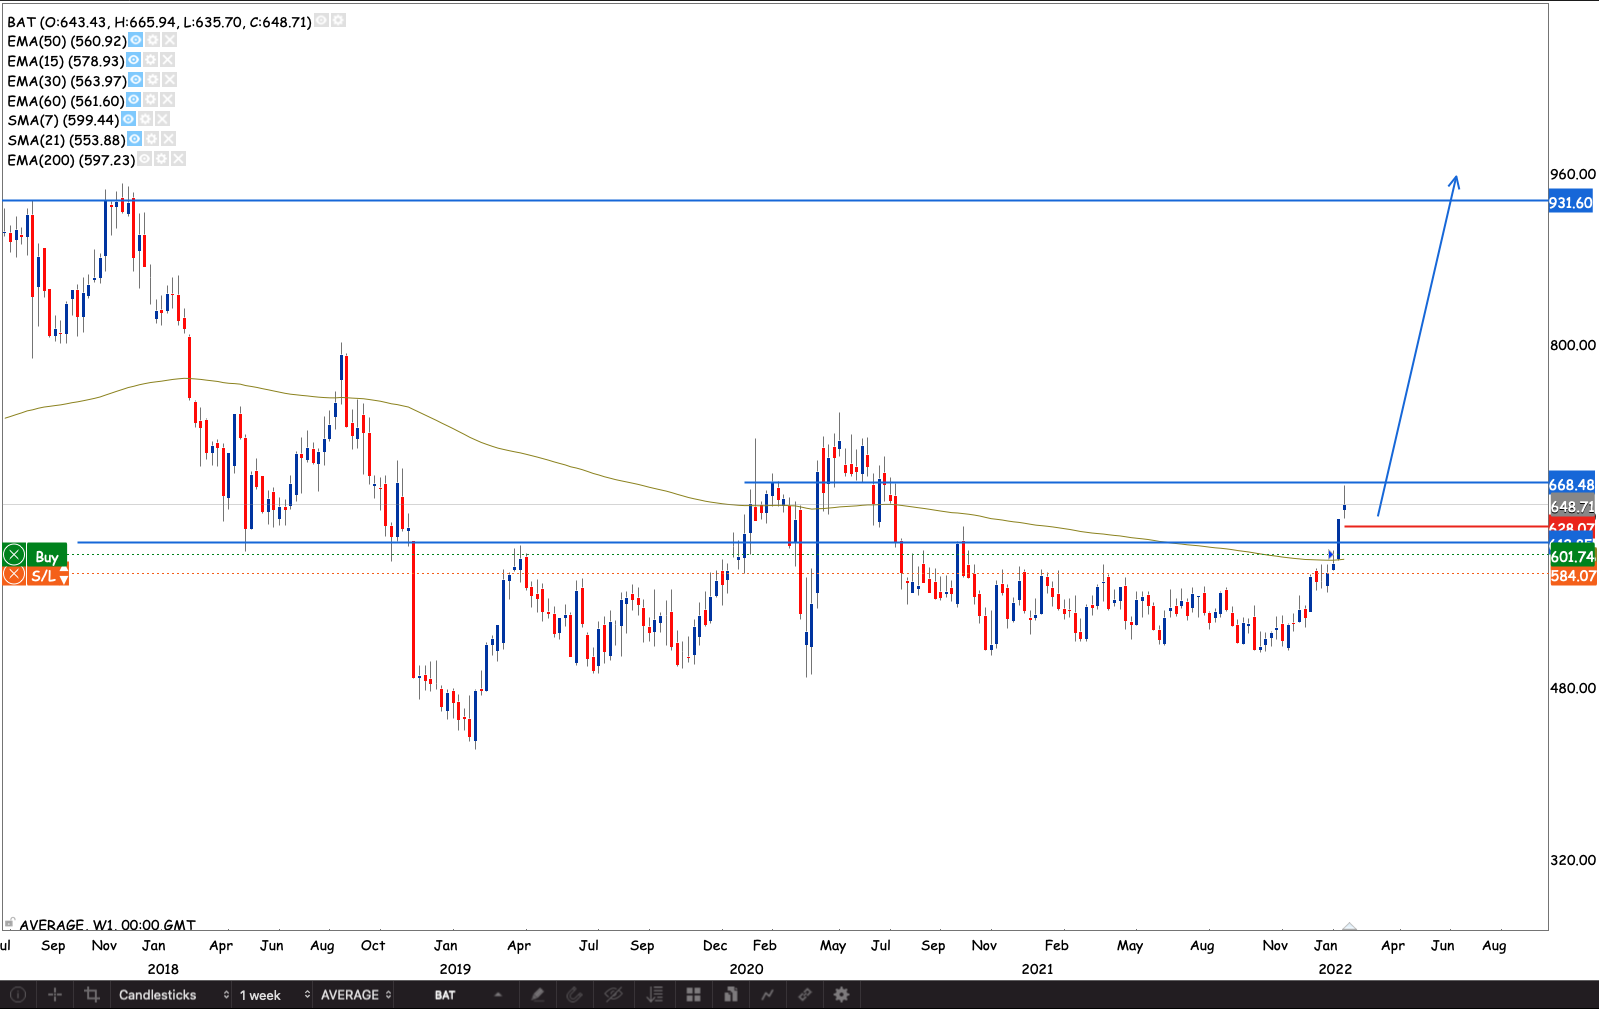
BAT
They woke up from the dead. After being sideways for a long time. Breaking the above the 200 week EMA. The stock continued to make new 52 week highs. If the market breaks above R668.50 I will add to my position.
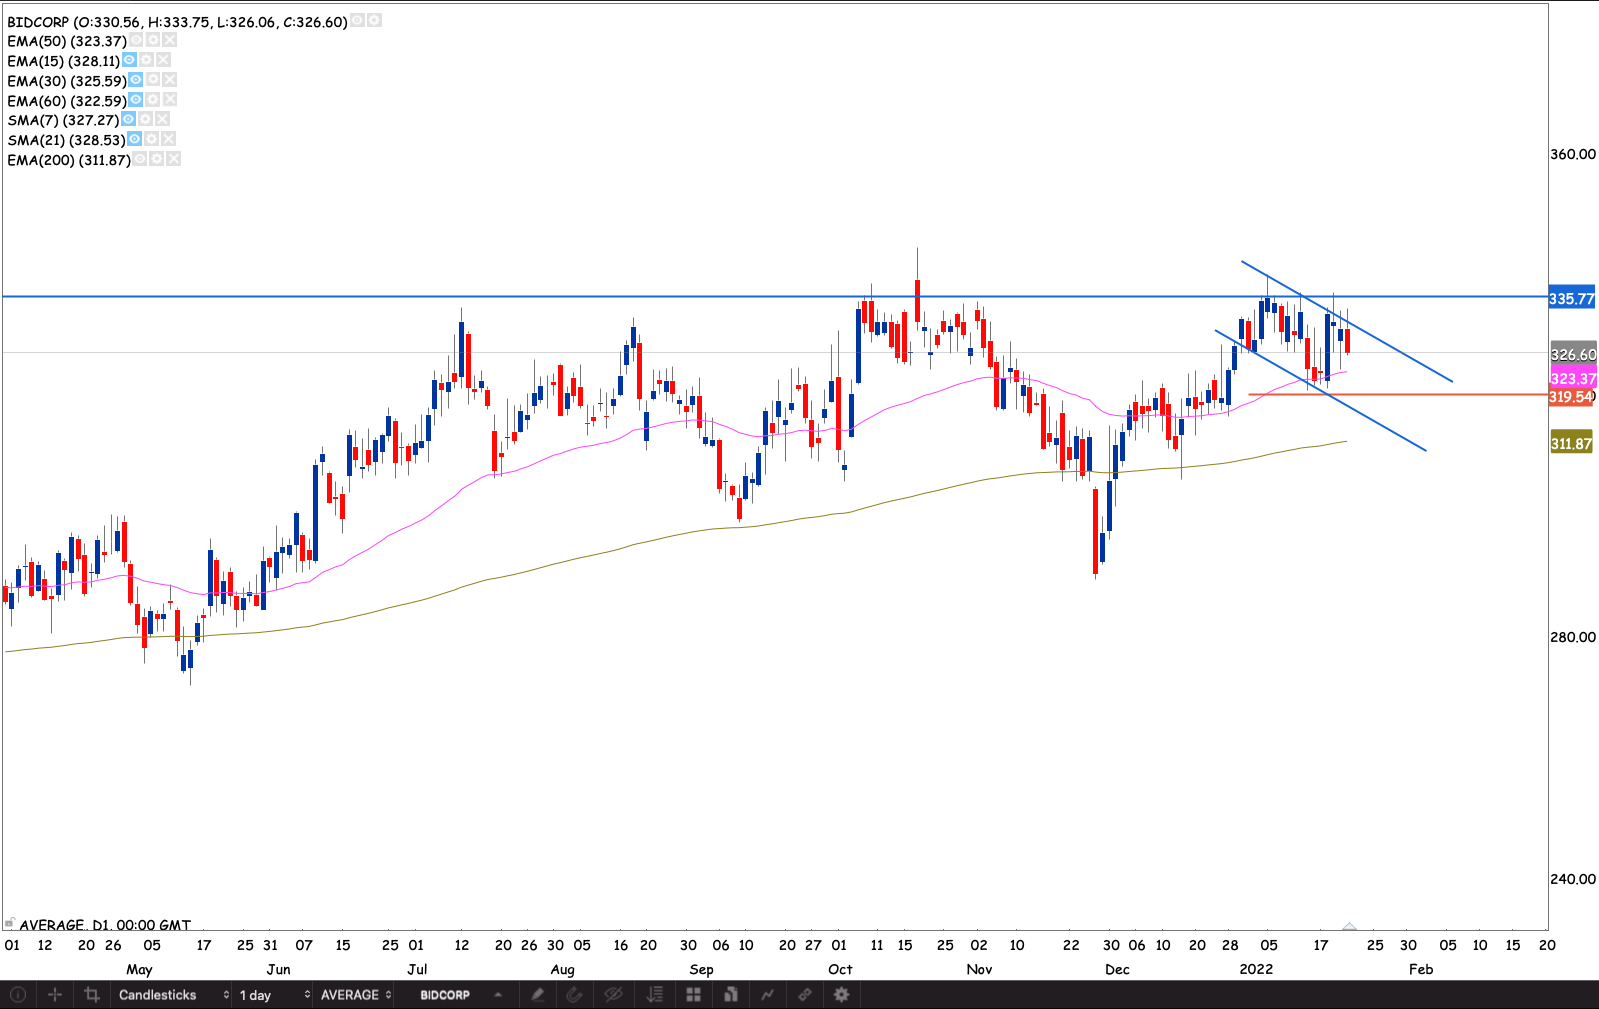
Bidcorp
The buyers held the 50 day EMA, still having a tough time with the R335 resistance. The stock has been making higher lows. If the market breaks R335.77, I will build a position with an inital stop loss at R319.54
MTN
Buyers came in to defend the 50 day EMA. Continuing building the ascending triangle pattern. I’m waiting for a close above R175.35, to add to my position.
Satrix40
The index reverted back to the 15 day EMA closing below it on Friday. Now I’m wait for a buy trigger. Which a close back above the 15 day EMA.
Portfolio Summary on 2 March 2021
Capital invested: R10 303.77
Current Balance: R9 344.15 -9.31%
Current Equity (Balance including paper P&L): R18 727.02 +81.75%
Current P&L : R9 382.87
Equity curve Vs Benchmark (Satrix 40 ETF )
Closed trades statistics and distribution

Open trades statistics and distribution assuming all stops are hit
Thank you for reading and reaching this far. If you have questions or chart requests or want/need someone to bounce ideas off of feel free to drop me an email: njabulo@villagetrader.co.za
]]>
African Rainbow capital
The stock came back above the 200 day EMA for the first time in a while recently. It came back to retest the 200 day EMA on Friday. If the stock breaks R250 there’s a nice place for a R304 target with a R233 just below Friday’s low and the 200 day EMA.
ABInBev
The stock broke the R2016 resistance following a golden cross. I will start to build up a position in the stock with an initial stop loss at R961.46. Putting on a 1% risk
British American Tobacco
The stock made a new 52 week high coming back above the 200 week EMA for the first time In over a year. The stock has been stuck in a range for a while. I started building up a position. Trailing my top at the minute to R284.07 reducing my risk to -0.35%
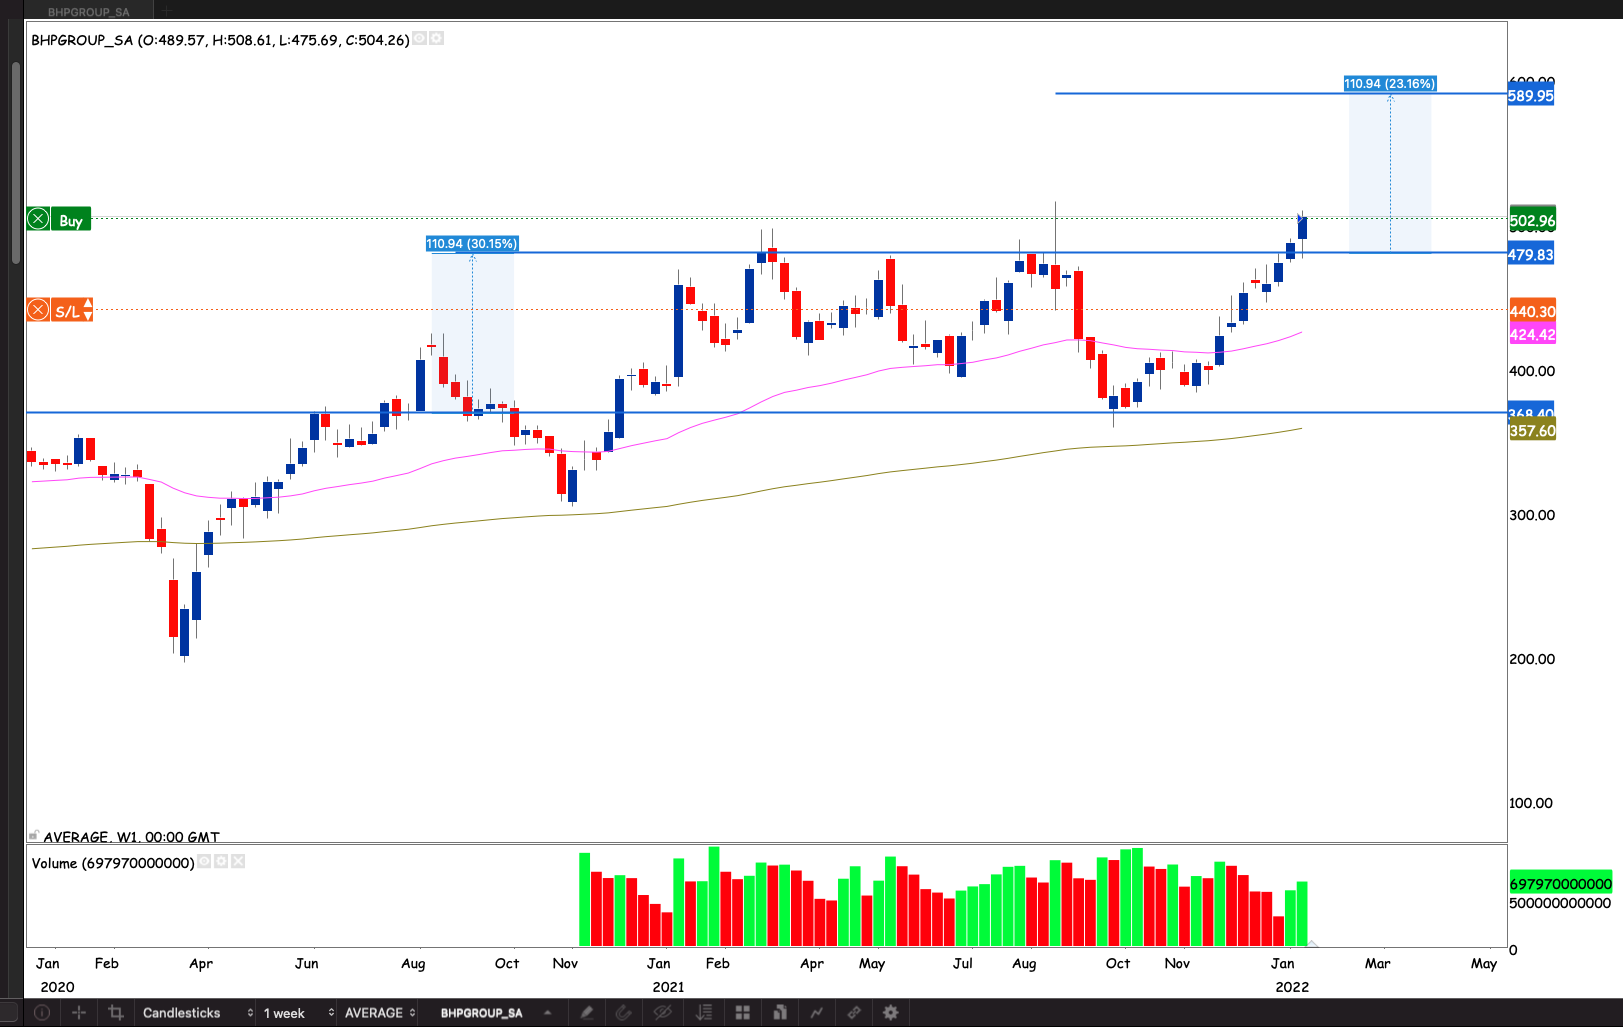
BHP Group
The stock finally broke out of the R368 – R590 range with increased volume. The stock in play for a 23% rise in the short term
Bidvest
There is a nice doji candle bouncing off the 50 day EMA. The stock broke the downtrend resistance. However the R191 resistance held. If the stock break can break the R191.50 I will raise my stop loss to just below the doji candle at R286.30
Capitec Bank
We have a bullish setup at the base of the new box. We had doji with a long tail, followed by a bullish engulfing. Closing the week a new high. I raised my stop loss to R1999.29, push the trade to just above break even at +0.33%
Dischem
Nice ascending triangle pattern. The stock making yet another higher low, bouncing off the 50 day EMA. Waiting for break above the R36.65 top-line.
Glencore
The stock moved to a higher box. Looking well poised to break right through to the R88.30 box. If the market goes to the higher box I will Stop loss to R80.80 and add to the to the position
Investec
We have a bullish reversal setup. With a diji candle followed by a bullish engulfing candle, If we get another green close on Monday 17 January, completing 3 white soldiers pattern. If the stock also makes a new high closing through R90.60. I will my stop loss to between R81 – R85 depending on the price action
MTN
The 50 EAM held support. We have a nice ascending triangle pattern building up with a R175 topline. If we break R175 I will raise my stop loss to R162, just below the 50 day EMA. And add to the position
Shoprite
We have a nice triangle pattern with a R212 topline. If the market break this level I will raise my stop loss to R201 and add to the position
Standard Bank
The stock had a strong rally only to be stopped by the R148 resistance. The market shows its tendency to remember prices. If the market breaks this level I will raised my stop loss to to around R142 and add t o the position
Portfolio Summary on 16 January 2022
Capital invested: R10 303.77
Current Balance: R9 890.63 -4%
Current Equity (Balance including paper P&L): R21 014.6 +139.51%
Current P&L : R11 123.97
Equity curve Vs Benchmark (Satrix 40 ETF )

Closed trades statistics and distribution
Open trades statistics and distribution assuming all stops are hit
Thank you for reading and reaching this far. If you have questions or chart requests or want/need someone to bounce ideas off of feel free to drop me an email: njabulo@villagetrader.co.za
]]>The market had a fairly good start to the year particularly the banks and resources stocks. Opportunities seem to be plentiful is a start the year
With that being said. Here is this week’s stocks in play
Absa
Banks started the year quite strong. Absa breaking into a new box after bouncing off the 50 day EMA. Still keeping my stop loss out of traffic monitoring up and down volatility.

Amplats
The stock has been making higher highs and high lows. Seems to be having a tough time with the R1855 resistance after the golden cross. If the stock breaks the R1934 provides a great entry point.
Aspen
The tug of war between buyers and sellers is still going on, though the battle has moved to a slightly higher battle ground. Showing buyers strength. Still waiting for the break above R250 and the R290

British American Tobacco
The stock has been stuck range for a very long time doing nothing to speak off between the R512 and R590. It started the year by breaking the R590 resistance, and came back to test it and held it. I started building a position in the stock. Waiting for the R634 level to start adding to the position
Capitec
Capitec moved to a higher box on Thursday only just. The boxes are quite wide which makes it slightly harder to effectively hide the stop loss. However the banks started the year moving strongly together which is a good sign for a bullish run in all of them. I will be waiting for the R2341 top of the higher box
Dischem
We have an ascending triangle pattern on the stock. Holding the 50 day EMA. Now waiting for the R35.65 top line resistance to break.
Discovery
We have a massive symmetrical triangle breakout at the back of the a weekly golden cross. The target of the pattern takes it back to the R192 highs. Providing plenty opportunities on the long side on the daily chart.
Glencore
The stock broke out from an ascending triangle pattern at the same time breaking to a higher box. It’s now half way through the current box. Now waiting for the break above R86.40 into a higher box
Investec
A worrisome bearish divergence pattern has formed. This could trigger a consolidation with a test back to the 50 day EMA

MTN
An ascending triangle pattern is forming on MTN. I’m waiting for a close above R175 to add to the position.
Northam Platinum
We had a falling wedge breakout around the 50 & 200 day EMAs after making a higher low. It seems resources stocks are bottoming and looking to turn

Pepkor
The stock saw a 20% correction right to the uptrend support and turned. There’s a lurking resistance/support at R23. A break above it provides a good buy signal.

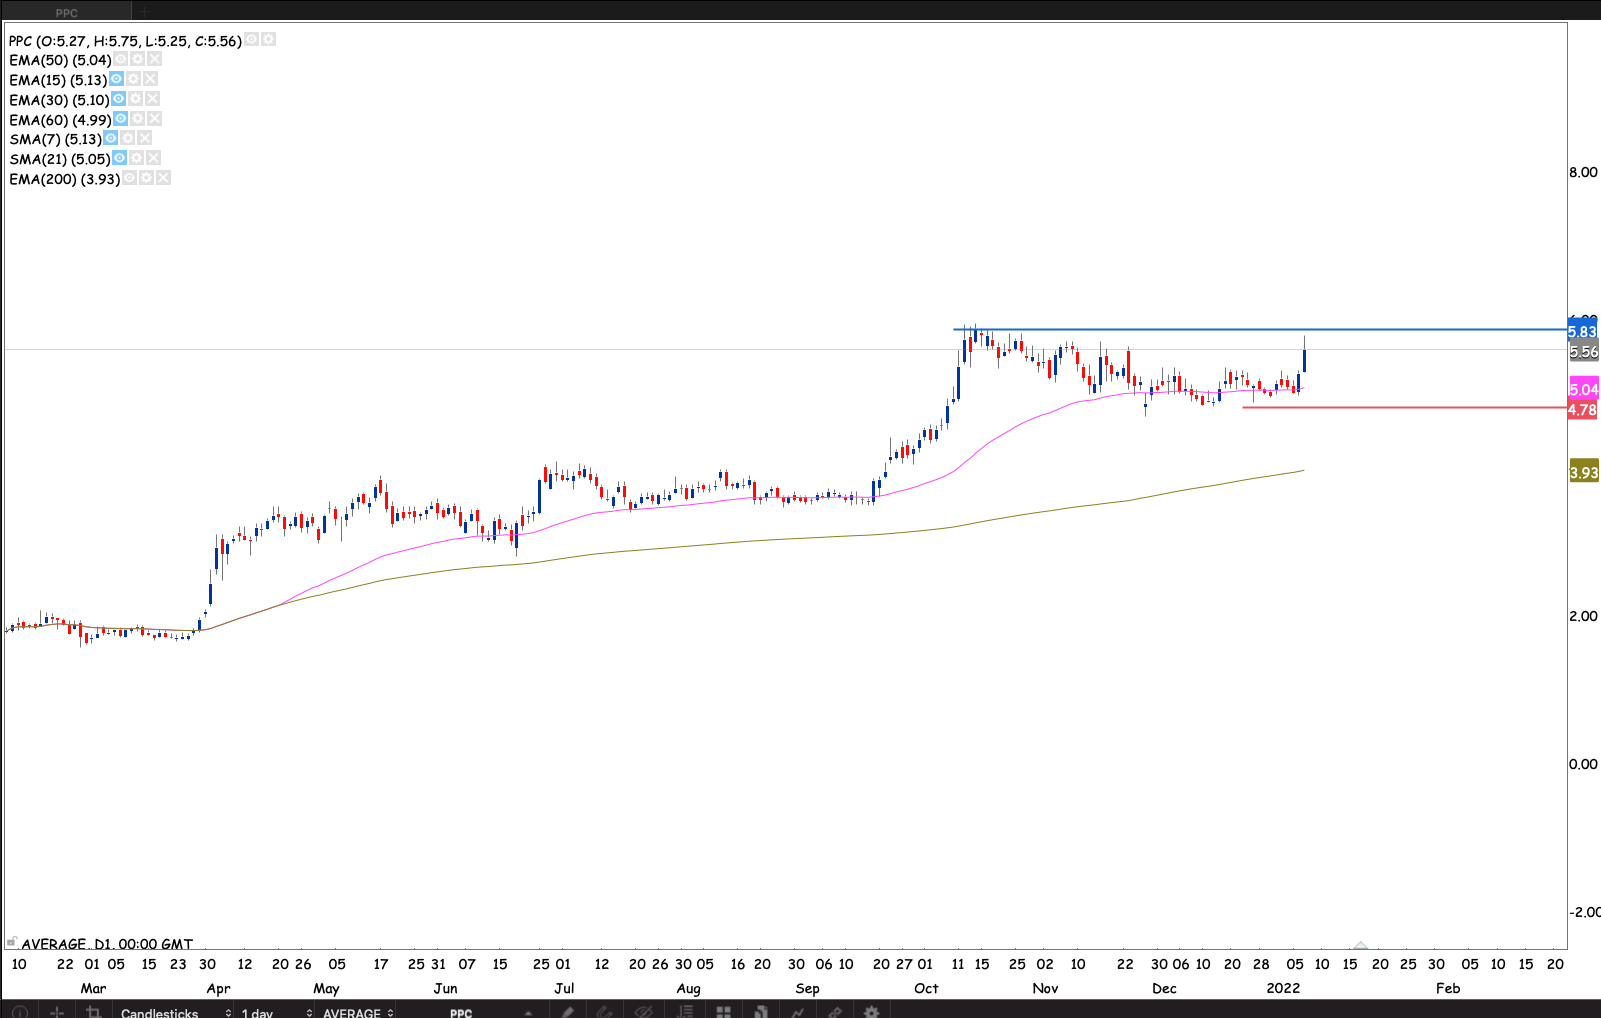
PPC
The stock has been on a nice uptrend. It has been consolidating to around the 50 day EMA. If the stock breaks R583 I will start building a position in the stock
Shoprite
We have an ascending triangle pattern with the topline at R212. Waiting the topline to break to add to the position
A quick note before we get into this week’s stocks in play. This will be the last one for the year. As I will be taking a break from the markets. It will be back in the second week of January. 2021 has been a great trading year for me. Filled with great lessons, fun and luckily profitably.
The biggest lesson has been to trust and believe in myself. But not so much that I think I know the markets. Trade with a plan, discipline to stick to the plan and have the courage to execute on the plan.
Here’s this weeks stocks in play
Absa
Absa gaps and drives strongly on Friday jumping back above the 50 day EMA. Triggering a buy, I will start building up a position with an initial stop loss at R133.25. Putting on a 1% risk
`Aspen
Aspen looks like it’s forming a head and shoulders pattern. We might see it test the 50 day EMA before breaking the R250 neckline. For the R275 target.
Dischem
Dis-chem broke the bullish flag at the start of the week last week. Spent the entire week test and holding the top line of the flag from above. Waiting for a new relative high close above R35.70
Investec
Investec looks well poised for a new high box to continue making new highs. Waiting for a close through the R82.80
MTN
Nice round bottom on the stock. The stock consolidated albeit not enough to close the gap . The stock could be setting up a cup and handle pattern. Waiting for a close through the R169.40

Sappi
The stock has been forming a symmetrical triangle pattern. Looked it was going to a make a new high relative high close, but closed with a bearish looking candle. Struggling to break out. If we can get a closed above Friday’s close I will start building up a position on Sappi
Portfolio Summary on 8 December 2021
Capital invested: R10 303.77
Current Balance: R9 460.2 -8.19%
Current Equity (Balance including paper P&L): R20 504.54 +99%
Current P&L : R11 044.34
Equity curve Vs Benchmark (Satrix 40 ETF )
Closed trades statistics and distribution
Open trades statistics and distribution assuming all stops are hit
Thank you for reading and reaching this far. If you have questions or chart requests or want/need someone to bounce ideas off of feel free to drop me an email: njabulo@villagetrader.co.za
]]>
Let’s look at this weeks stocks in play
AmpPlats
The Head & Shoulders break is often followed by a re-test back to the neckline before taking. Such was the case this past week on ApmPlats closing the week off with a couple of dojis right at the neckline. Providing a good buy opportunity with a R1922 target with a tight stop loss just below the 200 day EMA. For a 5:1 Risk Reward ratio.
Anglo
Anglo retests the baseline of the ascending triangle breakout. Closing above the 200 EMA on Friday with a doji candlestick. Proving a good buy opportunity with a tight stop loss just below the 200 day EMA around R573.

AVI
Another delisting may be on the cards. The owners of Oreo biscuits and Cadbury’s chocolate, Mondelez. Are said to be lining up a bid offer for AVI. Market liked the news on Friday, albeit holding the R89 resistance. Looking for a close through the R89 resistance to raise my stop loss to just below the 50 day EMA and below Friday’s low.

DRD Gold
Gold stocks are showing signs of turning, helped by the bullish price action of gold. DRD developing an inverse Head & Shoulders pattern. With 15.57 serving as the neckline. With a tight stop just below the 200 day EMA at R14.30 for a R19 target.

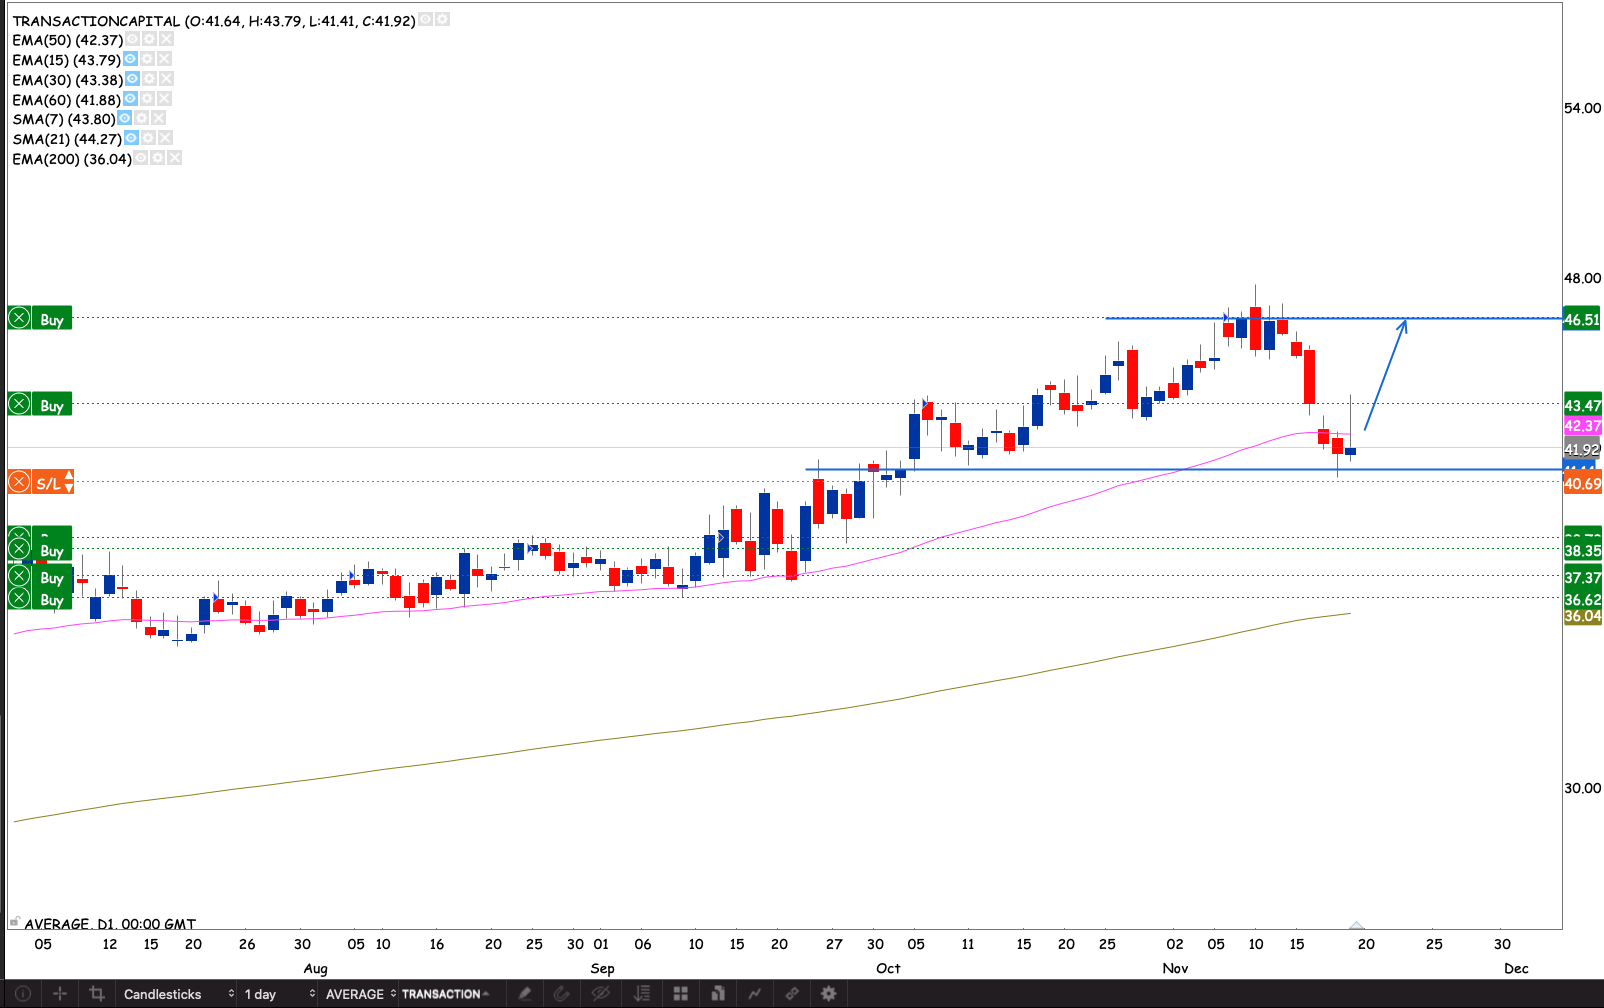
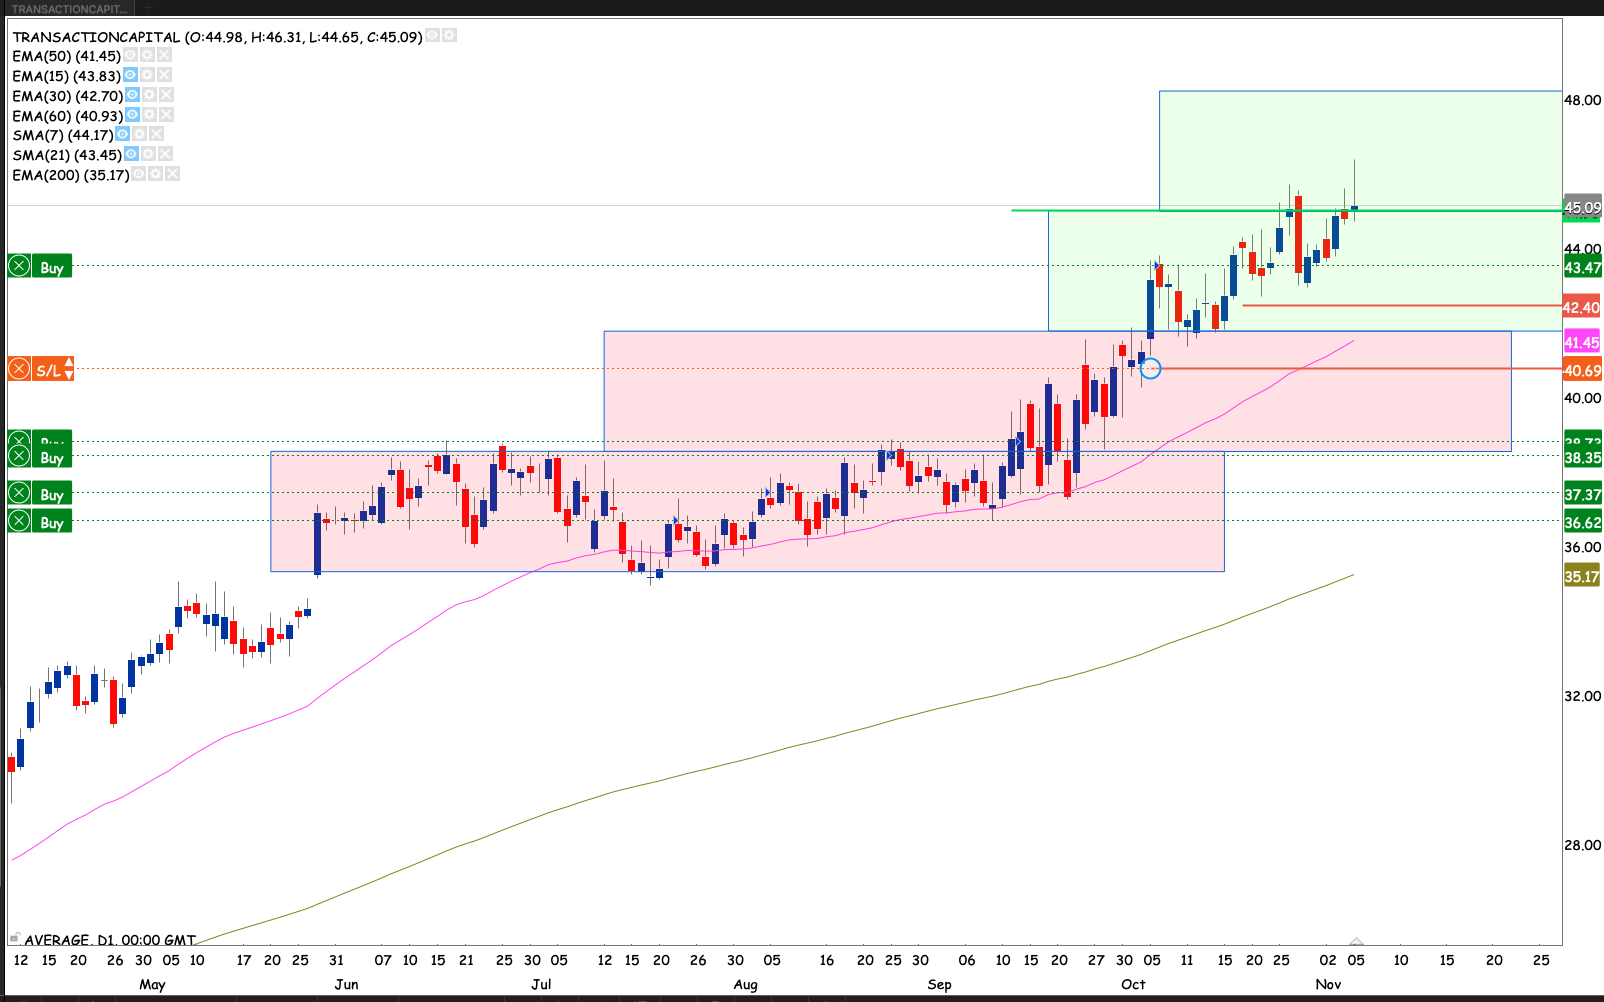
Transaction Capital
The stock came bitterly close to stopping me out on Thursday. Despite coming with strong results the market sold the stock off. We had a bullish inverted hammer candlestick on Friday around the 50 day EMA. Let’s see if we are going to get a green close. Then we can watch if the market will remember the R46.50 price.
Portfolio Summary on 21 November 2021
Capital invested: R10 303.77
Current Balance: R9 759.67 -5.28%
Current Equity (Balance including paper P&L): R18 707.46 +81.55%
Current P&L : R8 947.79
Equity curve Vs Benchmark (Satrix 40 ETF )
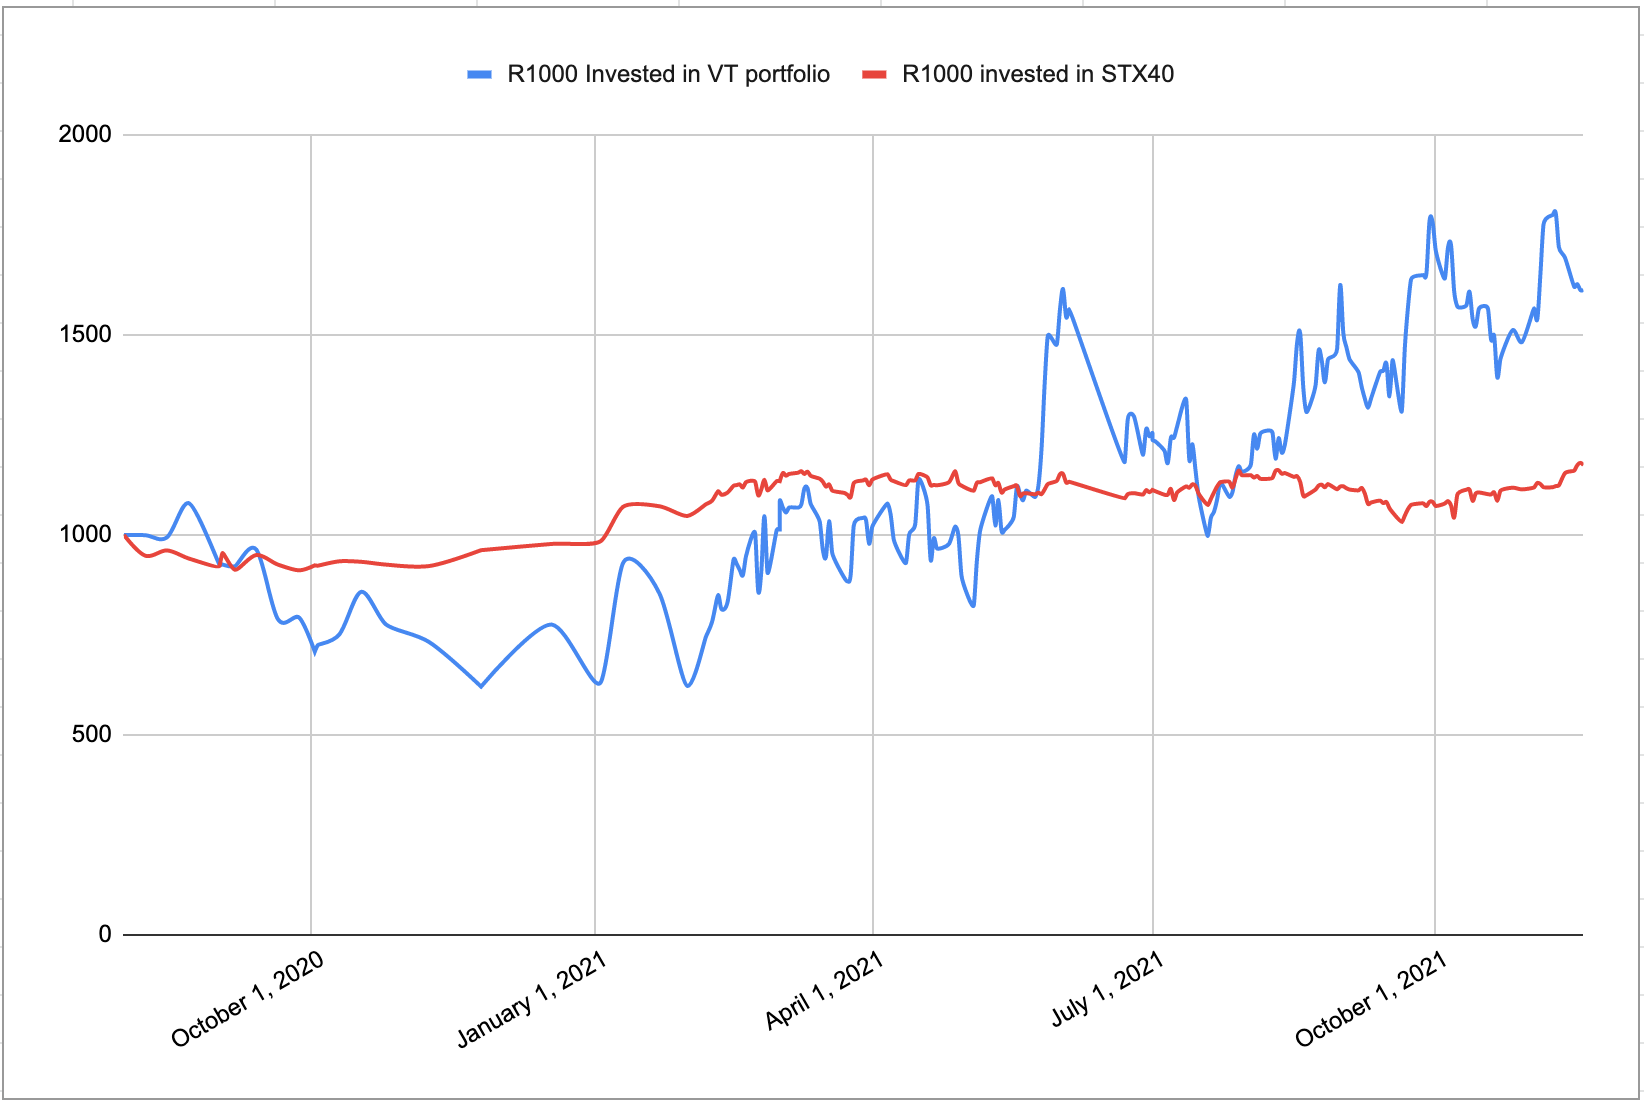
Closed trades statistics and distribution
Open trades statistics and distribution assuming all stops are hit
Thank you for reading and reaching this far. If you have questions or chart requests or want/need someone to bounce ideas off of feel free to drop me an email: njabulo@villagetrader.co.za
]]>The market came back alive. We saw a few stocks making big moves this past week. Market looks like the buying will continue into the coming week. The top40 index doesn’t seem to budge. Being dragged by the big miners & Naspers. Opportunities are sitting outside of the top 40 at the moment or at least at the tail end of the index.

Let’s look at this week’s stocks in play
Capitec
Old support was pierced but was held as the stock closed just below the old support. The price preceding price action does however suggest that the stock was perhaps saved by the bell on Friday’s close. If the stock breaks the old support. What triggers a buy with a short term target at R1909, and a stop loss just below Thursday’s doji. However I’m expecting the stock to perhaps come back to retest the 50 day EMA before breaking.
Richemont
Darvas’ boxes are stacking up again on Richemont. The stock power through the R183 – R198 box tested the doors of the higher box slightly on Friday but closed just within the current box. If the stock jumps to the higher box I will add to my position and raise my stop loss to just below the R189 old resistance. I’m expecting the stock to retest the R198 and hold it as support. Before breaking to the higher box

Clicks
We still have a tug of war around the 50 day EMA but the stock staying on the bullish side of the moving average. Staying around the buy area. I have a short term target of R197 and R307 with a stop loss between R266 and R281. I have mine at R266.30

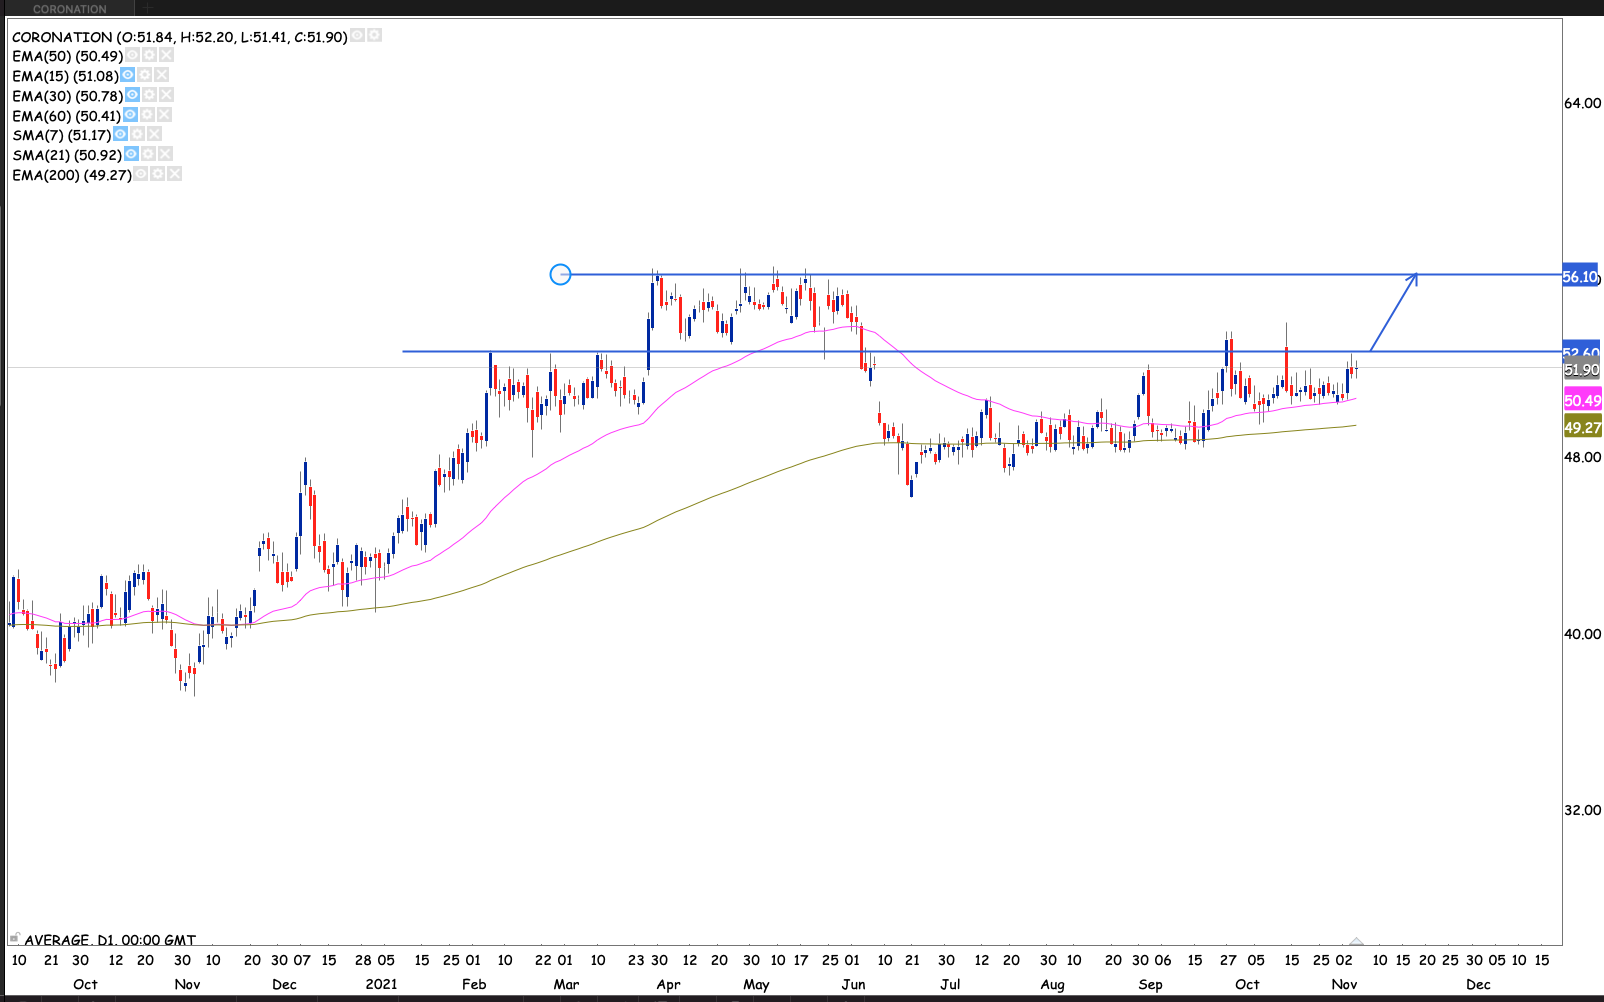
Coronation
Buyers seem to be winning the war around the 50 day EAM. The stock staying on the long side of the moving average. Waiting for a break out above R52.60 with short term target at R56 and a stop loss at just under R50
Dischem
The company published interim results. HEPS up 35% and they brought back dividends. The market loved the results. The powered through a couple of boxes. For now I will wait for a close above Friday’s close. We we get a close another green close I will raise my stop loss to R33.57 and add to the position

Distell
Looks like I’m gonna have to wait a little longer for the R190 breakout. As the stock looks like it’s building an ascending triangle pattern. Held the 50 day EMA this past week holding the support slope. There’s a long short term trade with a tight R177.50 stop loss and a R190 target or hold part of the position waiting for the R190 break out

Foschini
The stock is starting to look slightly strong. Buyers look like they are coming back to the market. The R125 old resistance held so strong it was only tou1hat’s a buy trigger with a R125.50 stop loss and a short term target at R161

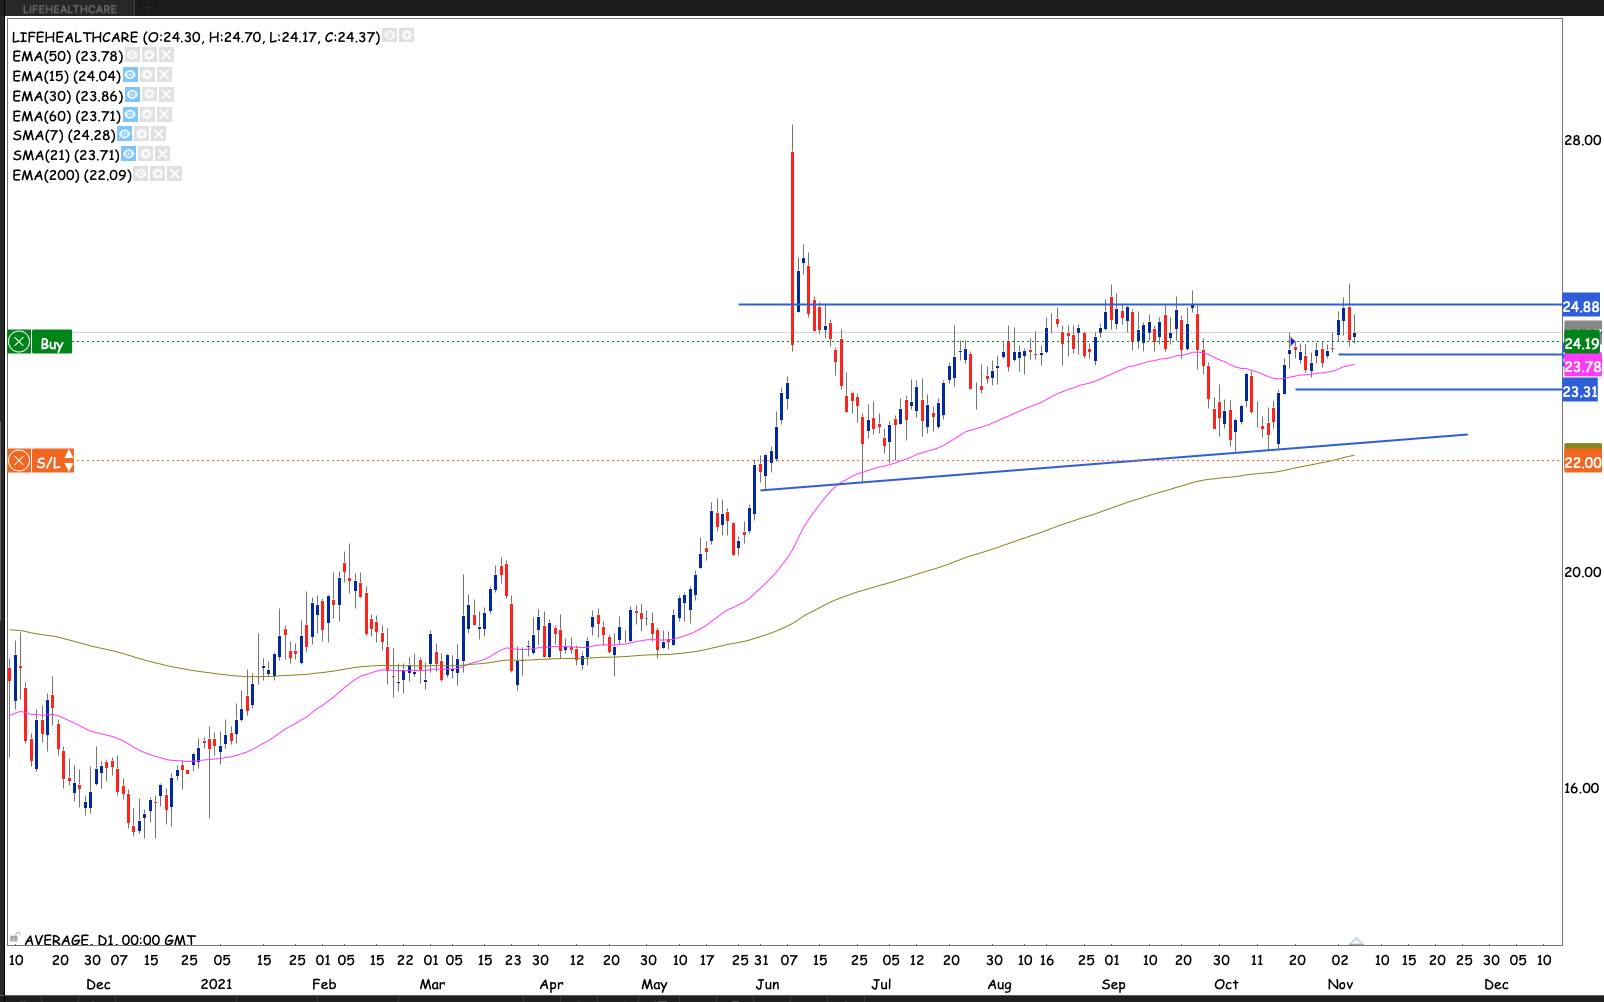
LIfe health care
The R24.90 resistance proves to be quite resistant. Albeit remains bullish looking like a crouch before a jump. If/When the R25 close I will raise my stop loss to R23.30 and add to my position
Mediclinic
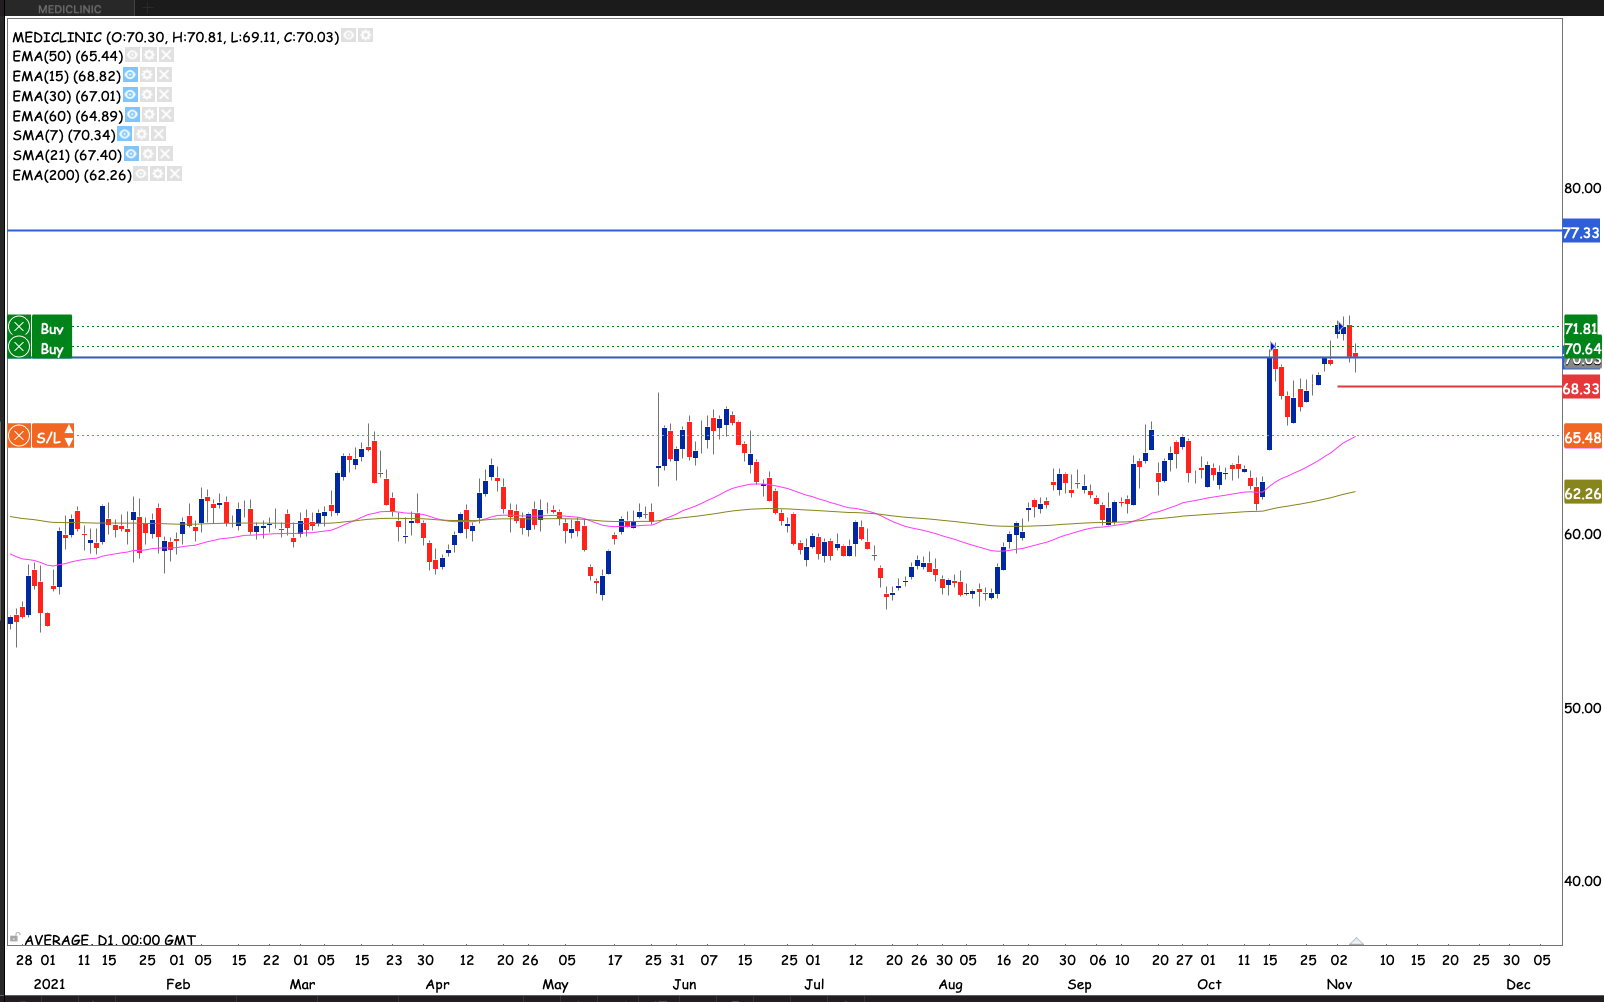
The stock came back to test the old resistance. So far its holding. With a doji on Friday. Providing a buy opportunity. Although waiting for a green close above the high of the doji. There’s a long short term trade with a R77 target and a R68 stop. I will however wait out for a close through the R77 old resistance. Before raising my stop loss to R68
MTN
The stock hit the ascending triangle pattern target within a day of the trigger. Lots of updates coming from the company, the market loving all of it. I will now waiting for a close through then I will raise my stop loss to R151.90 which will officially make MTN my biggest winner from jumping Distell. As my profit will rise to +95%
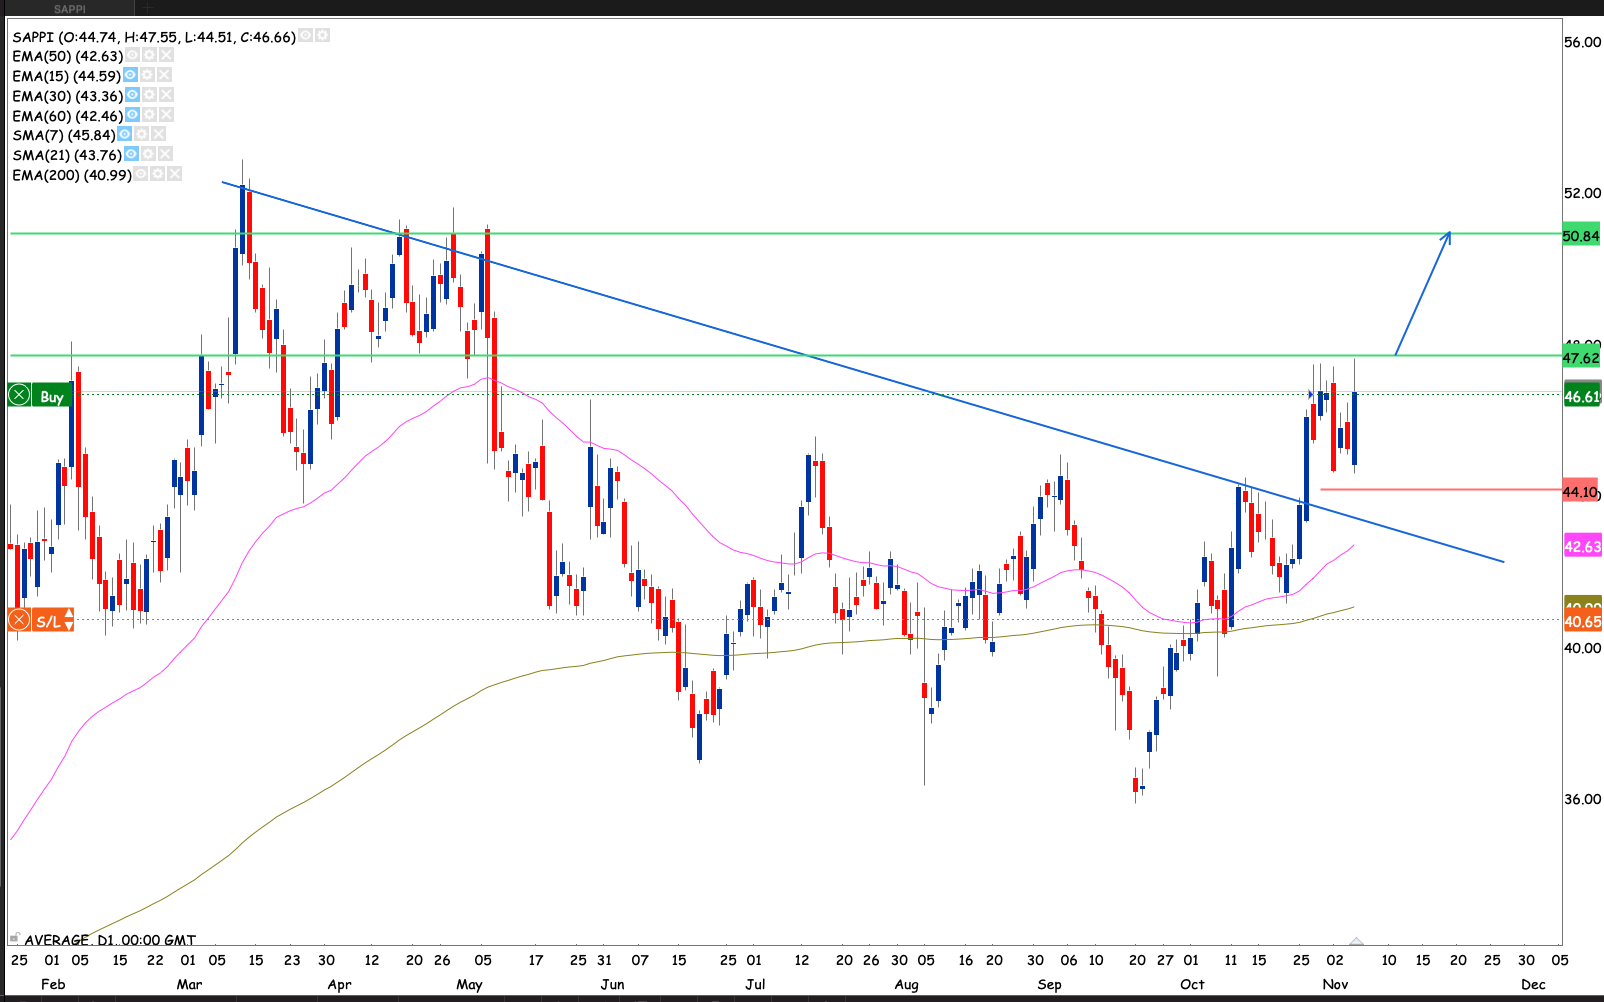
Sappi
The stock took out the downtrend resistance line. Currently floating mid with a short term consolidation. Testing the R47 resistance. Friday closed with a bullish engulfing candle. Increasing the R47.60 resistance being taken out. At which point I will raise my stop loss to R44 and add to the position. Short term target at R50.80
Shoprite
Shoprite moved to the higher box on Thursday. I raised my stop loss to R178 just below the 50 day EMA. The stock came to test the base of the new box and held it. We don’t know if it was on its way back and it was saved by the bell. Remains in the buy zone for a longer term hold. The stock broke out at a long term base.
[Weekly chart]
Telkom
The stock had a strong bullish break showing the 200 week EMA some tail lights. I have a target at R81 with a stop loss at R49.60. The target will take an age to get there but looks like a target the stock can easily reach.
Transaction Capital
The stock moved to the higher box slightly and created a worrying doji, but a new high close is more important information for me. I cautiously raised my stop to R40.69 a fair distance away below the 50 day EMA . I will add another 1% risk to the position. Raising my stop loss bags a +3.68% profit
Vodacom
The stock re-broke the R138 resistance after violating from above Only to hold the support of the up trendline. The stock is back above the 50 day EMA. I will rebuilding my position in the stock with an initial stop loss at 133.90
Portfolio Summary on 2 March 2021
Capital invested: R10 303.77
Current Balance: R5 575.73 -45.89%
Current Equity (Balance including paper P&L): R21 149.84 +105.26%
Current P&L : R15 574.11
Equity curve Vs Benchmark (Satrix 40 ETF )
Closed trades statistics and distribution
Open trades statistics and distribution assuming all stops are hit
Thank you for reading and reaching this far. If you have questions or chart requests or want/need someone to bounce ideas off of feel free to drop me an email: njabulo@villagetrader.co.za
]]>