Shopping list 5 November 2021
Barloworld

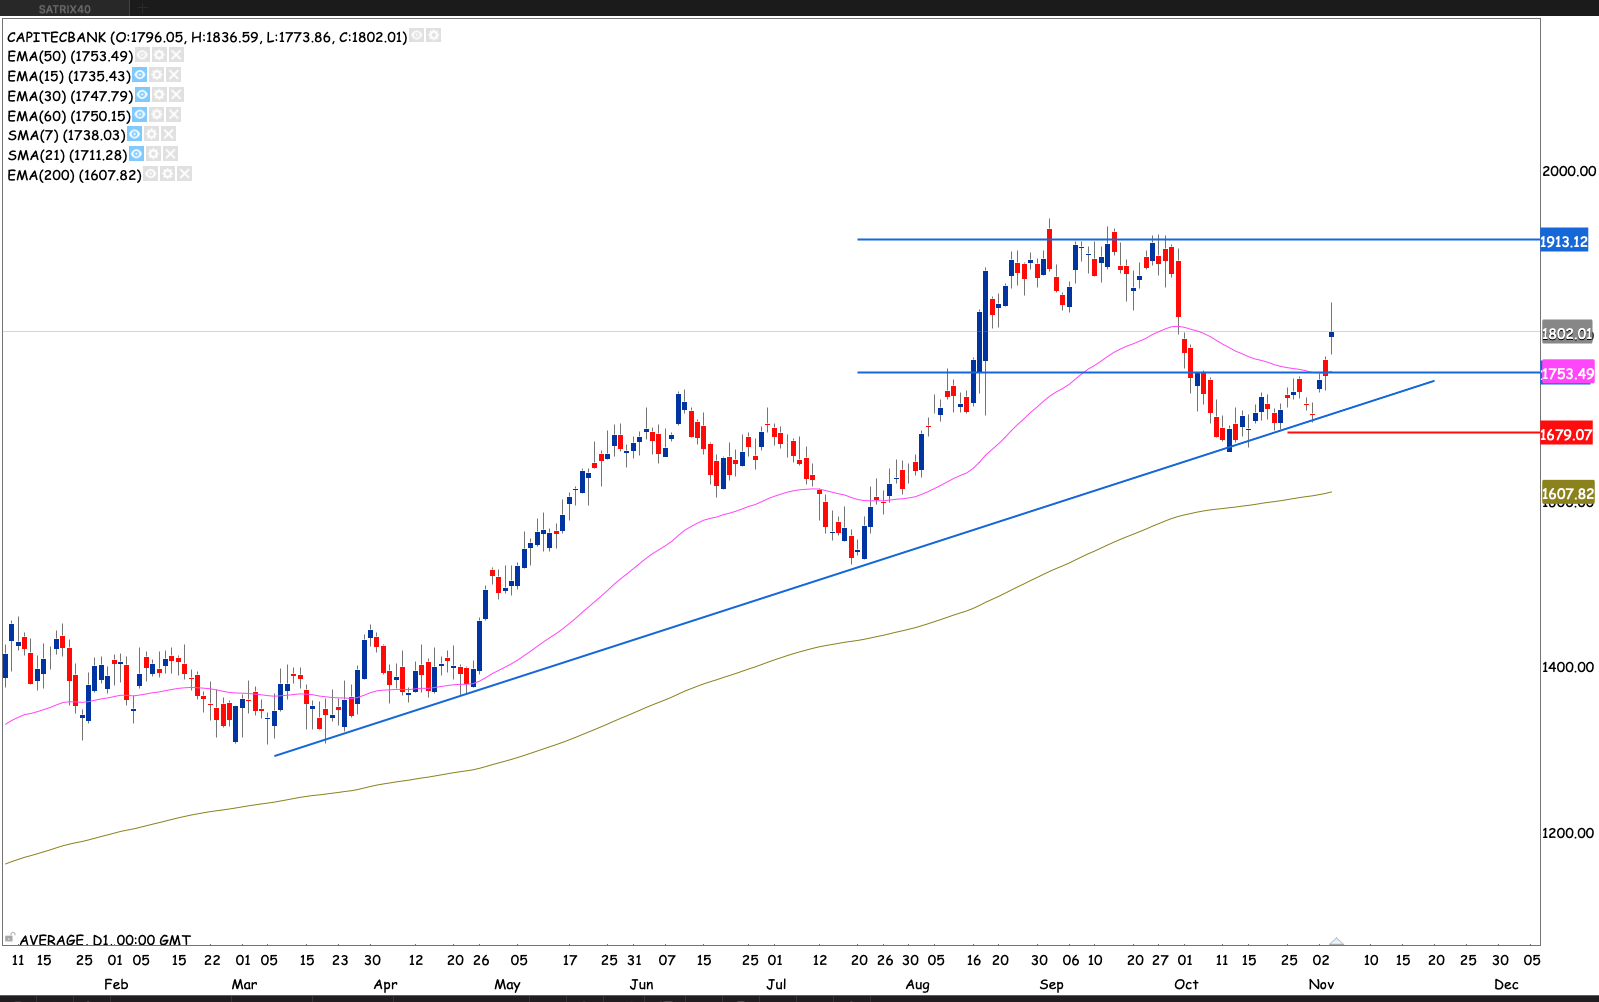
Capitec Bank
Sasol

Shoprite

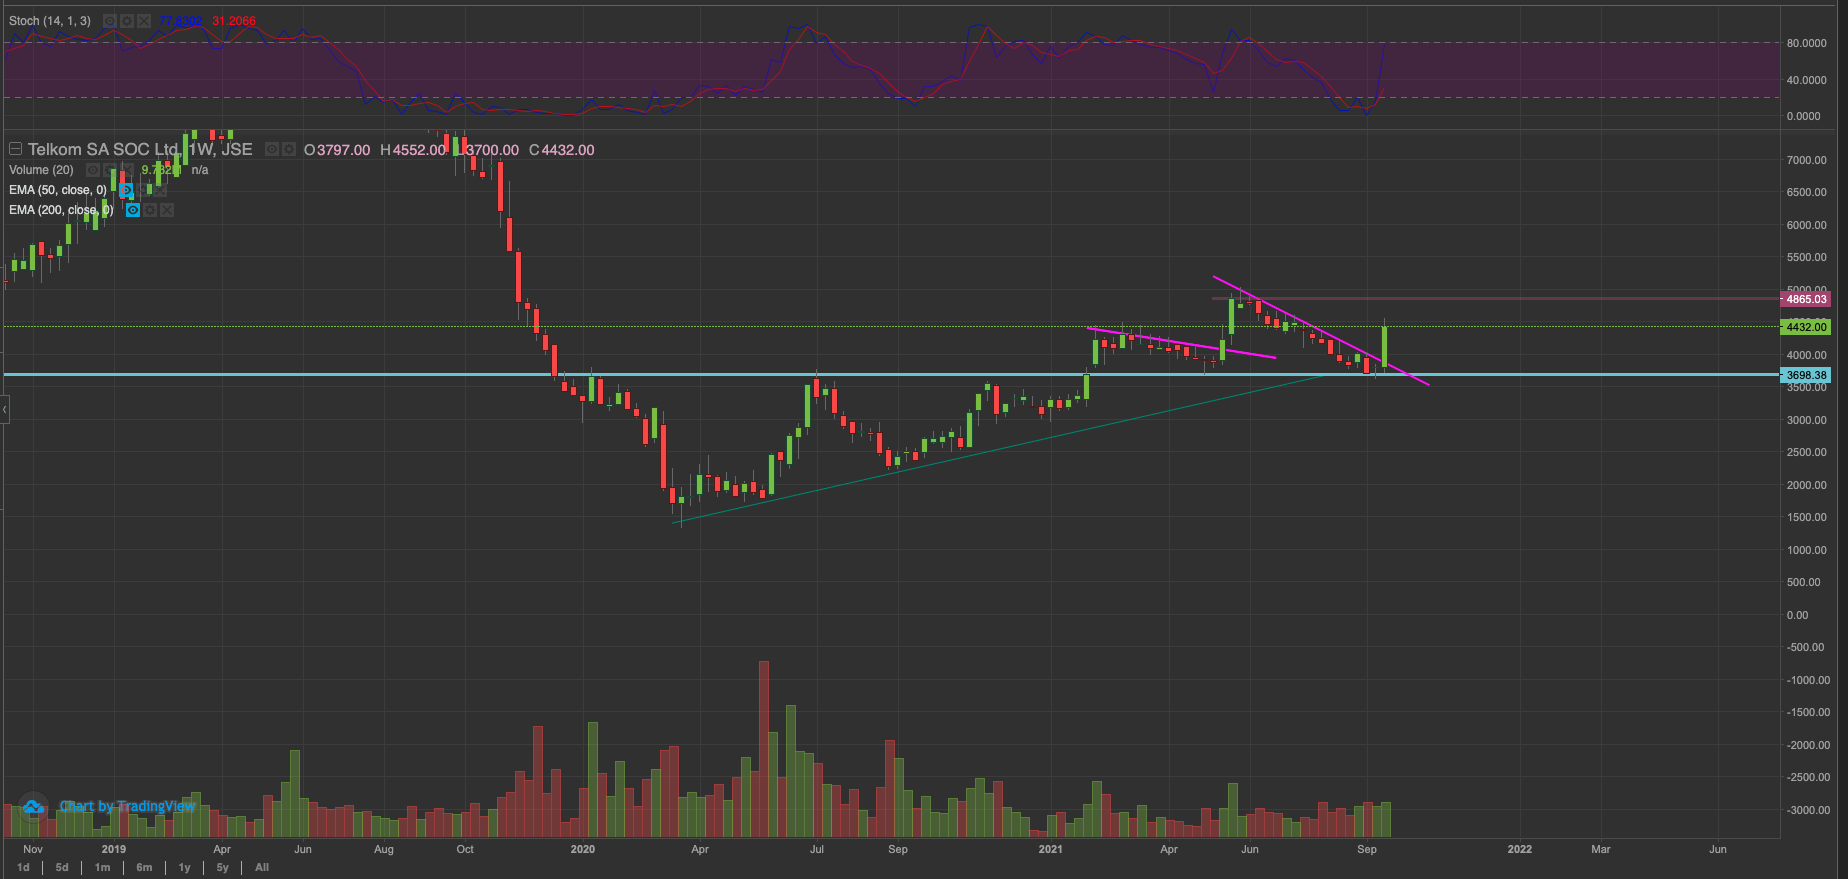
Telkom

The company came up with an update of it’s intent to list their towers business “Swiftnet”. As part of their ongoing strategy to unlock value for shareholders as they believe Telkom’s share price and market isn’t reflective of the intrinsic value of the business. The market loved the news. The share jumped more than 15% on Tuesday at the back of the update. Telkom CEO Sipho Maseko said there’s also considerations of listing openserve and the data center businesses as well. As part of their ongoing “value unlock” strategy.
The stock sold off since the June R50 highs, declining about 27% between June and September. Violating the uptrend support line a little bit.
This news comes as the technical picture of the Telkom share price was starting to look bullish with a bullish divergence pattern. This happens when the oscillator makes a higher low, while price is making lower lows. As the stock holds the uptrend support. The stock has since risen a little over 19% at the close on 22 September.
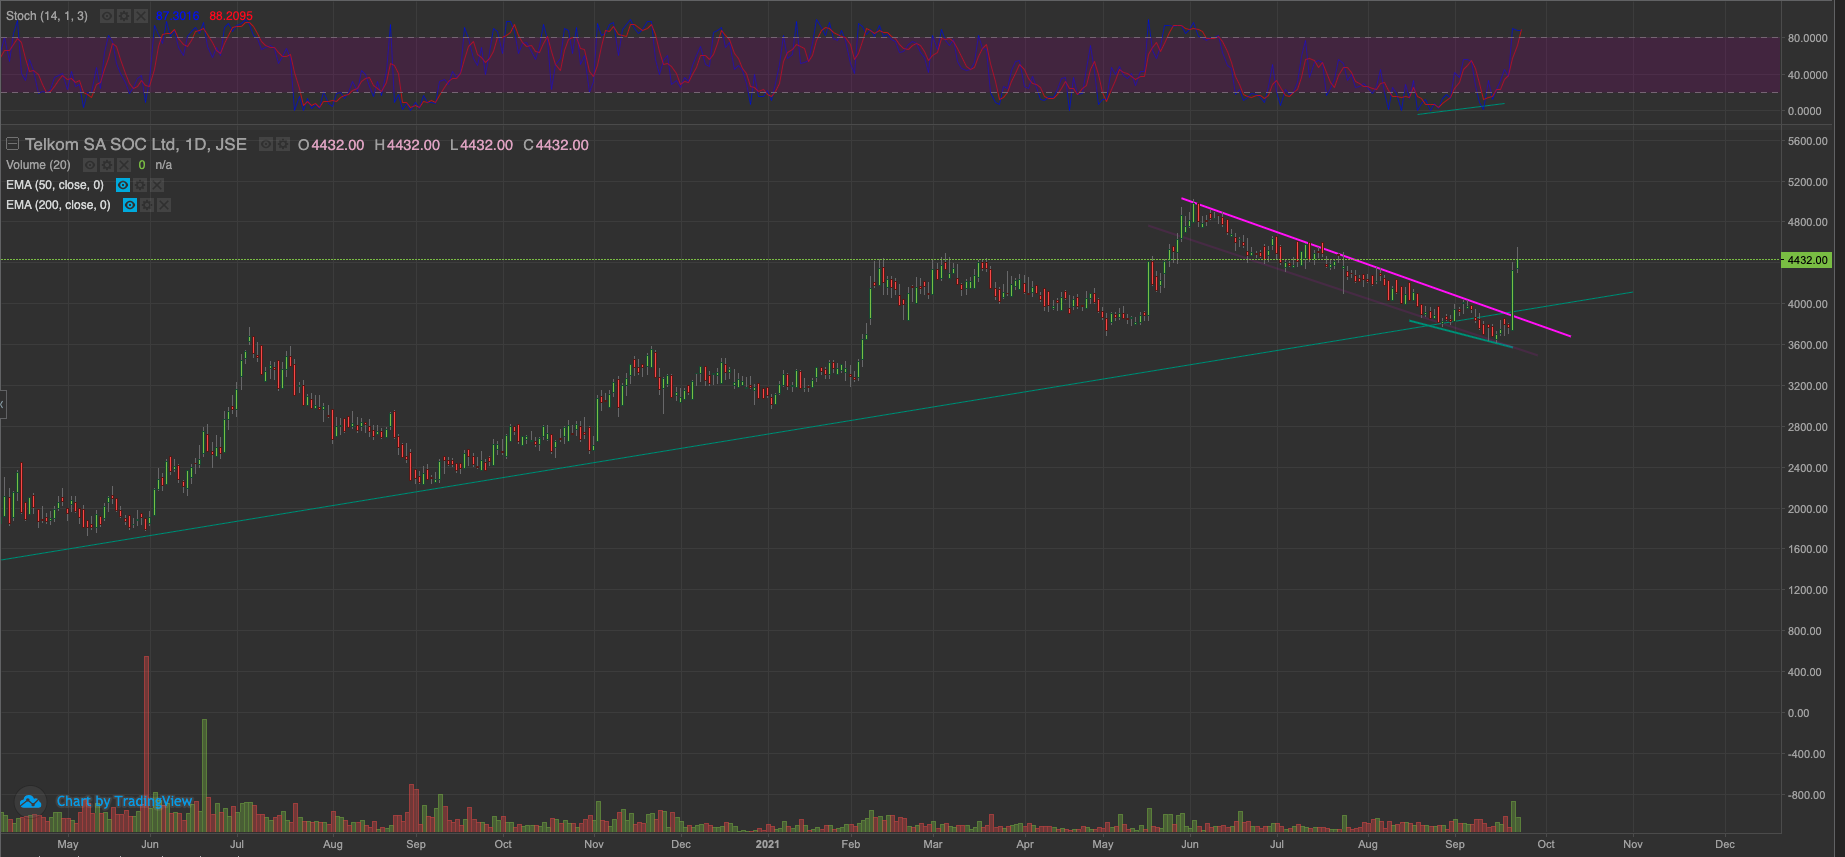
The stock looks very bullish from a long technical picture. The value unlock strategy implementation is the catalyst the market needed to trigger a strong rally in the stock. Taking into consideration that the business to be unbundled openserve is in a growing industry. Fibre technology expanding into the townships in South Africa.
Management issued a trading updating expressing intentions of reducing gearing levels. Since then the company reduced its debt levels by an average of 33.5% with the significant portion of that debt reduction coming from the period ending June 2021. The company reported net borrowing reduction of R35.2 billion and brought back dividends. It’s important to note that management achieved this without ever diluting shareholders. .
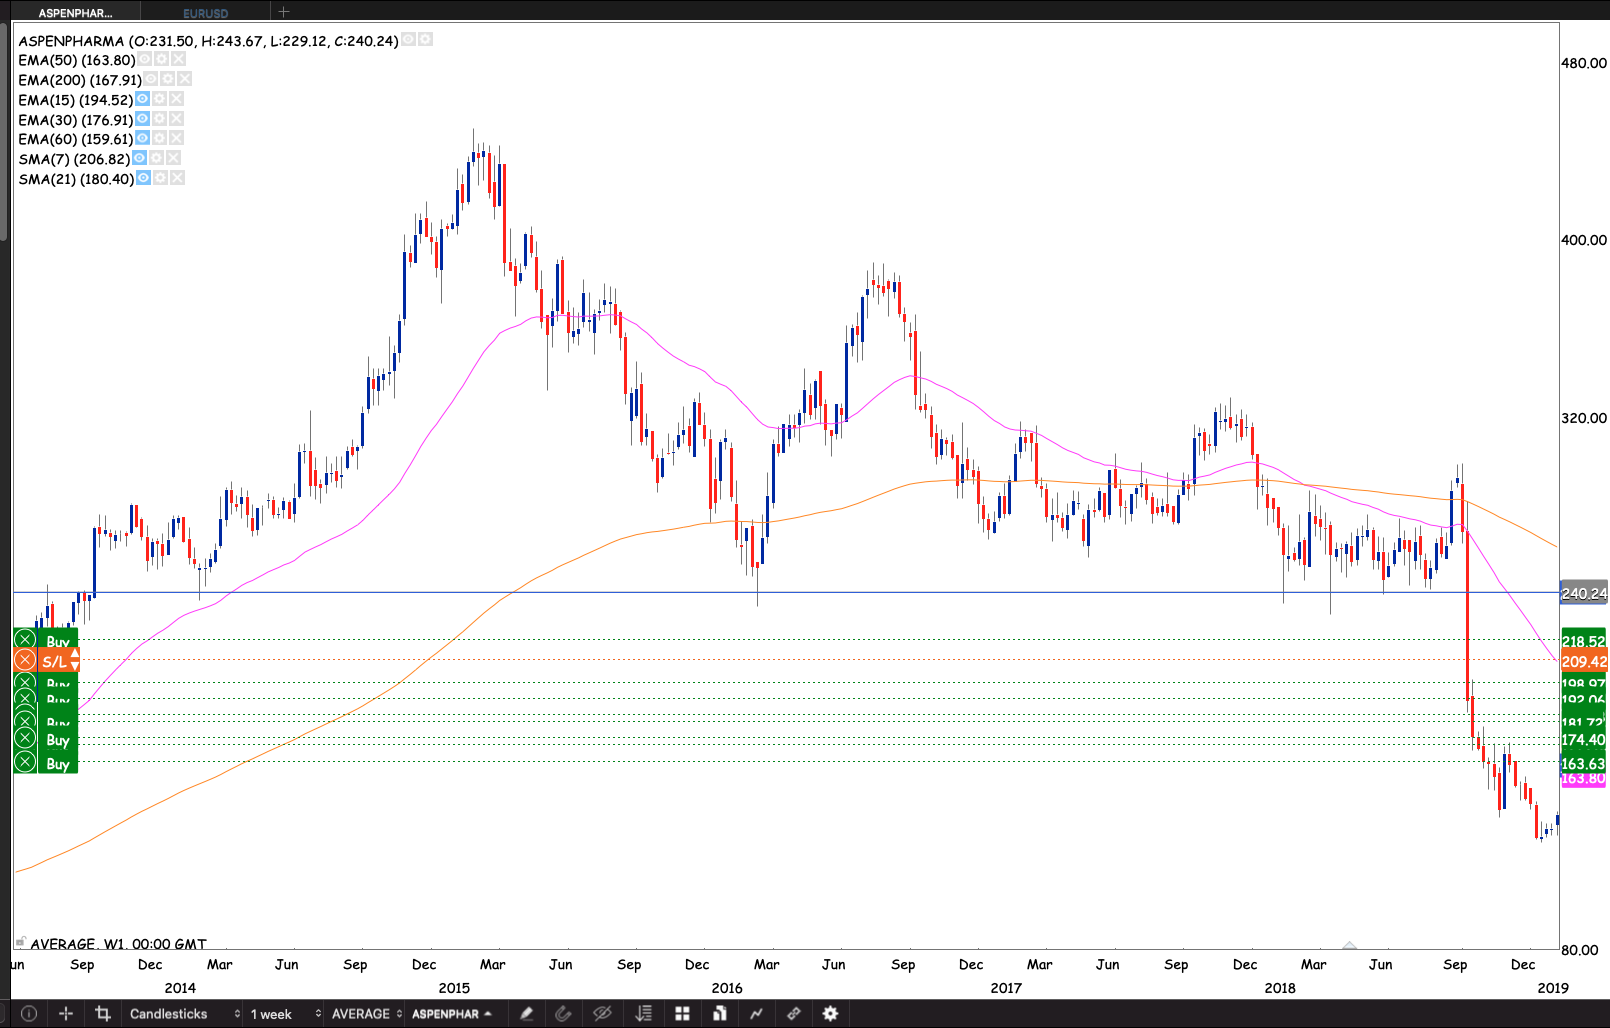
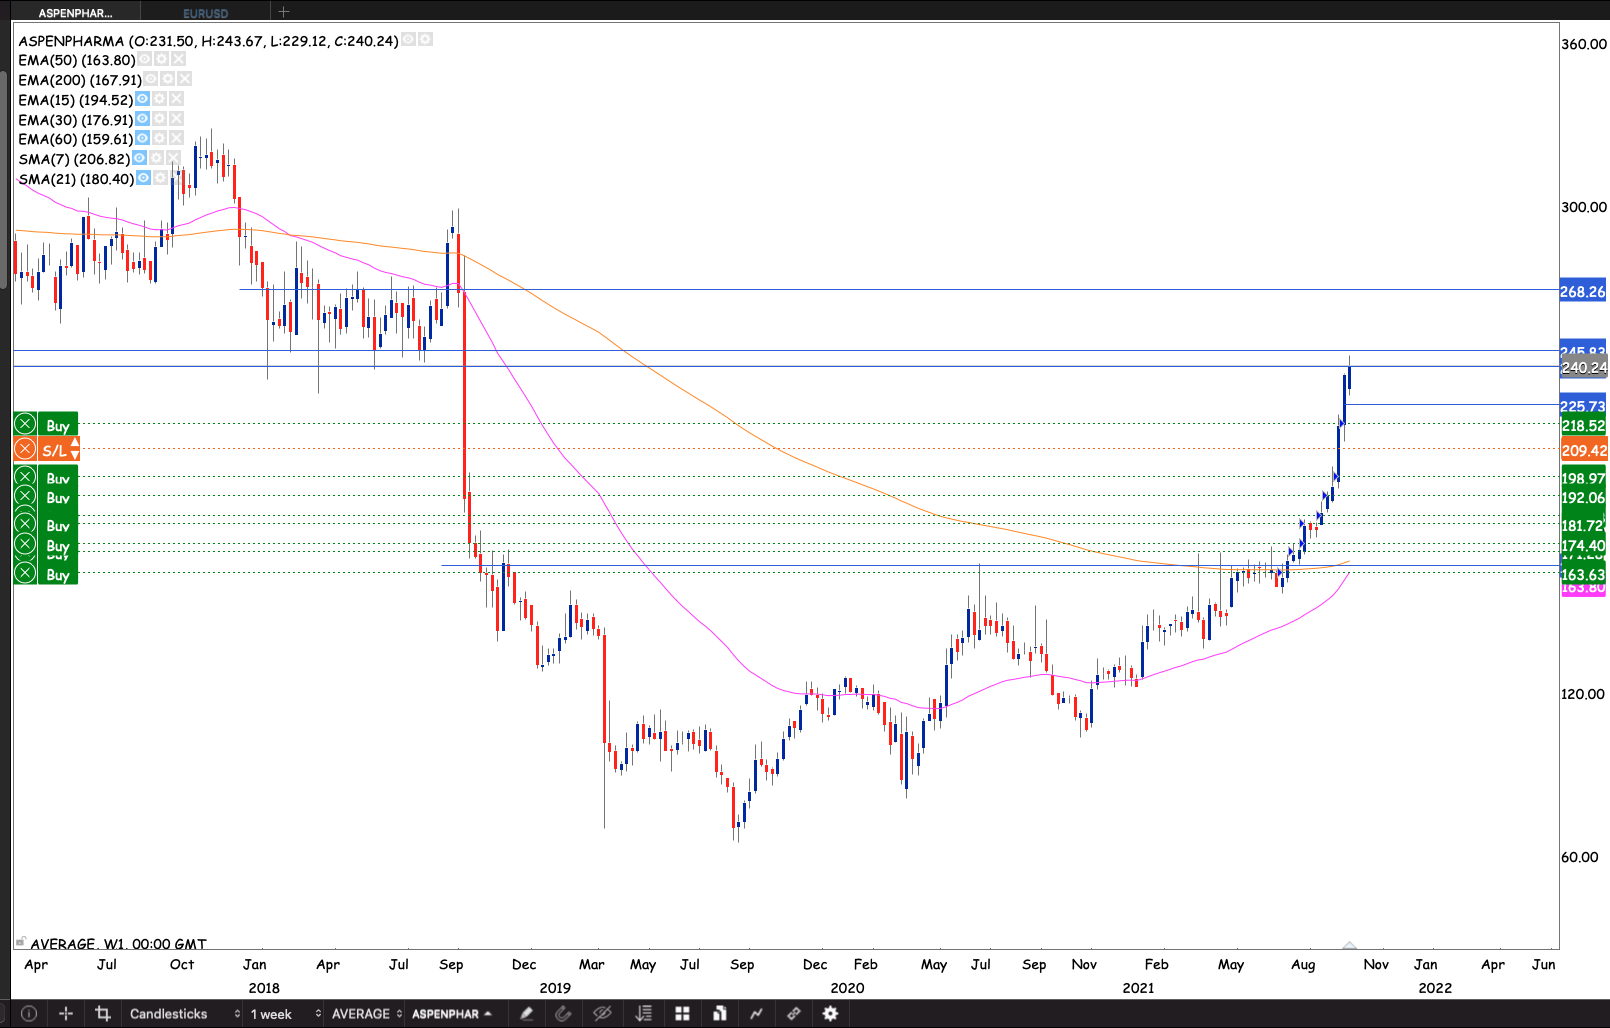
The stock never saw a daily close above R240 until the close on 21 September 2021 (ex-div) with a bullish engulfing candle. The market gapping down on ex-div but recovering all the dividend amount and then some. Closing at R240.24. Since the breakout from the long base. I’m expecting a fair bit of dancing around between R240 – R245. I’m also expecting the market to remember the R268 level
Above R240 the odds of the stock going back to the R430 highs are pretty good.
I’ve been buying on the up since R163.
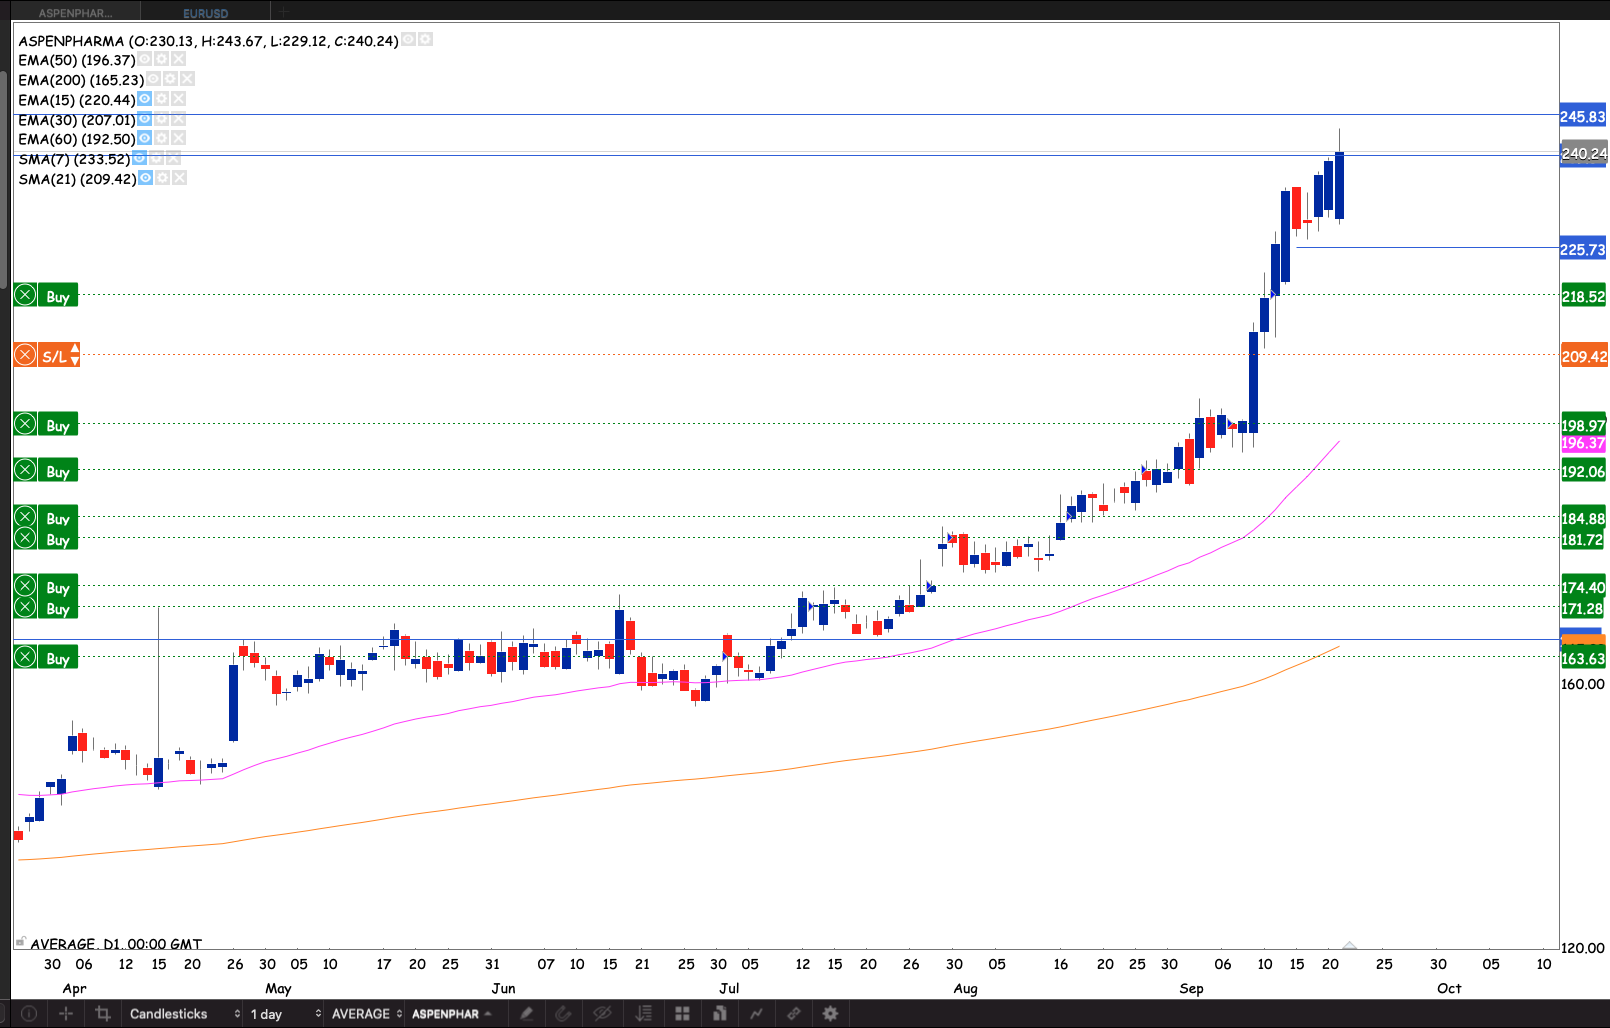
Daily chart
With the market closing through R240 by a few cents with a bullish engulfing candle. Adding another purchase of the stock to the portfolio keeping my stop loss at arms Length at R209.42. Expecting the market to remember the R240 level selling off a bit. Once the stock is above R245.80 I will raise stop loss to R225
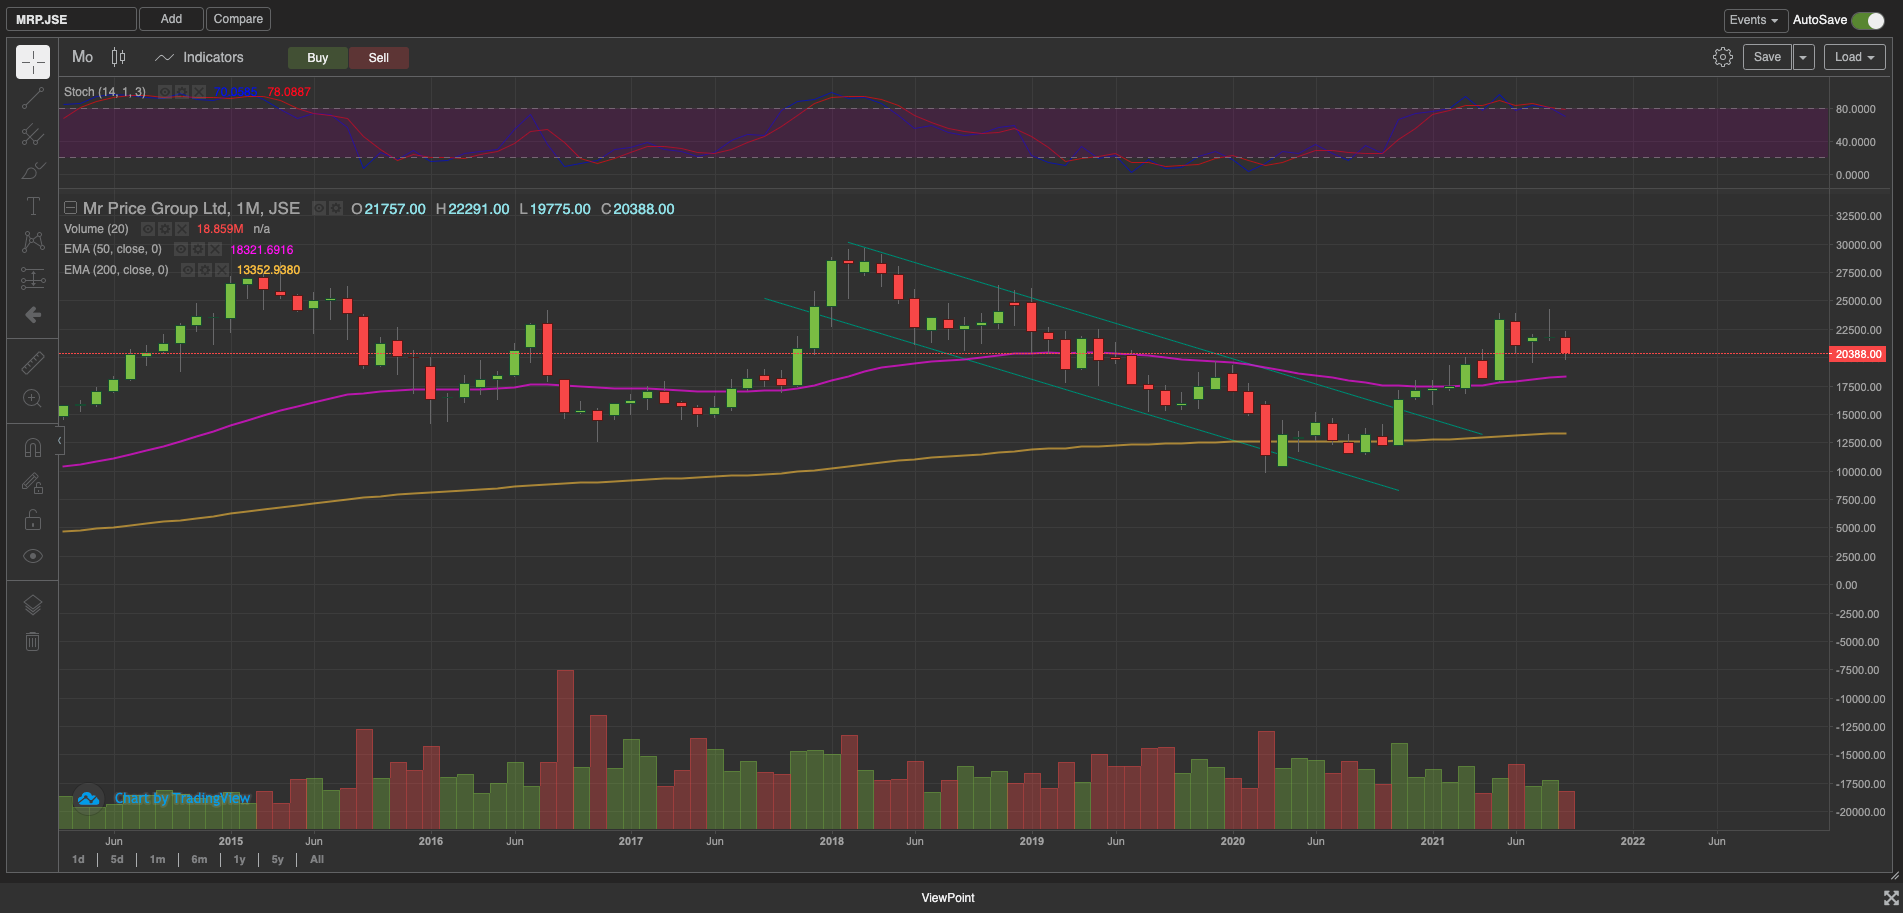
Mr Price was one the companies that came out on the other side of the pandemic stronger than most. The company made two notable acquisitions in Yuppiechef and Power fashion. The company issued a trading update on the 7th of August. Retail sales were up 48.8% (38.6% excluding Yuppichef and Power fashion) in the quarter. The investments are seemingly proving to be good investments.
The stock was defended by the 200 month EMA holding it well. Coming back above the 50 day EMA as well.
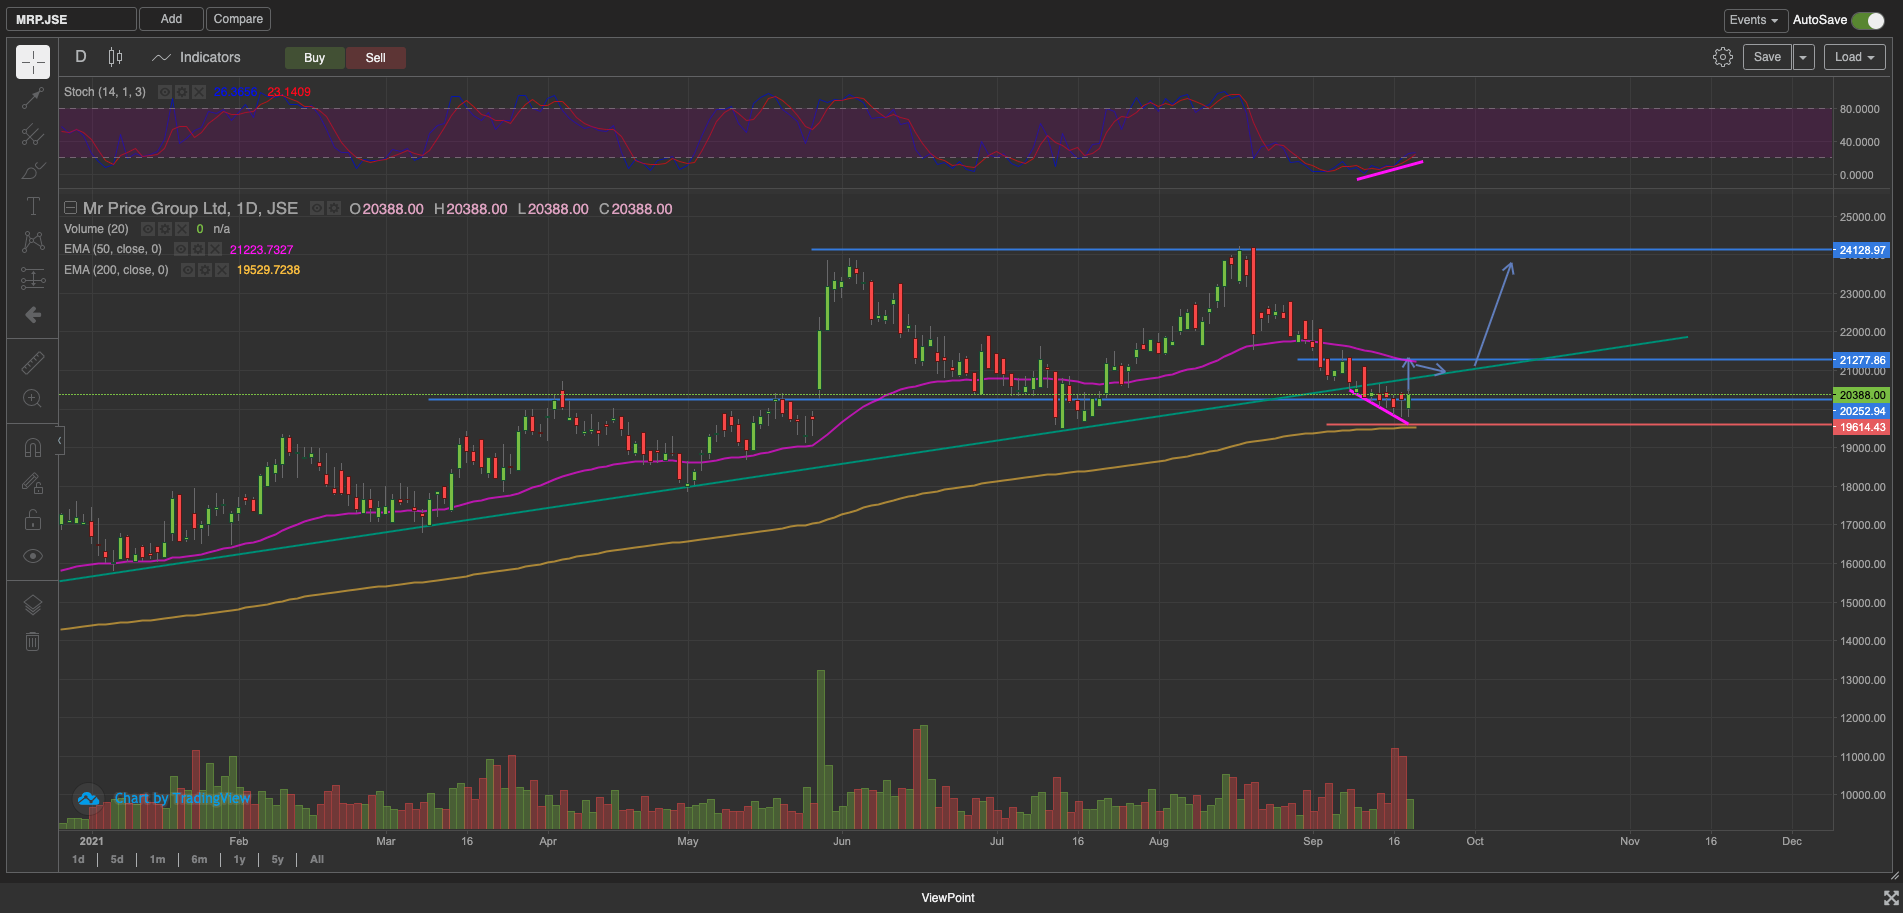
Zooming into the weekly chart.
We have a golden cross on the weekly chart. The corrected back to around the 50 week EMA. Holding the R198 which the stock held after the correction. Violating the trendline slightly. But not by very much.
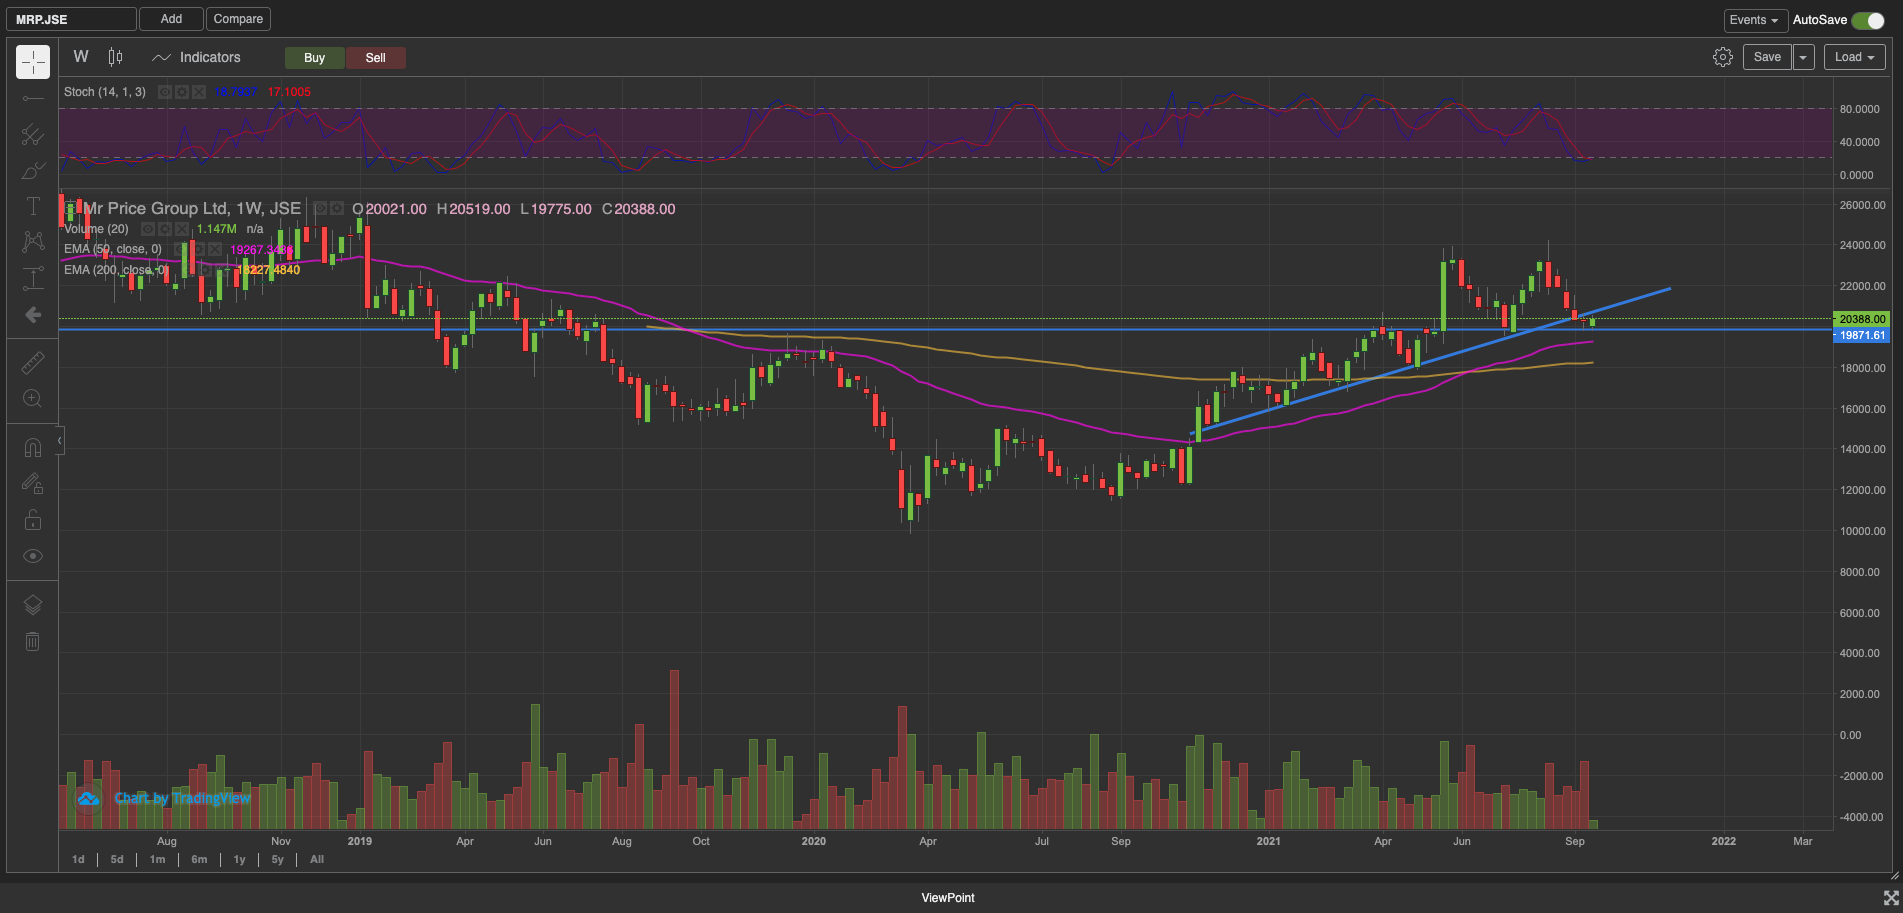
Let’s look a bit closer.
The stock has a bullish divergence at the stock is repelling from the 200 day EMA. If the stock can come back above R205 without making a new low. The stock provides a great opportunity with a tight stop around R196 just below the 200 day EMA. The odds for a strong rally are greater above R240. That rally would be backed by further growth in retail sales as we go into the festive season. We’ll see the cash flow from the acquisitions particularly the Power fashion investment. Possible debt reduction or better yet dividends back to shareholders.
Given the bullish divergence and the strong fundamentals from the company we’re likely to see a turn in the stock coming back above the uptrend support challenging the 50 day EMA, then test of the support from above. Great buy at these levels from long term investors for short term traders rather waiting for the trend line to become support again before buying in the stock. With a short term target of R240.
Can Sasol go back to its former glory at highs of around R630. Well let’s look at the possibilities and the risk of finding out if it can.
The area between R200 – R240 has strong support and an area of strong memory. The market defended that level from 2005. Until the COVID-19 crash of March 2020 cracked it open. The stock dropped almost 90% in a couple of months. Not being another Steinhoff the stock has since recovered that entire fall and back around the strong area of memory. The Market remembered this level again. The fall from grace wasn’t an unwarranted one. Elevated debt levels to fund what proved to be a disaster for the company. The company reduced the debt quite significantly as reported in the year end June 2021 financials. Oil prices and a weak rand saved the company from a rights issue
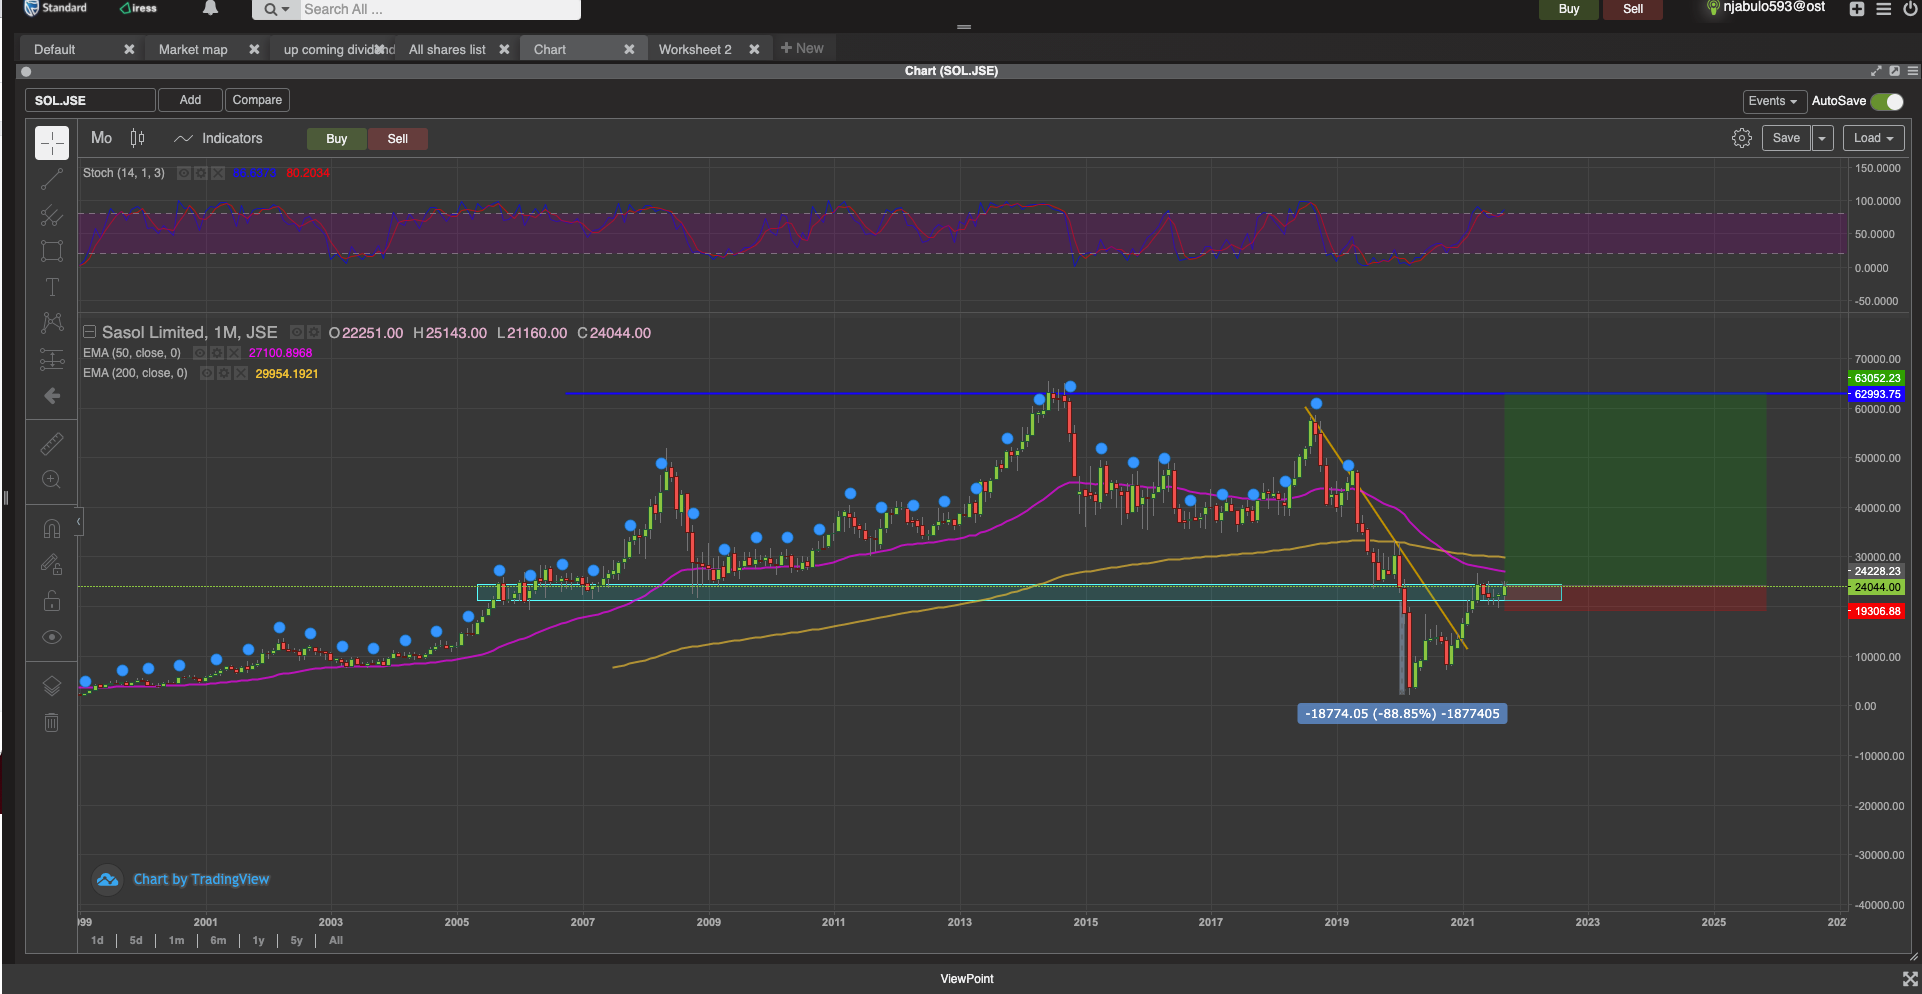
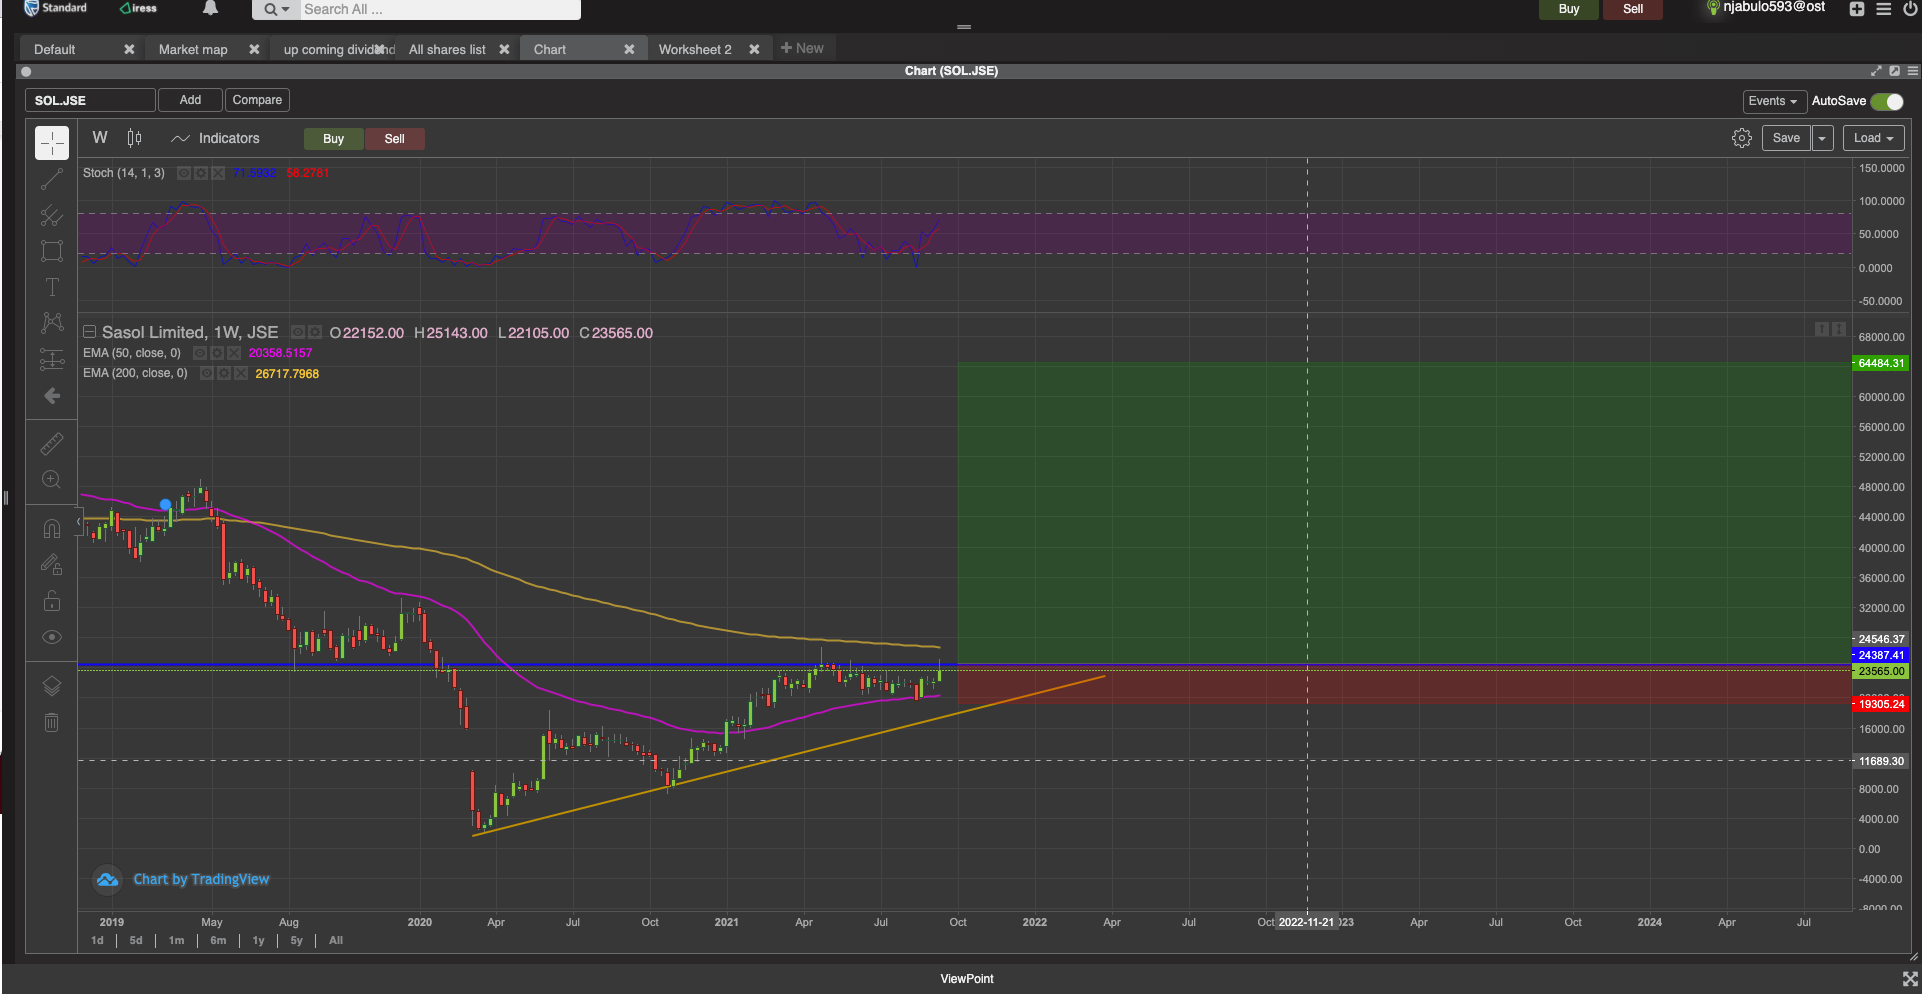
Let’s look at what’s been happening the past year since the March lows.
The stock formed a nice long base with an ascending triangle pattern. In the process breaking back above the 50 week EMA. It came back to test it after remembering the R240 level and holding quite well. With a longer term stop just below the 50 week EMA around R190 Targeting the R650 level presents a brilliant 1:7.6 risk:reward.
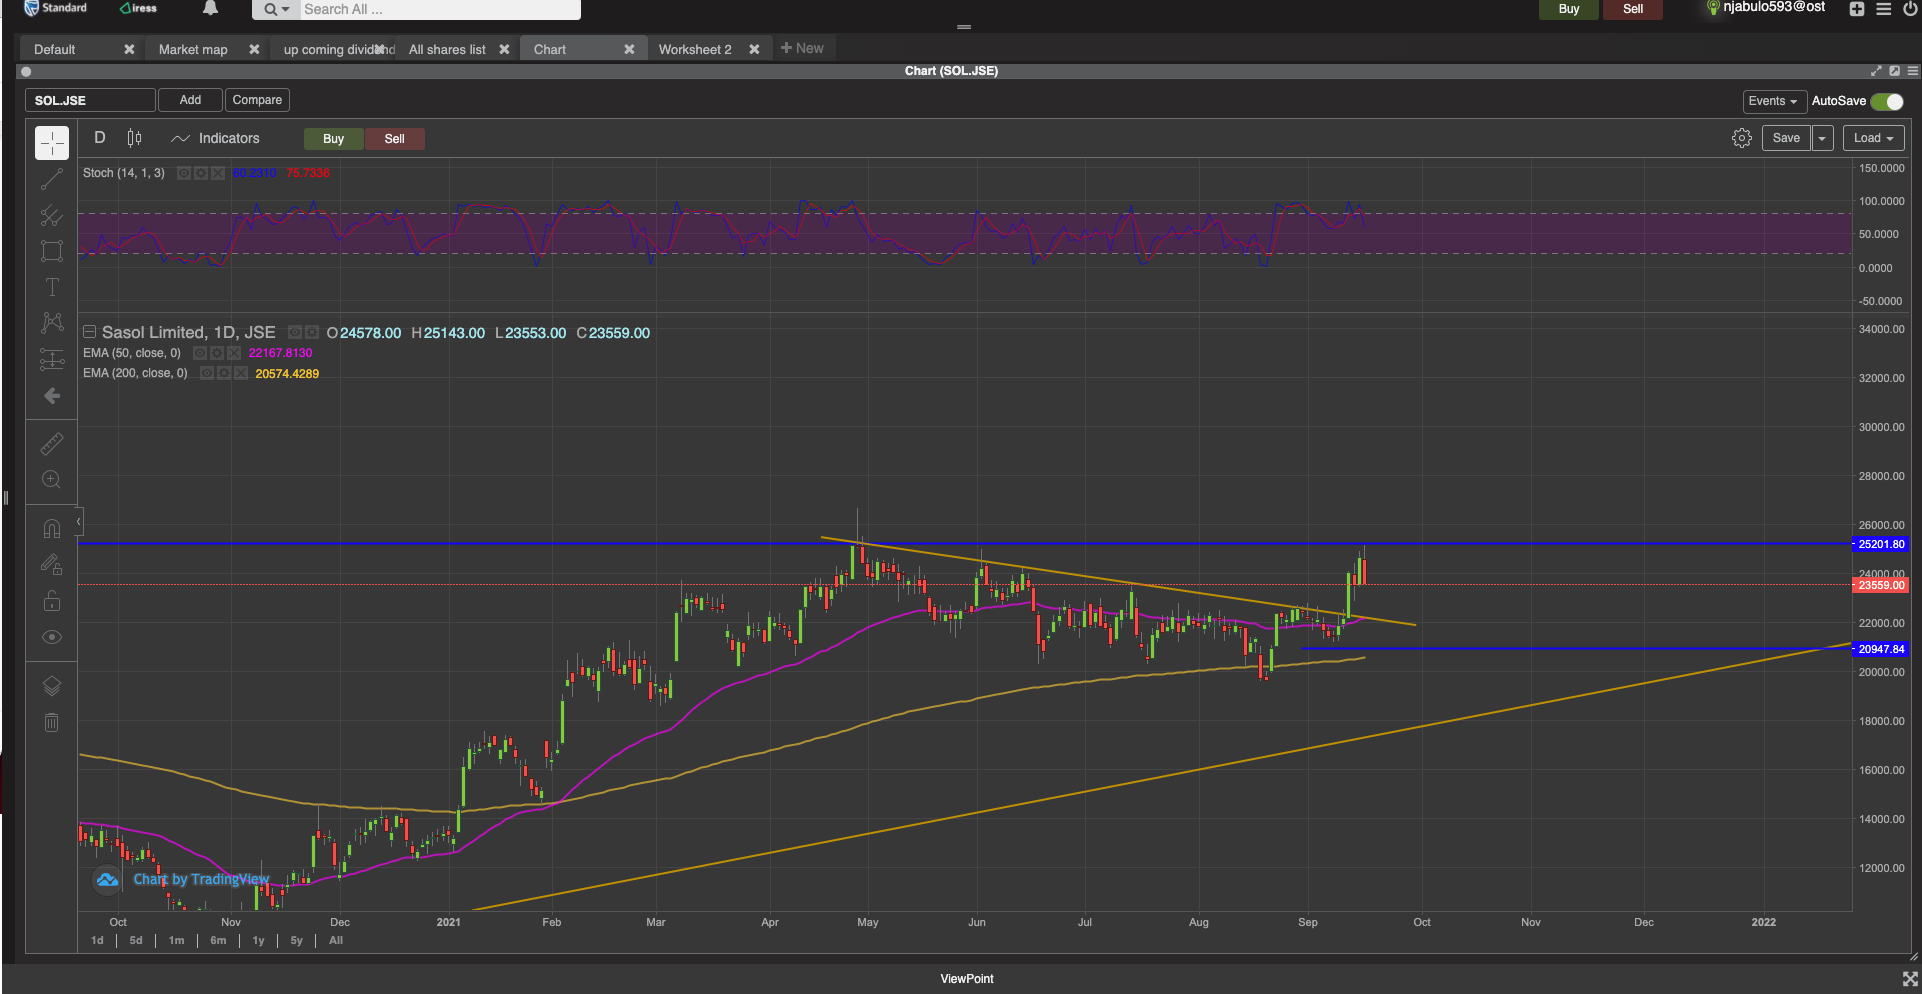
Zooming to the daily chart
The stock broke the R240 level and ran into some selling at R250 since April 2021, but the stock held both the 50 & 200 day EMAs. The market remembered the R250 level again testing it on 16 September 2021. If we can close above the April 2019 close The doji that proved to be the undoing of the rally would then confirm the trade
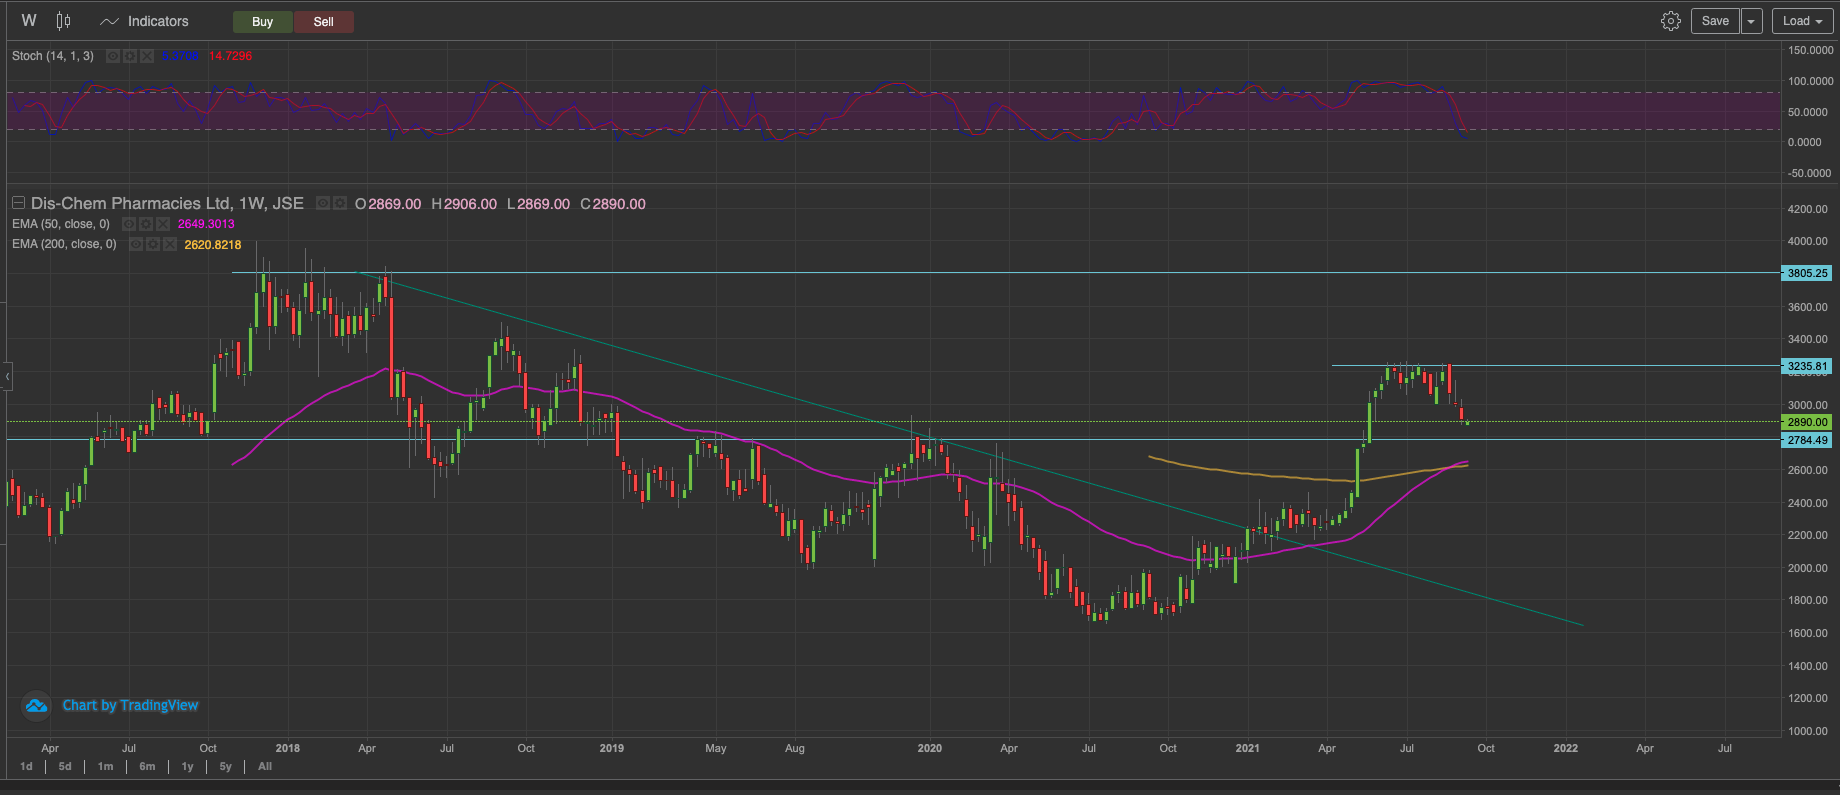
The vaccination roll out is a good thing for Dis-chem. The slower the roll out the better because it means more foot traffic into the Dis-Chem. South Africans coming in for a vaccination and some picking up a snack or two and items at the stores on the way out. Moreover even those who aren’t picking up anything are more exposed to the products in the store. This is essentially free advertising for Dis-chem. Notwithstanding tough competition from Clicks. The company has been growing earnings since listing until lockdowns came around. Given the above I’m anticipating earning to recover back above the 2019 comparable period.
Looking at the charts
The stock had a strong run since the 2020 lows, doubling within the period. We had then had a golden cross as the stock looked to retrace and test the old resistance around R27. The R27- R29 eraa is a great buy area. With a tight stop around R25-26 just below the support line. The odds are much better back above the R32 resistance for a short term target challenging the 2018 R40 highs.
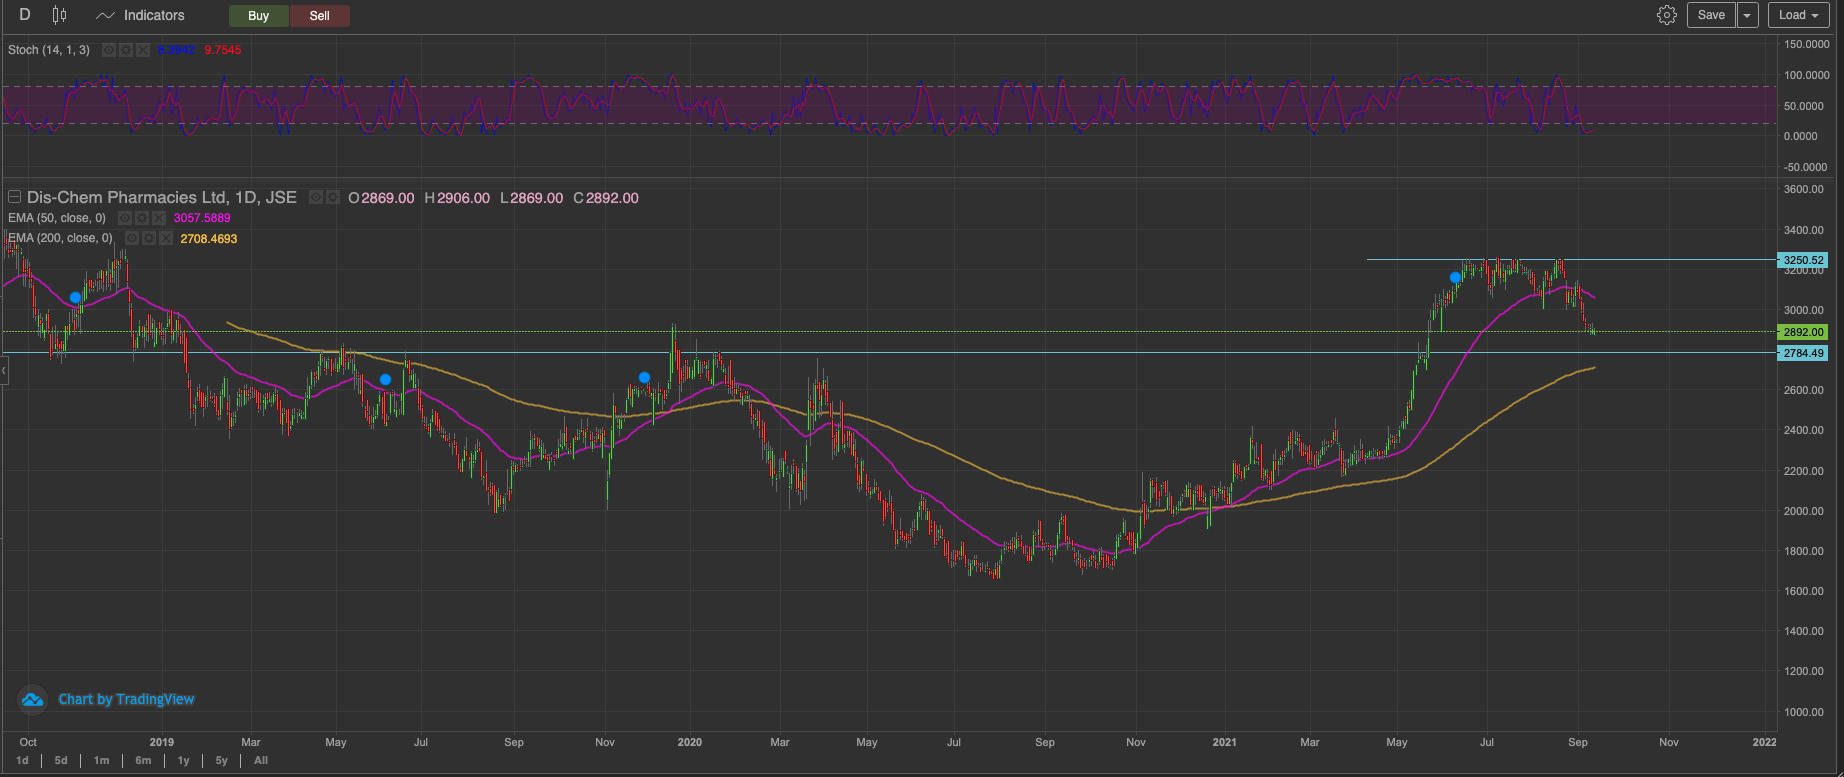
Zooming a bit closer
The stock lost its will to rise post the dividend. Subsequently slipping below the 50 day EMA at the back of the founding. We have to wait to see how the 200 day EMA defends the price. If the 200 day EMA holds as support, and monitoring price action around the 200 day EMA. The R27 level is a good place to start building the position. And increasing the position when the stock is back above R32.50. It’s the first time since the golden cross that the stock takes a shot at the 200 day EMA. The likelihood of the moving average holding is pretty good.
Triple screen
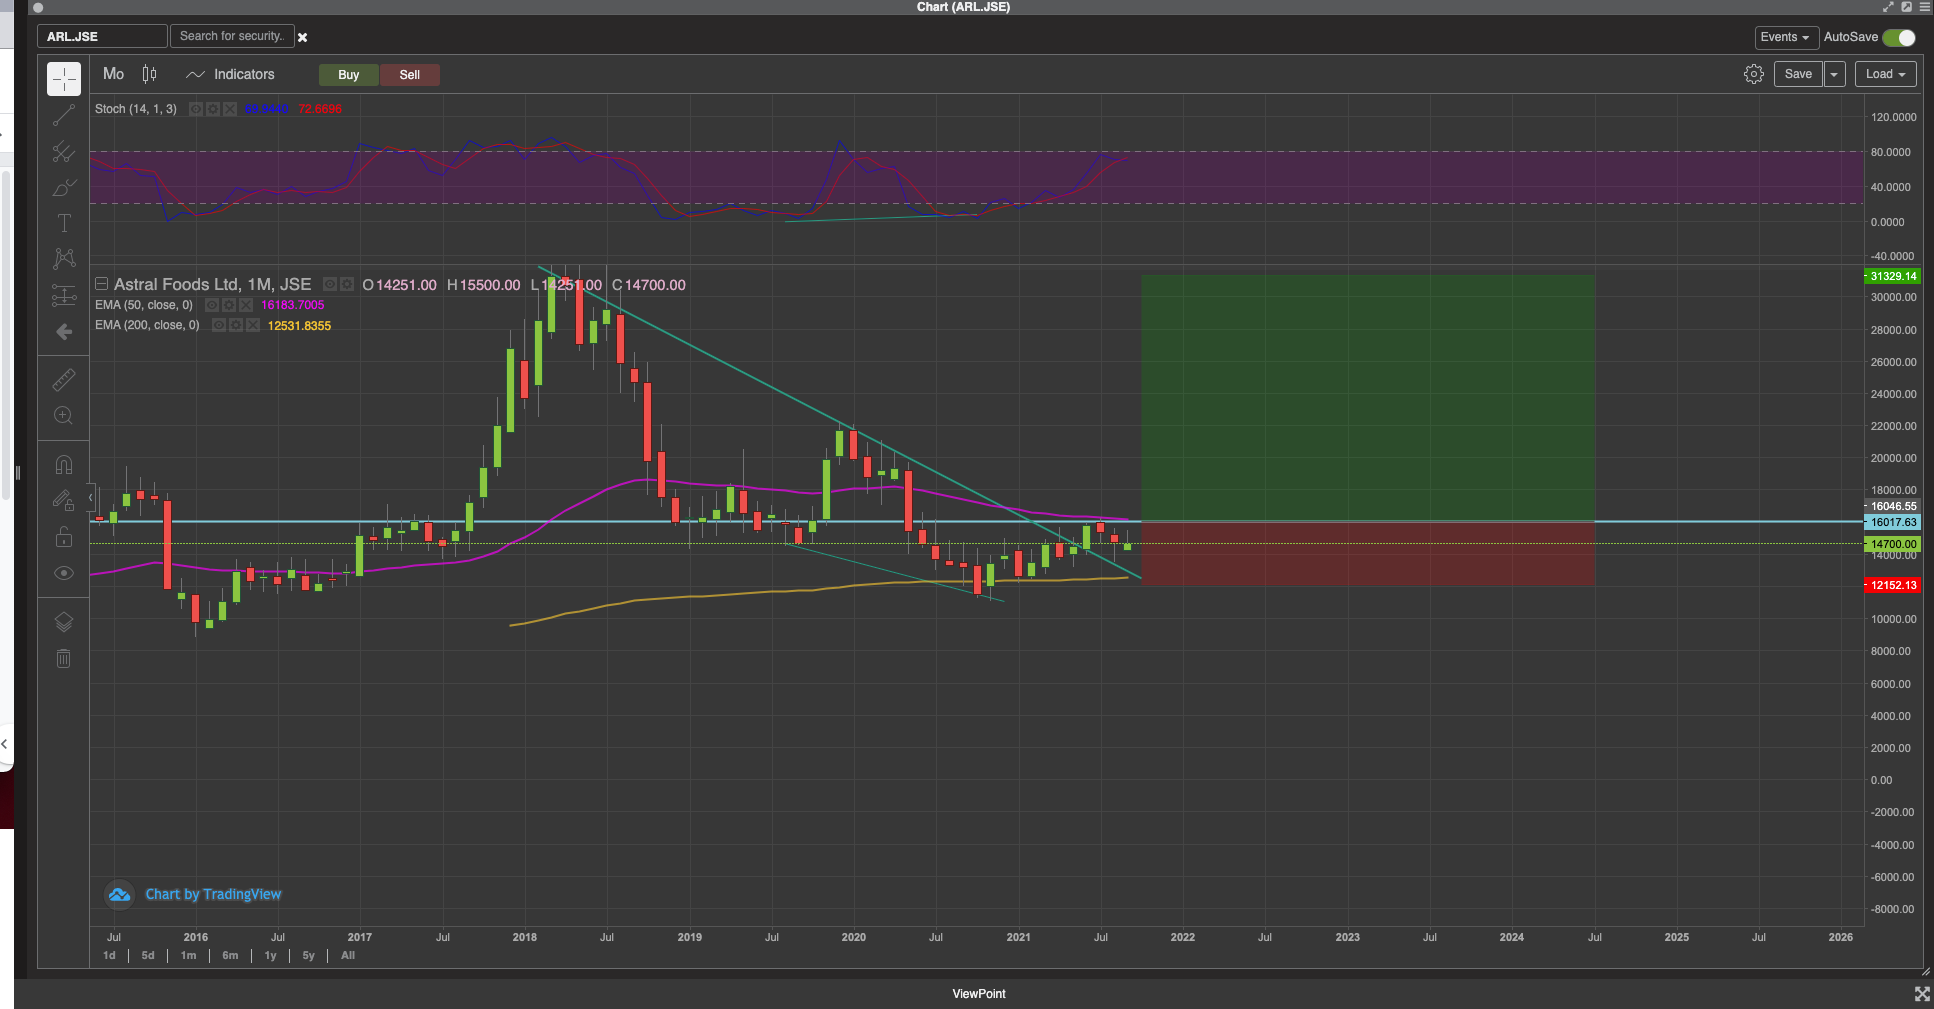
Monthly chart
We had a bullish divergence pattern as the stock held the 200 month EMA. A bullish divergence is a classing reversal pattern. The stock has since formed a base with what is starting to look like a cup and handle pattern. Another reliable classic chart pattern. The neckline of the cup and handle pattern is around the 50 month EMA. The stock broke the downtrend resistance level, came back to test it and is holding it well at the moment as support. If the stock can close through the R160 neckline and above the 50 month EMA. The odds of the stock moving back higher back to the R335 highs increase. With a long term stop loss around R120 and a long term target of R313. WIth patience it’s a good 1:4 risk:reward ratio.
Weekly chart
The stock currently forming the handle finding a tug of war around the 50 week EMA. With more green weeks than red ones. Signaling that more battles are won by buyers. If the stock closes below R130 it would seem sellers are winning the war. However, with a close above R160 that would signal that buyers are winning the war. If the stock closes through R160 it would be closing the 200 week EMA as well. Improve the risk:reward.

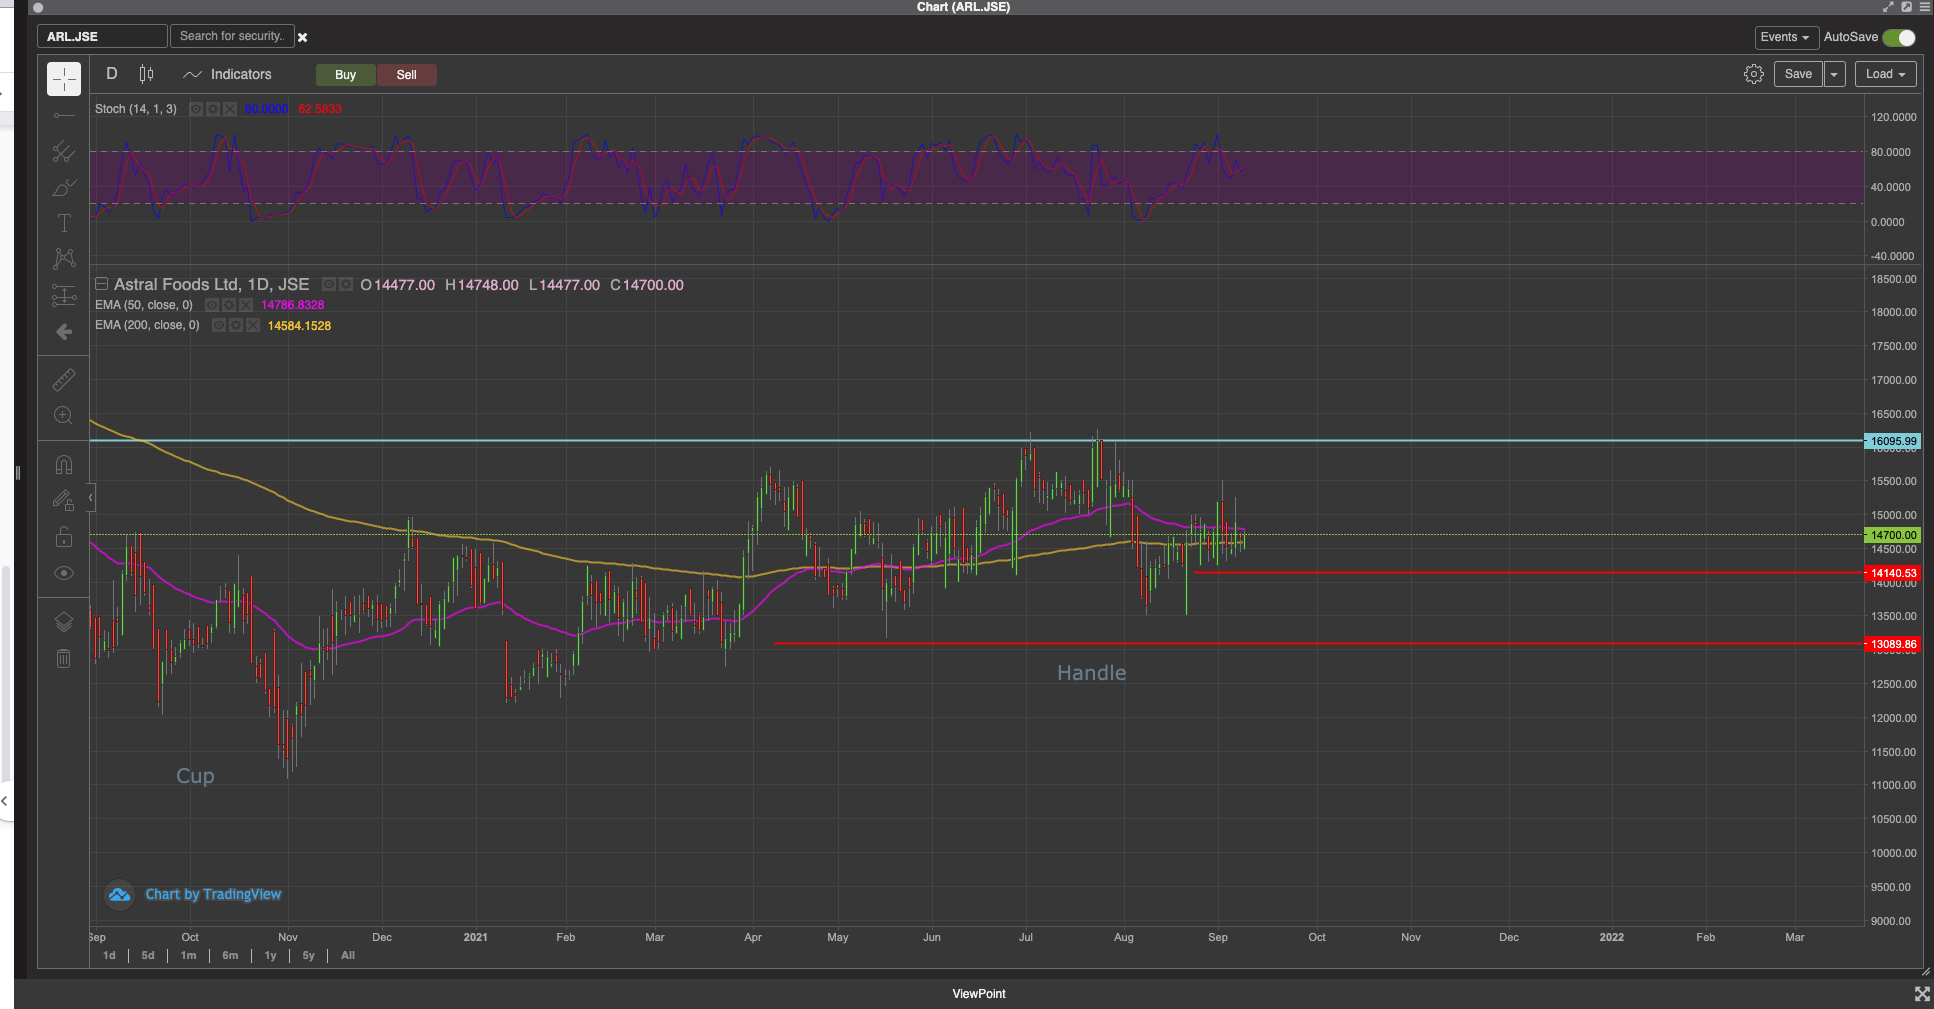
Daily chart.
We recently had a golden cross showing that indeed buyers are a bit stronger than sellers albeit not by very much. At the moment the status of this stock is waiting on the sidelines waiting for the R160 breakout. With an initial wide stop around R130 or R140 if being slightly aggressive with the stop loss.
Looking at the company
Unfortunately the company fell short of the input cost sweet spot (R2200 – R 2450) stated in the interim results. The average cost for yellow maize was around R3397, a 33% miss.
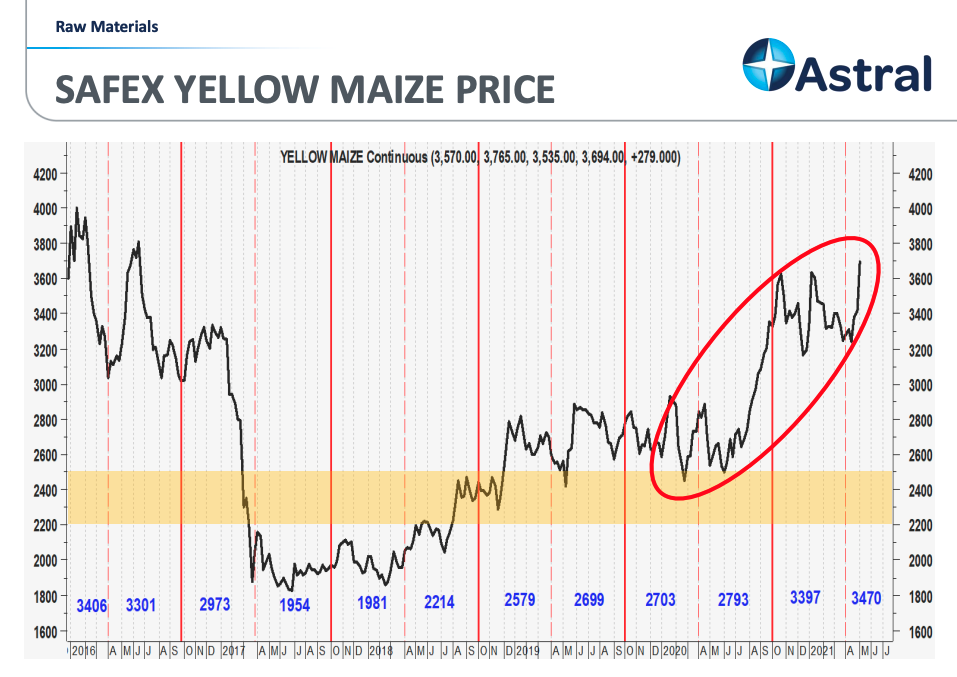
The good news is yellow maize is a cyclical commodity and prices are starting to slide off. Breaking a long term trendline. I’m anticipating a further decline in maize.
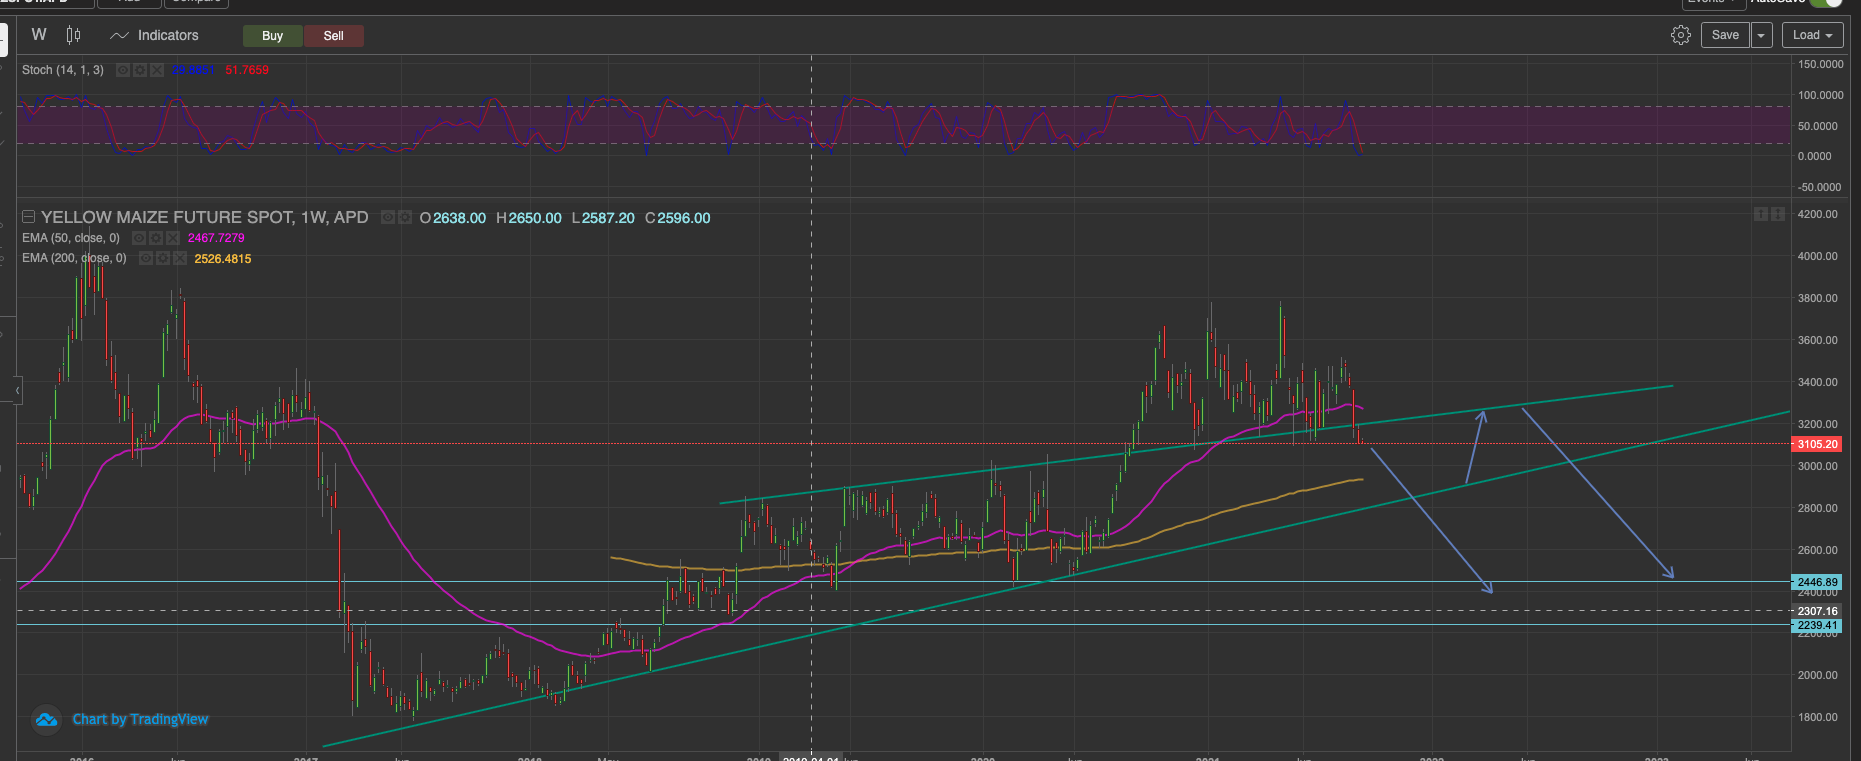
Food retailers are reporting good numbers at the back of South Africa’s version of the stimulus cheques. The Covid-19 grant usually ends up in the food retailers to which they are well positioned to benefit from that. The recent strike doesn’t help the company one bit. I’m anticipating a recovery to input dropping as maize prices decrease. The company should recover profitability. We will see the impact of the recent strike. Despite a tough period the company nonetheless declared an interim dividend.
With the stock being in a low base having broken the long term down trendline the risk reward is quite enticing, keeping a tight stop loss around R130 and waiting for a R160 breakout.
The status for Astral foods remains waiting for a break above R160. Below R160 the risk outweighs the reward.
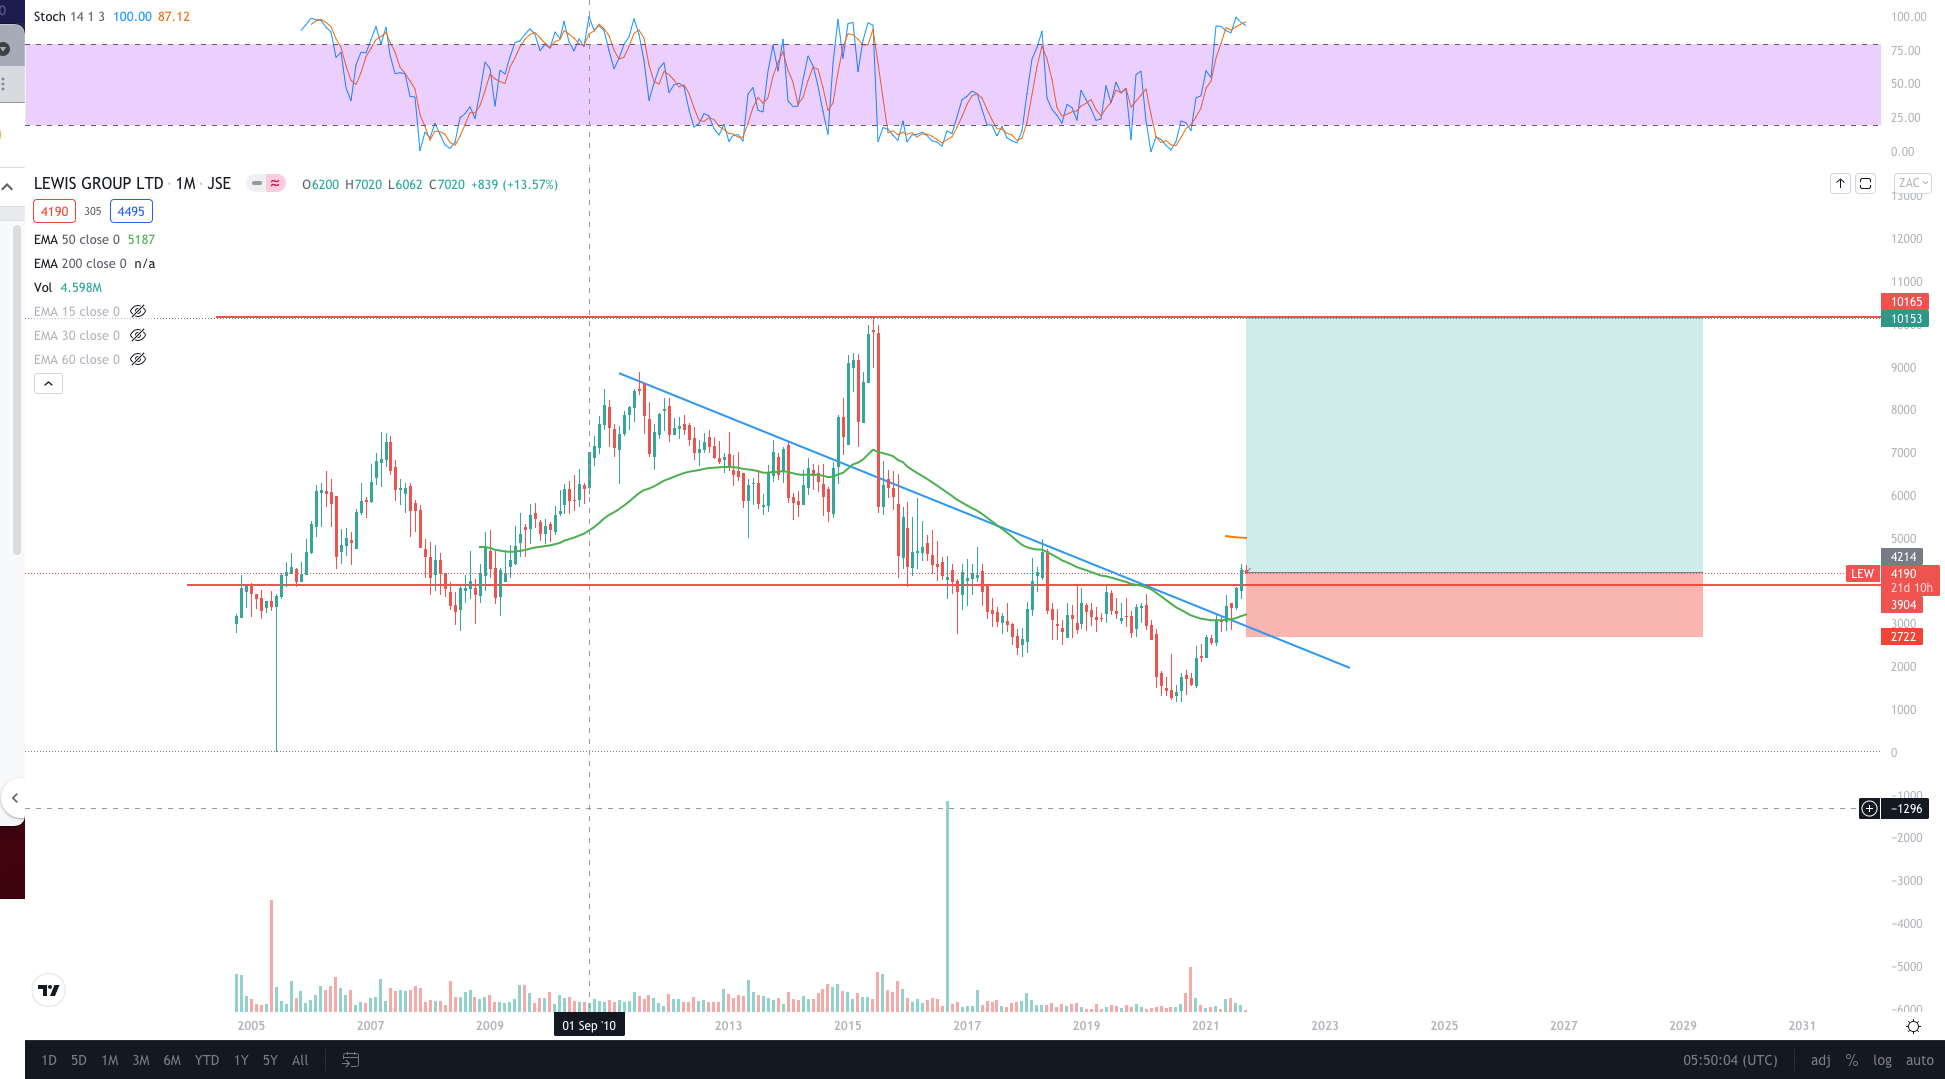
]]>Lewis offers a great risk:reward opportunity at the moment. After forming a long term base and breaking from it last month. The stock recently broke above the 50 month EMA. We could see the stock retrace back to the R39 support and is likely to hold it. With a long term stop loss of around R22 and a long term target of around R100 at these levels (R42-45) it’s a decent 1:4 risk reward ratio. The company performed very well coming on the other side of the pandemic quite strong. Paying chunky dividends and buying back shares as well.
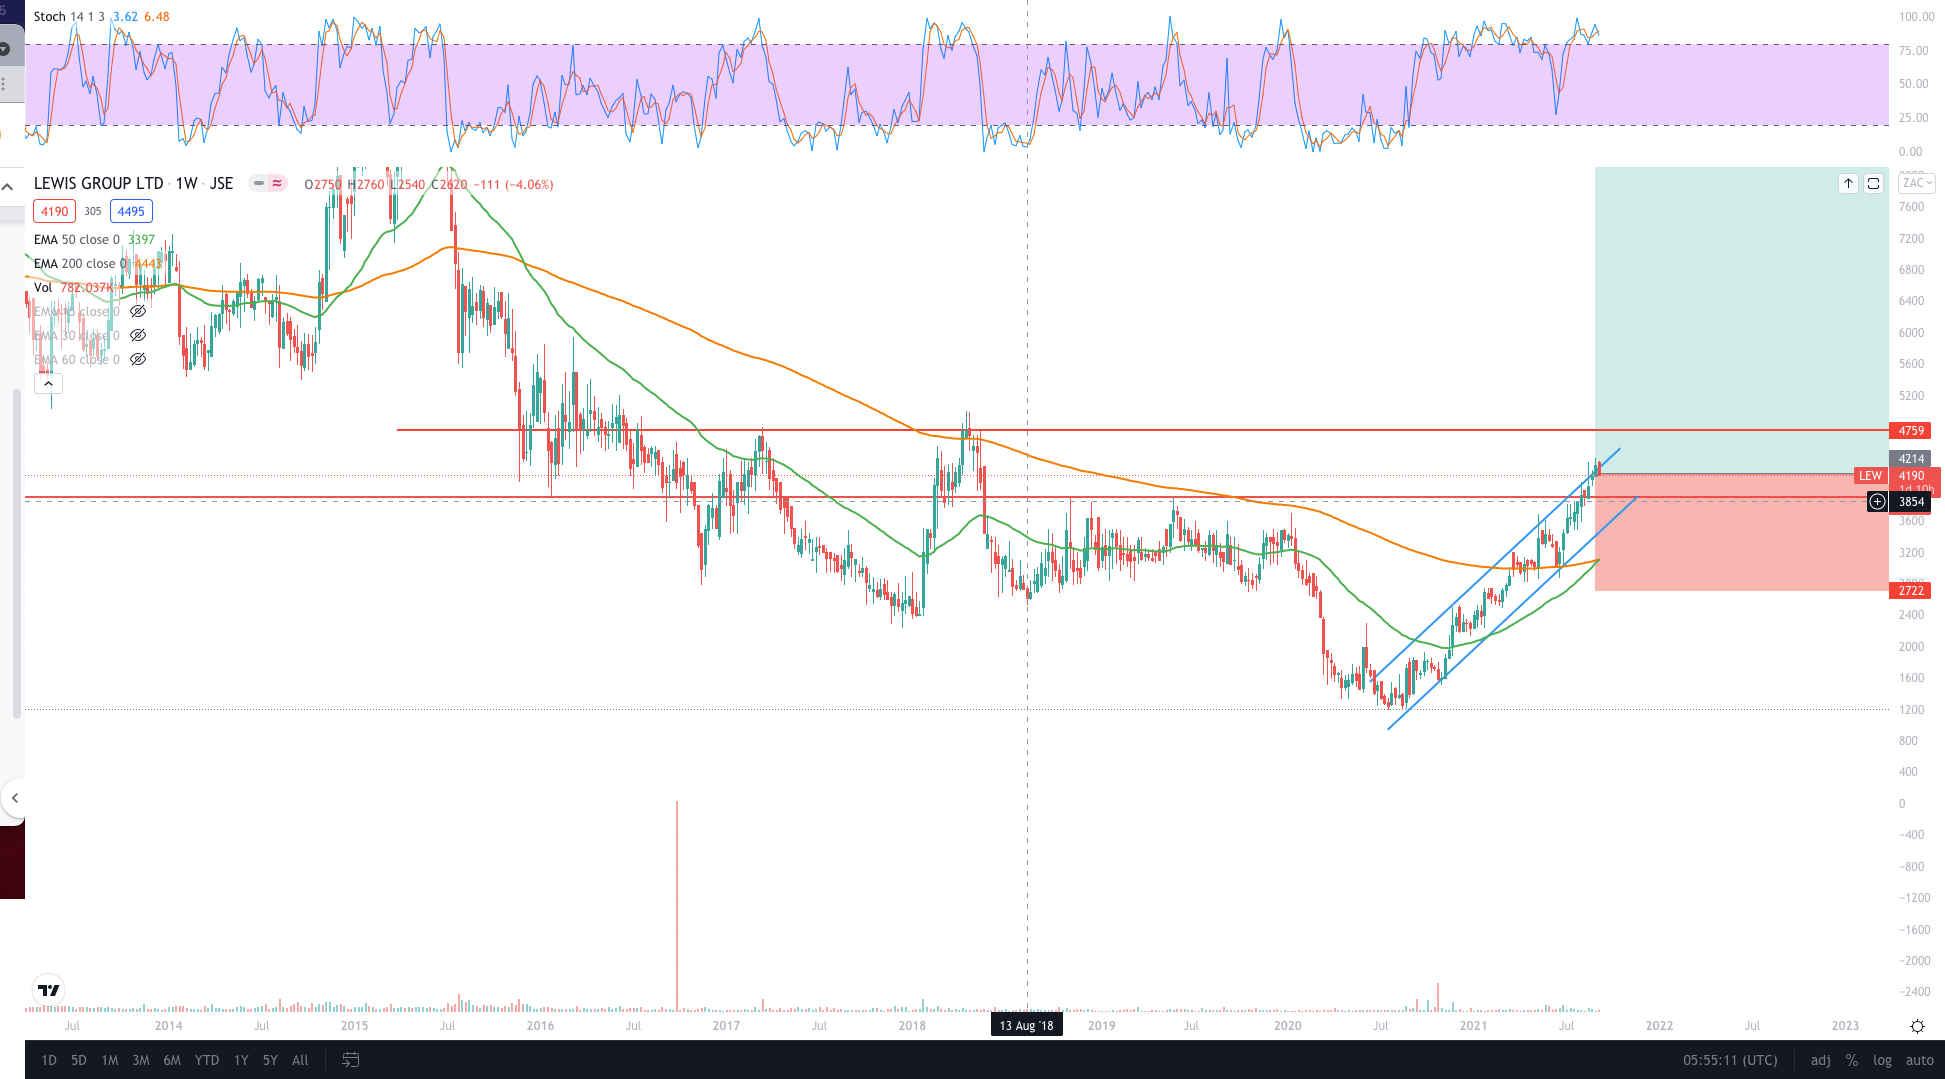
Let’s zoom in to a weekly chart.
The stock is close to a weekly golden cross. The stock has been in an uptrend channel since the March 2020 lows. Ultimately breaking the long term resistance. The stock might find some resistance around R47. Then perhaps hold the R40-R47 range. I think the stock will really start to run above R47.
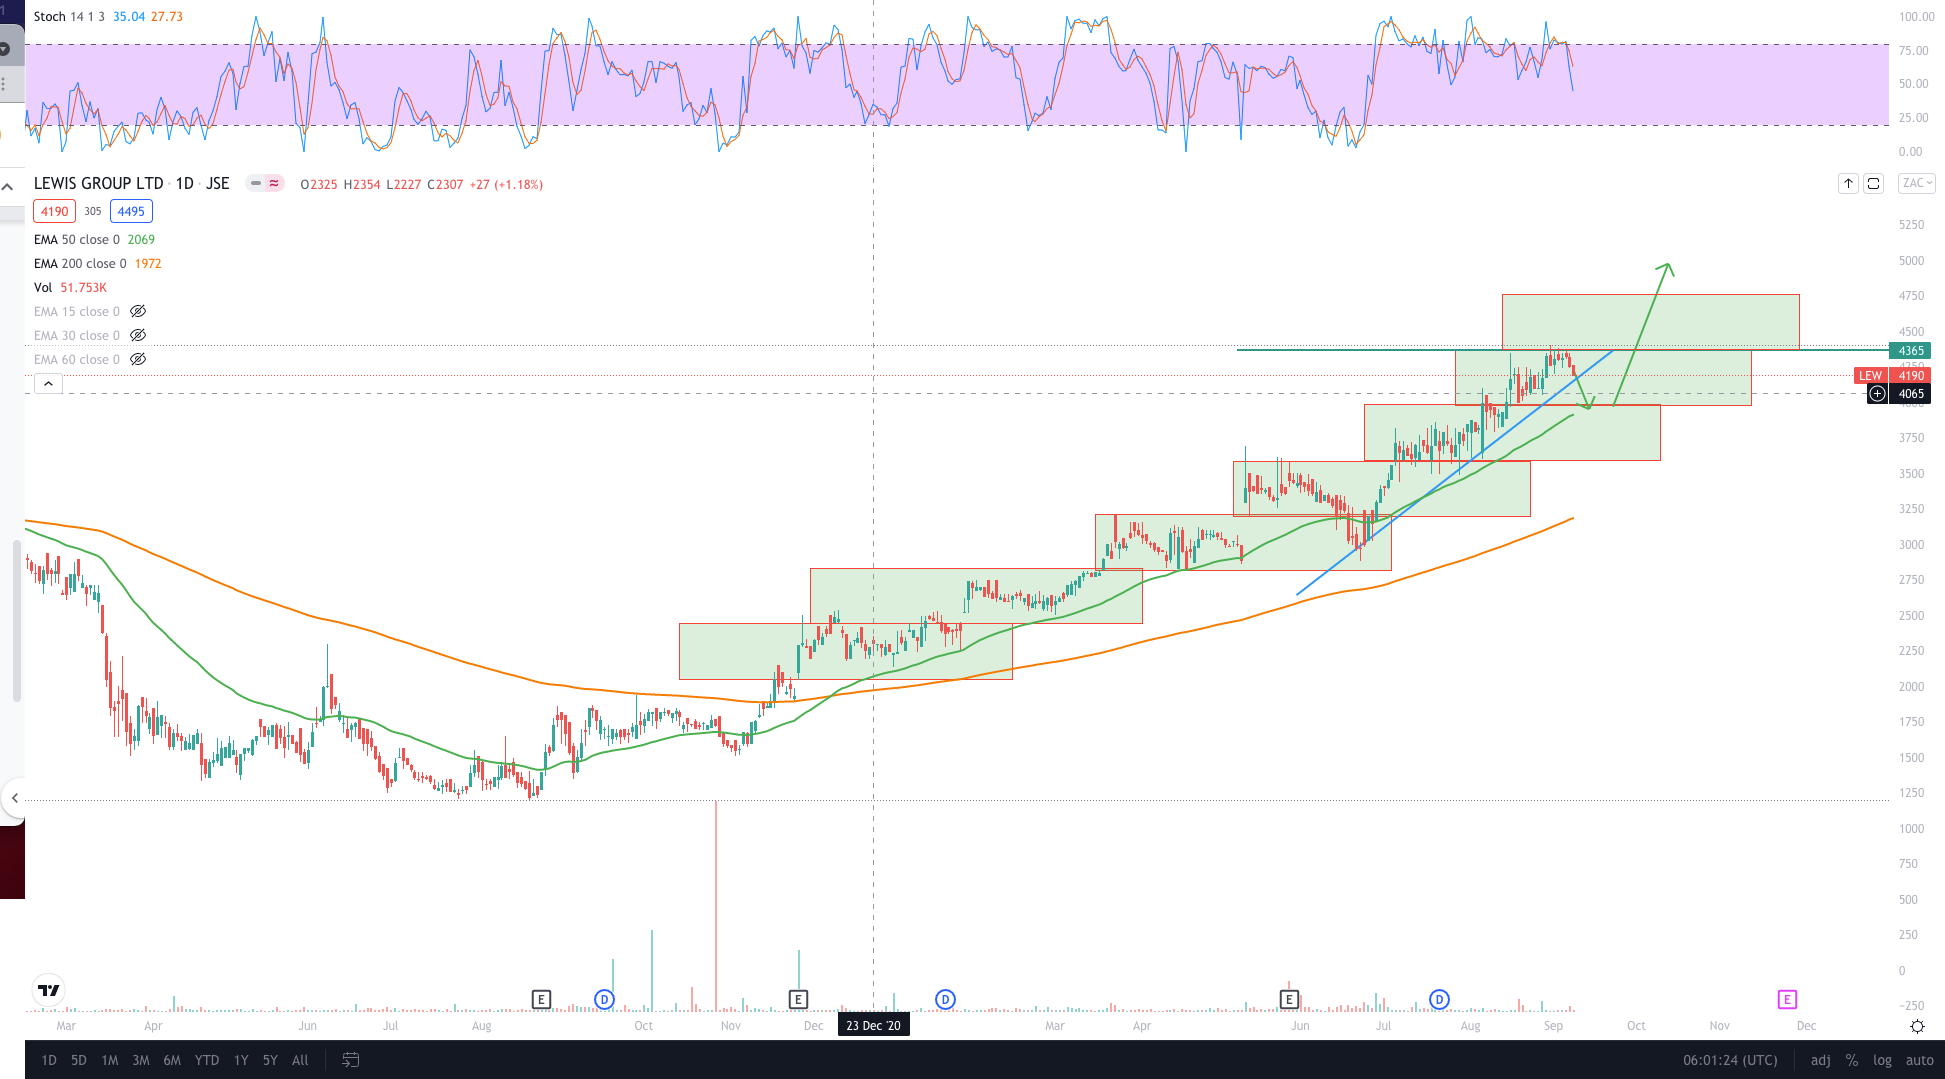
What’s been happening lately? Let’s zoom into the daily
It’s as if the box theory was built around the stock. The stock has been stacking the boxes like a pyramid. If the market violates the trend line. The stock could retrace back to the 50 day EMA around the R39 long term support. For now the status for Lewis is hold and/or wait for a break to a higher box above R43.
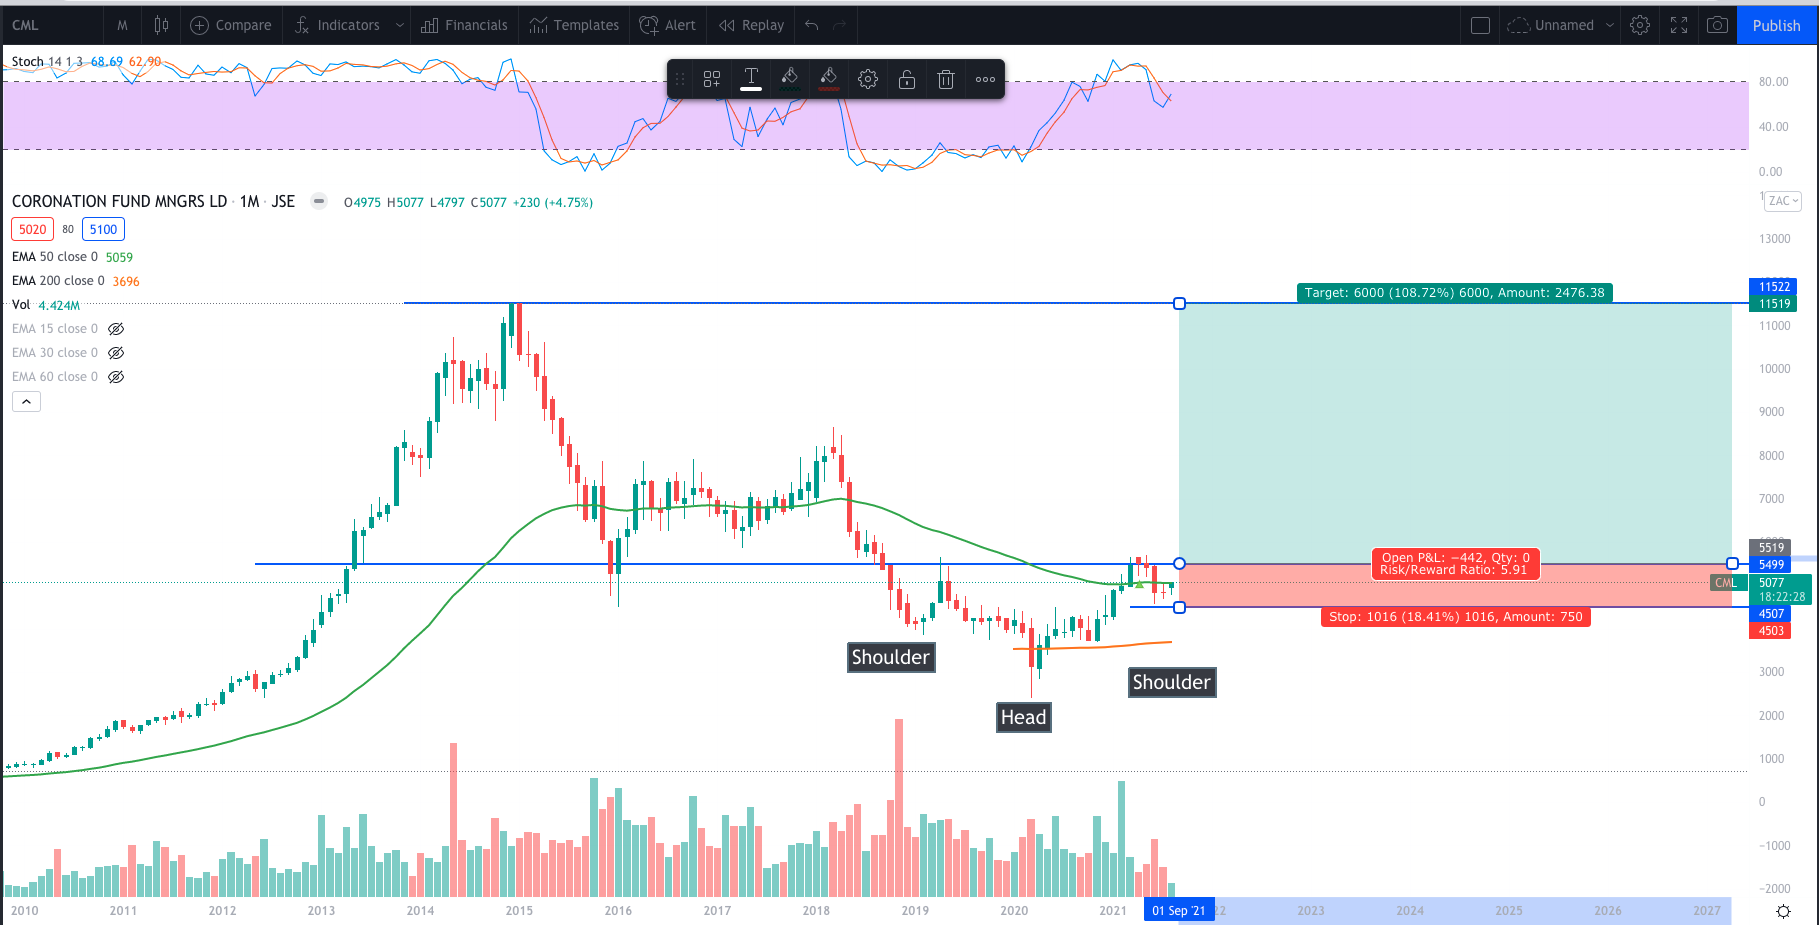
We have an inverse head and shoulder pattern. The right shoulder holding the 50 month EMA. If the stock is to have a go at the R115 highs these levels are about where levels provide an interesting 5.9 risk:reward long term opportunity. If the stock takes out the R55 neckline. With a long term stop loss at around R45. This is mildly interesting let’s have a look.
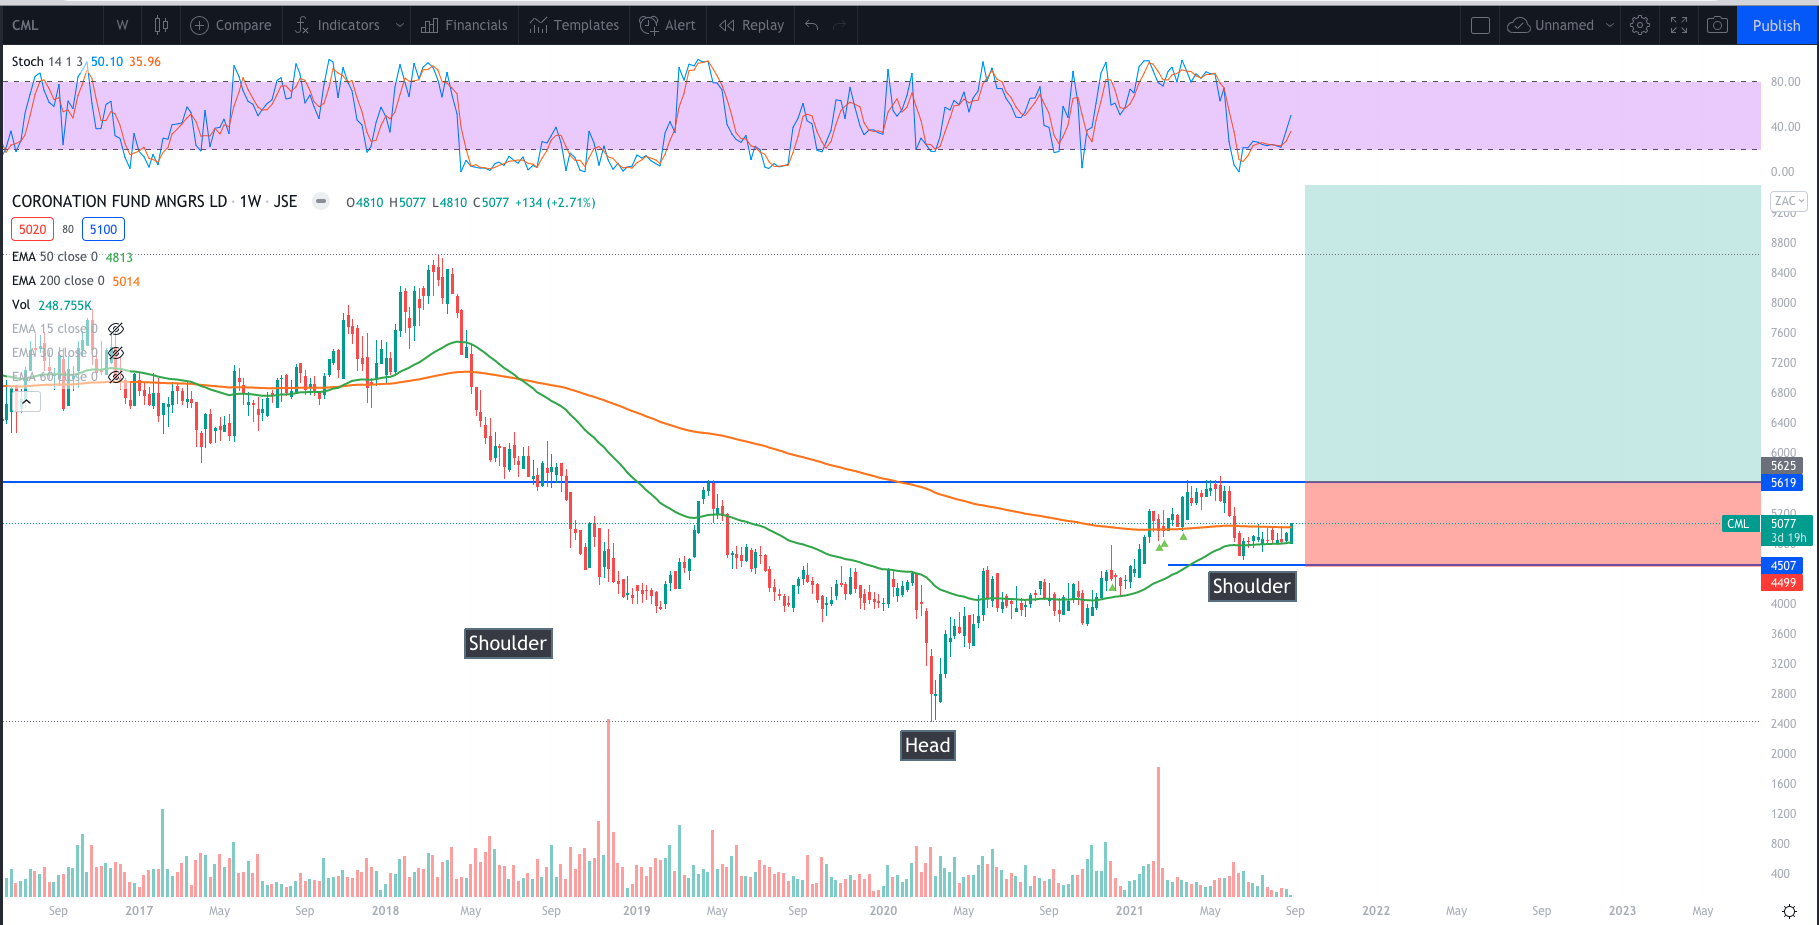
The weekly chart
Tug of war between buyers and sellers at around the 50 and 200 week EMAs. 50 week EMA quite close from triggering a golding cross.
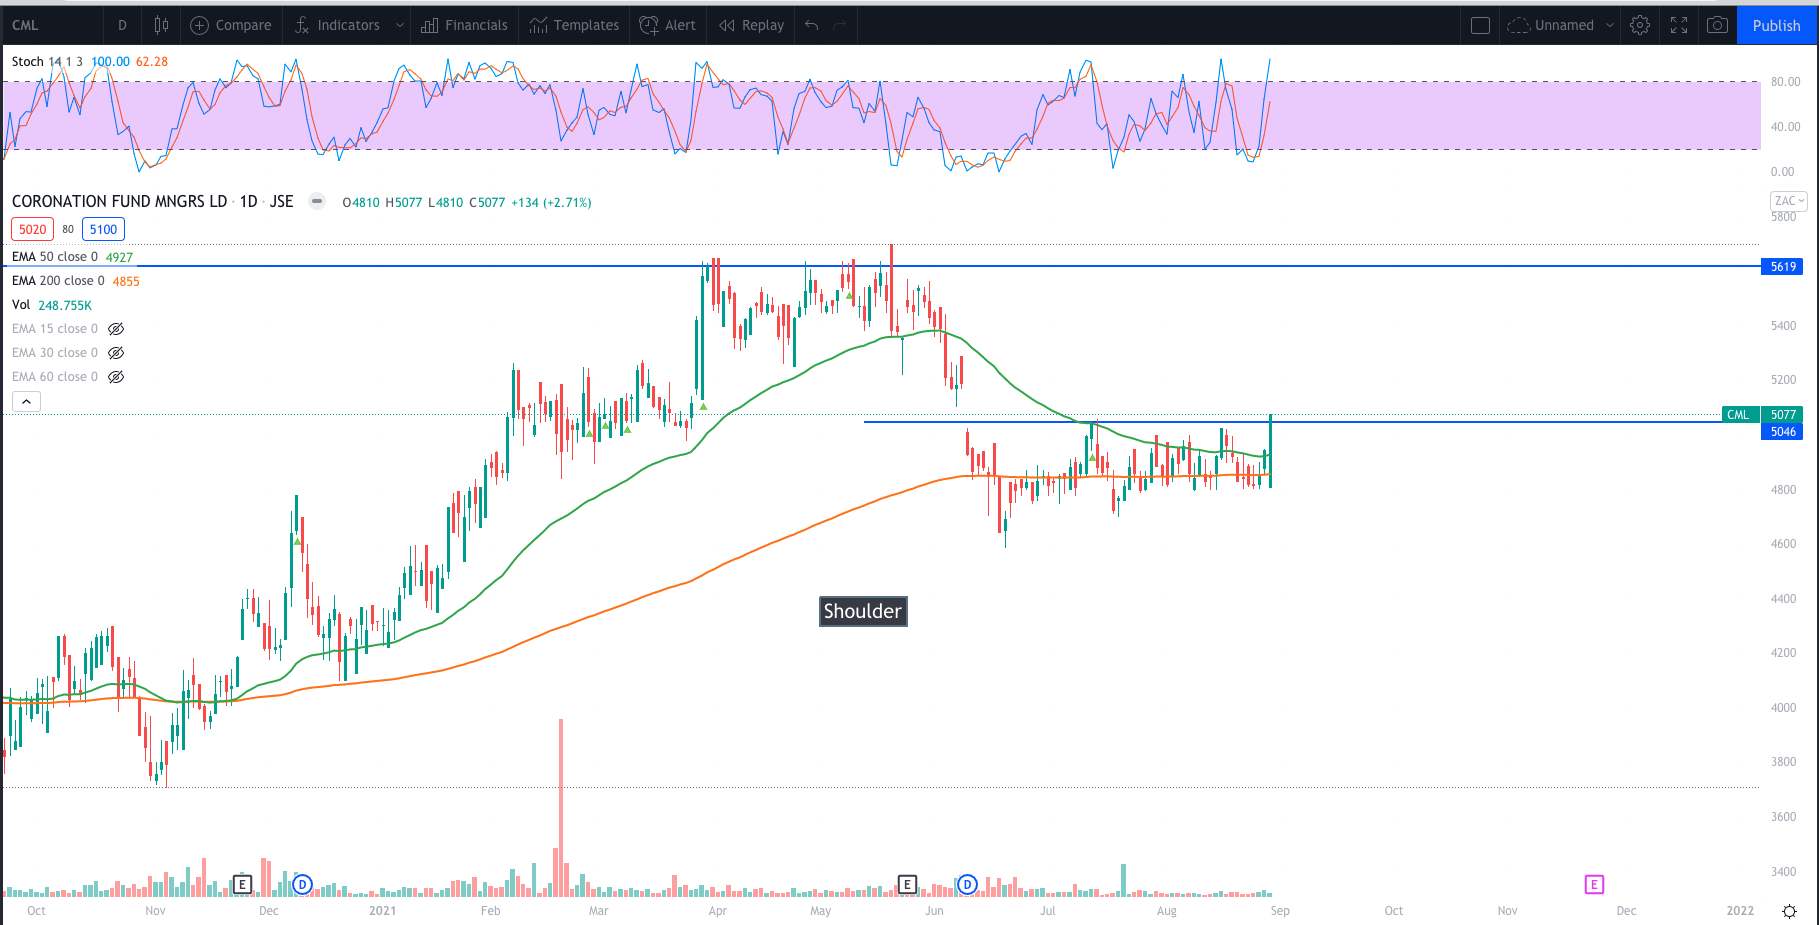
Let’s look at the daily chart to see who’s winning
The stock broke out of the “war’s” range with a bullish engulfing candle. Engulfing pretty much the entire range. Closing back above the 50 day EMA. On Monday 30 August 2021 Good time to start building a position with an anticipation of the head and shoulders trade. That provides a better risk reward opportunity of about 16. If the stock then closes above R55 then continue building the position.
 Looking at the Daily chart.
When a stock starts to move to new multi year highs. I like drawing boxes inspired by Nicolas Darvas. Aspen has been breaking to higher boxes with relative ease. The stock is currently within the R184 – R200 having just got in it recently. At the moment Aspen is at holding status. Waiting to see how the stock will behave around R200. If the stock breaks R200 it’s time to buy the stock again. While being on the lookout for continuation patterns between R184 – R200. Not forgetting a stop loss be R184 – R200 after the breakout.
Looking at the Daily chart.
When a stock starts to move to new multi year highs. I like drawing boxes inspired by Nicolas Darvas. Aspen has been breaking to higher boxes with relative ease. The stock is currently within the R184 – R200 having just got in it recently. At the moment Aspen is at holding status. Waiting to see how the stock will behave around R200. If the stock breaks R200 it’s time to buy the stock again. While being on the lookout for continuation patterns between R184 – R200. Not forgetting a stop loss be R184 – R200 after the breakout.
 Wind at the back
The stock broke a longer term downtrend and broke above the 50 month EMA. Now that’s the dip I like to buy
Wind at the back
The stock broke a longer term downtrend and broke above the 50 month EMA. Now that’s the dip I like to buy

