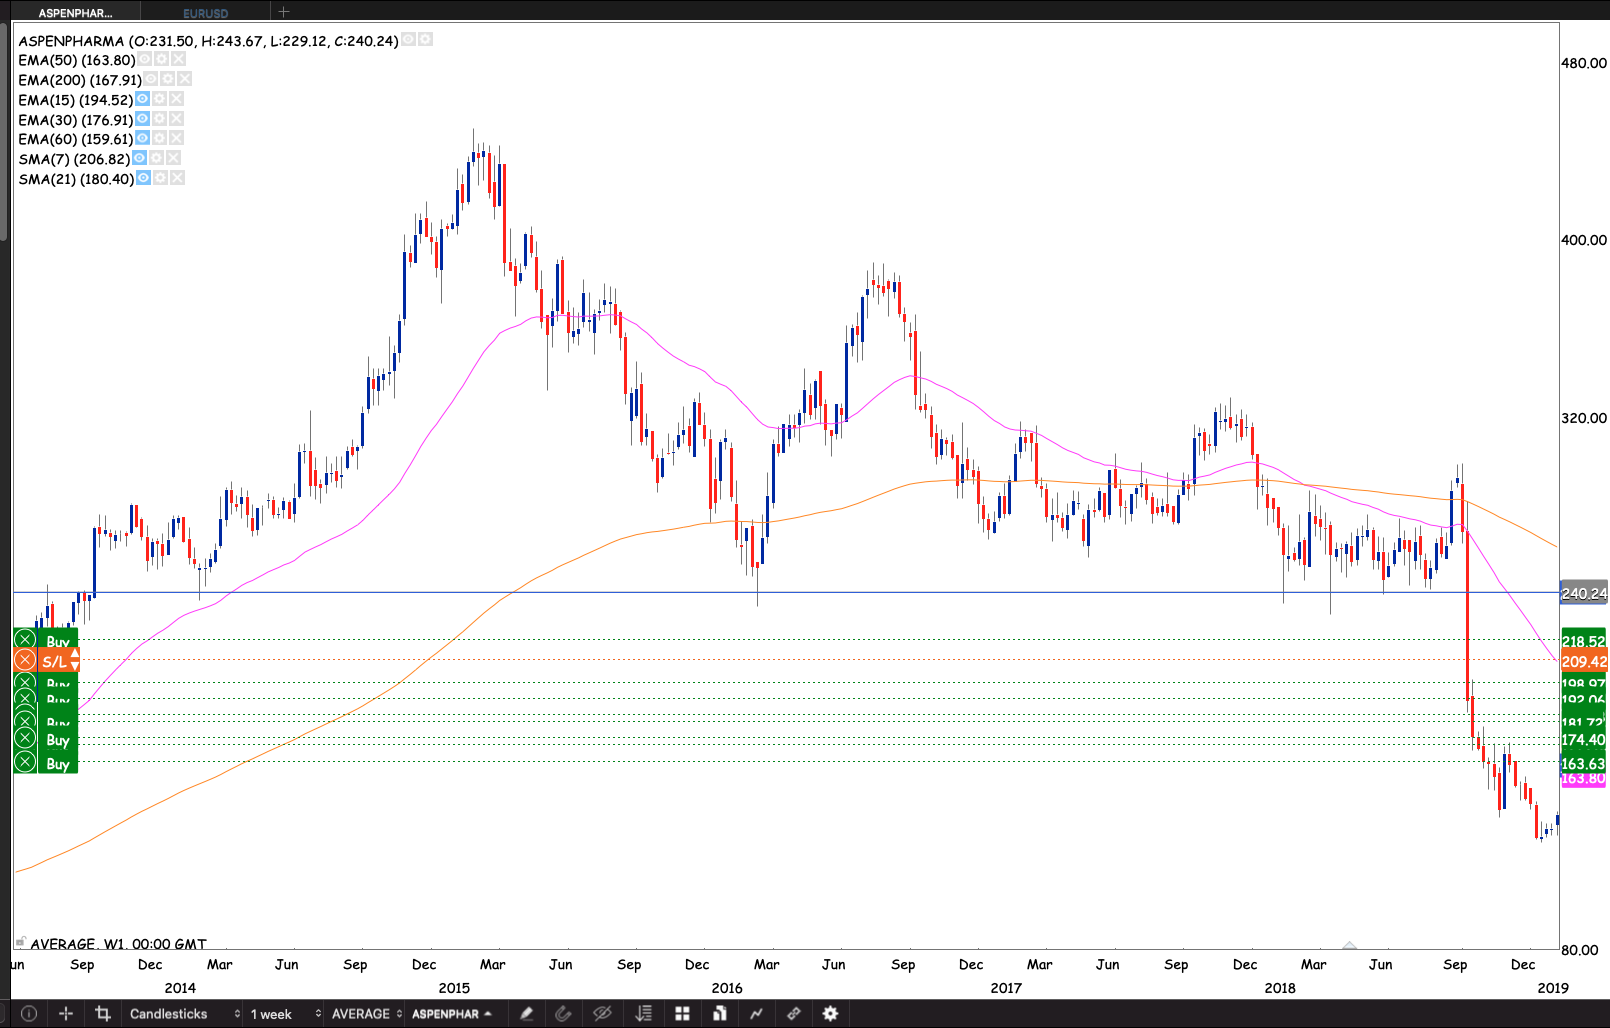
Management issued a trading updating expressing intentions of reducing gearing levels. Since then the company reduced its debt levels by an average of 33.5% with the significant portion of that debt reduction coming from the period ending June 2021. The company reported net borrowing reduction of R35.2 billion and brought back dividends. It’s important to note that management achieved this without ever diluting shareholders. .
The stock never saw a daily close above R240 until the close on 21 September 2021 (ex-div) with a bullish engulfing candle. The market gapping down on ex-div but recovering all the dividend amount and then some. Closing at R240.24. Since the breakout from the long base. I’m expecting a fair bit of dancing around between R240 – R245. I’m also expecting the market to remember the R268 level
Above R240 the odds of the stock going back to the R430 highs are pretty good.
I’ve been buying on the up since R163.
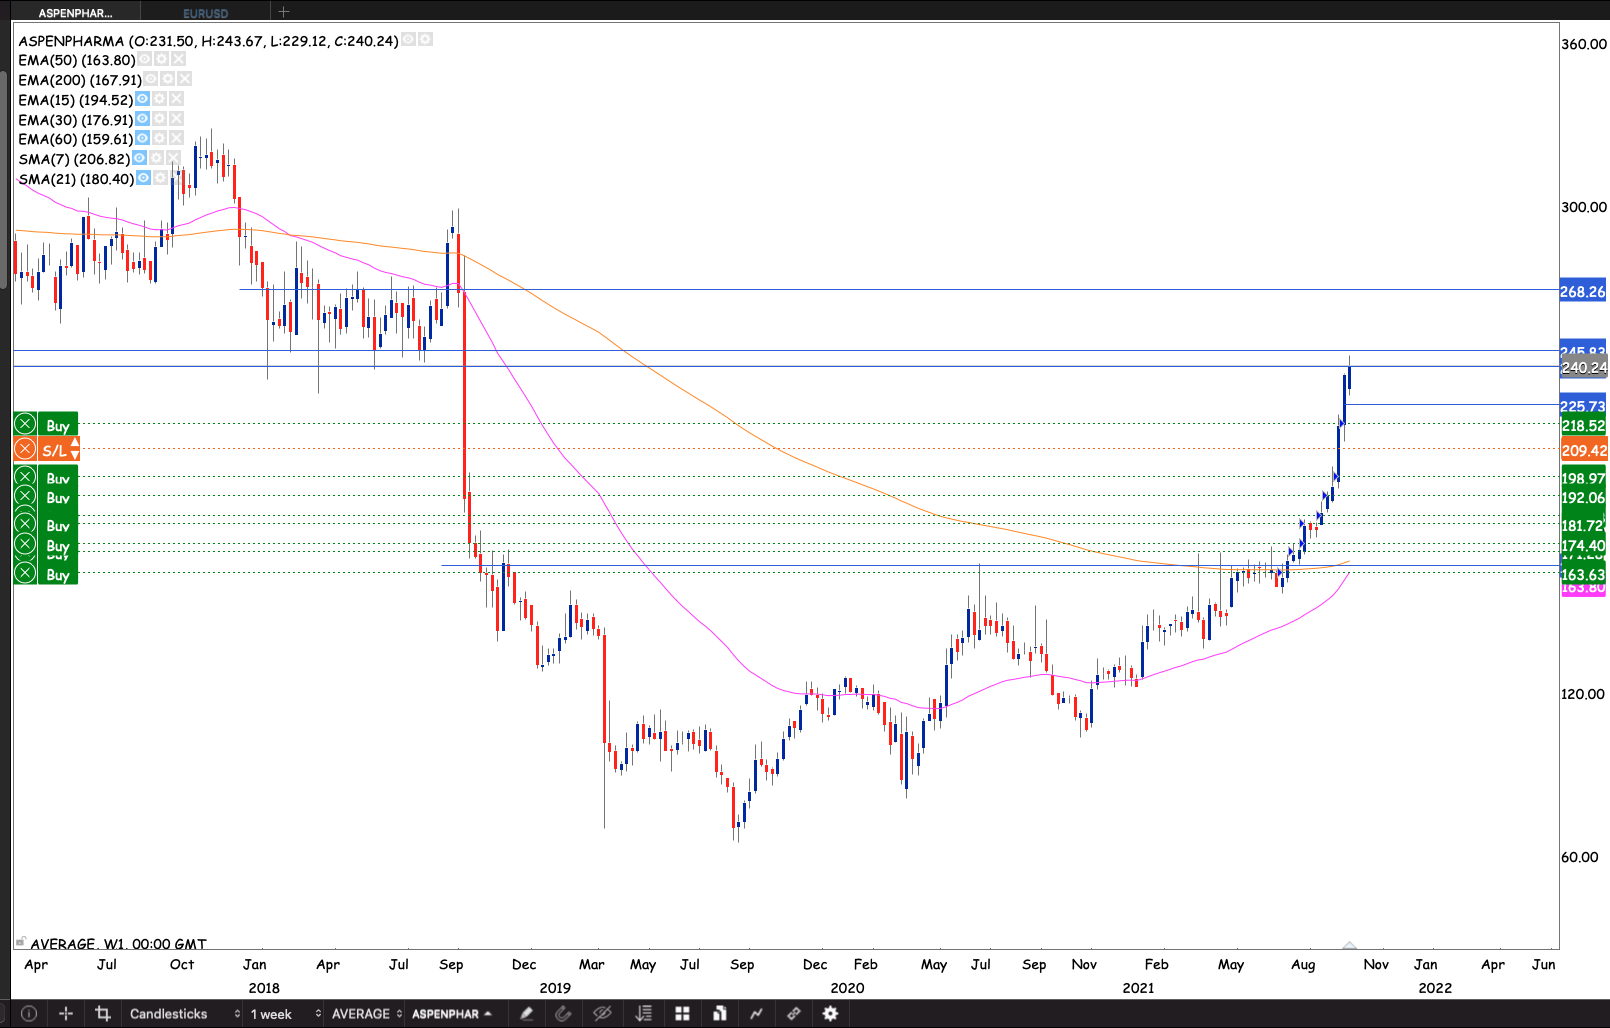
Daily chart
With the market closing through R240 by a few cents with a bullish engulfing candle. Adding another purchase of the stock to the portfolio keeping my stop loss at arms Length at R209.42. Expecting the market to remember the R240 level selling off a bit. Once the stock is above R245.80 I will raise stop loss to R225
Mr Price was one the companies that came out on the other side of the pandemic stronger than most. The company made two notable acquisitions in Yuppiechef and Power fashion. The company issued a trading update on the 7th of August. Retail sales were up 48.8% (38.6% excluding Yuppichef and Power fashion) in the quarter. The investments are seemingly proving to be good investments.
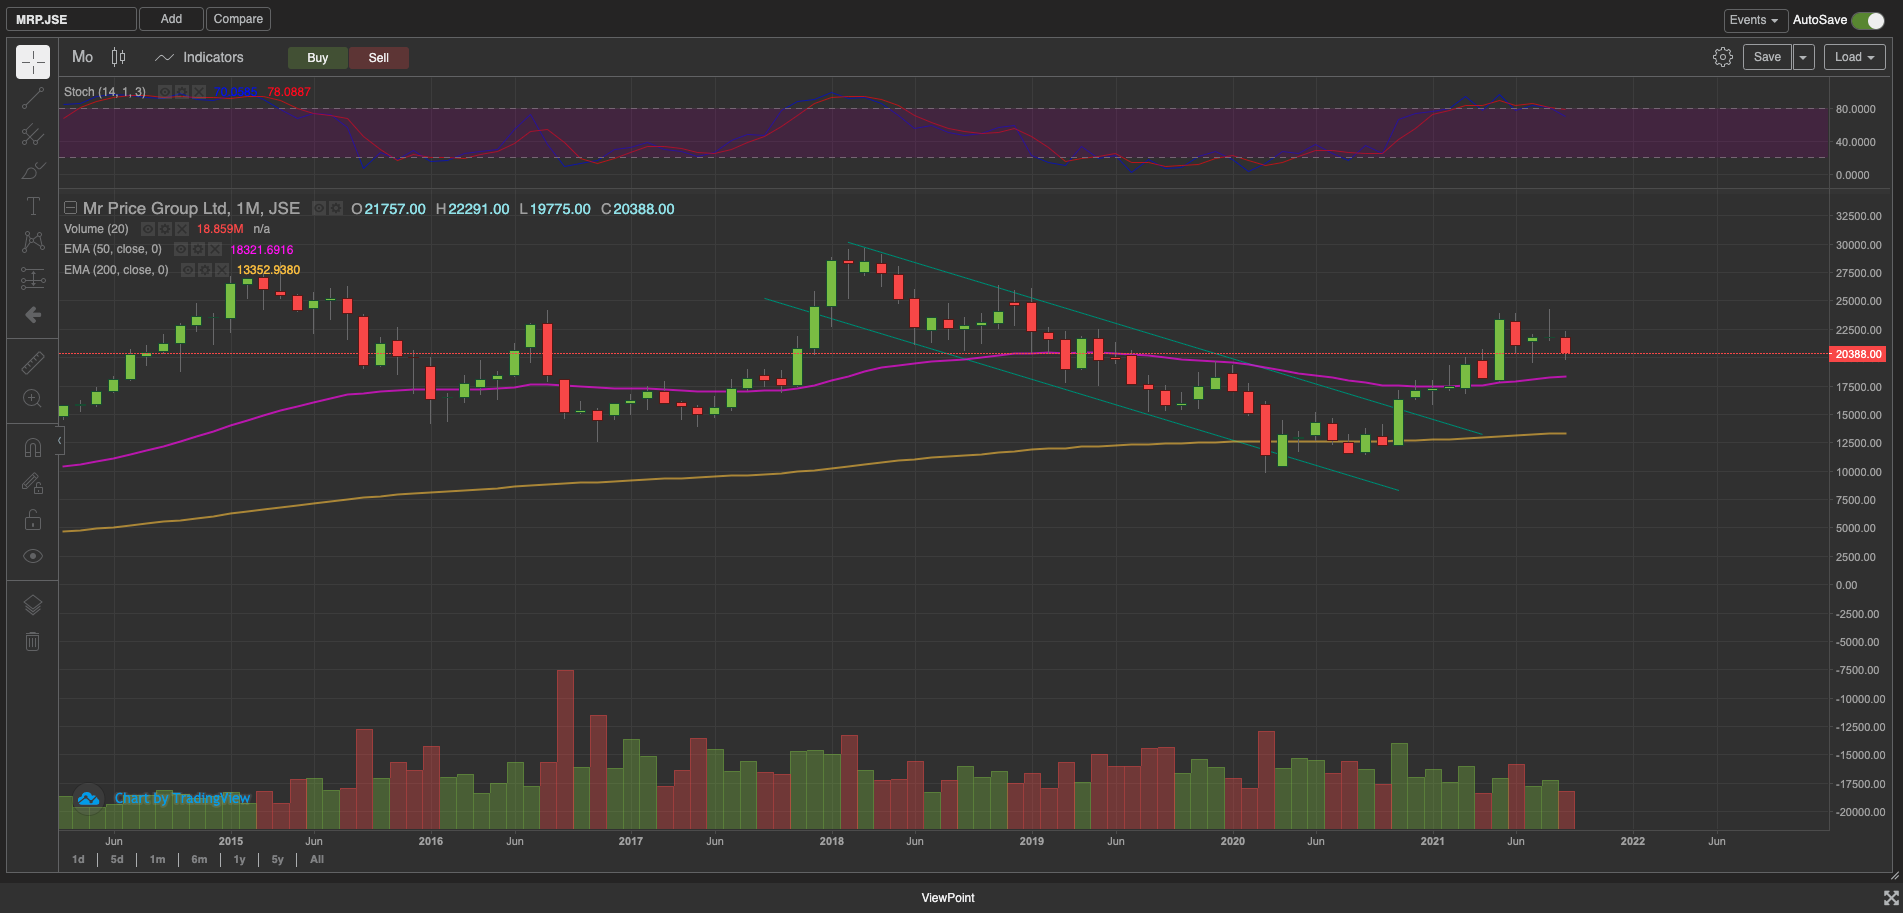
The stock was defended by the 200 month EMA holding it well. Coming back above the 50 day EMA as well.
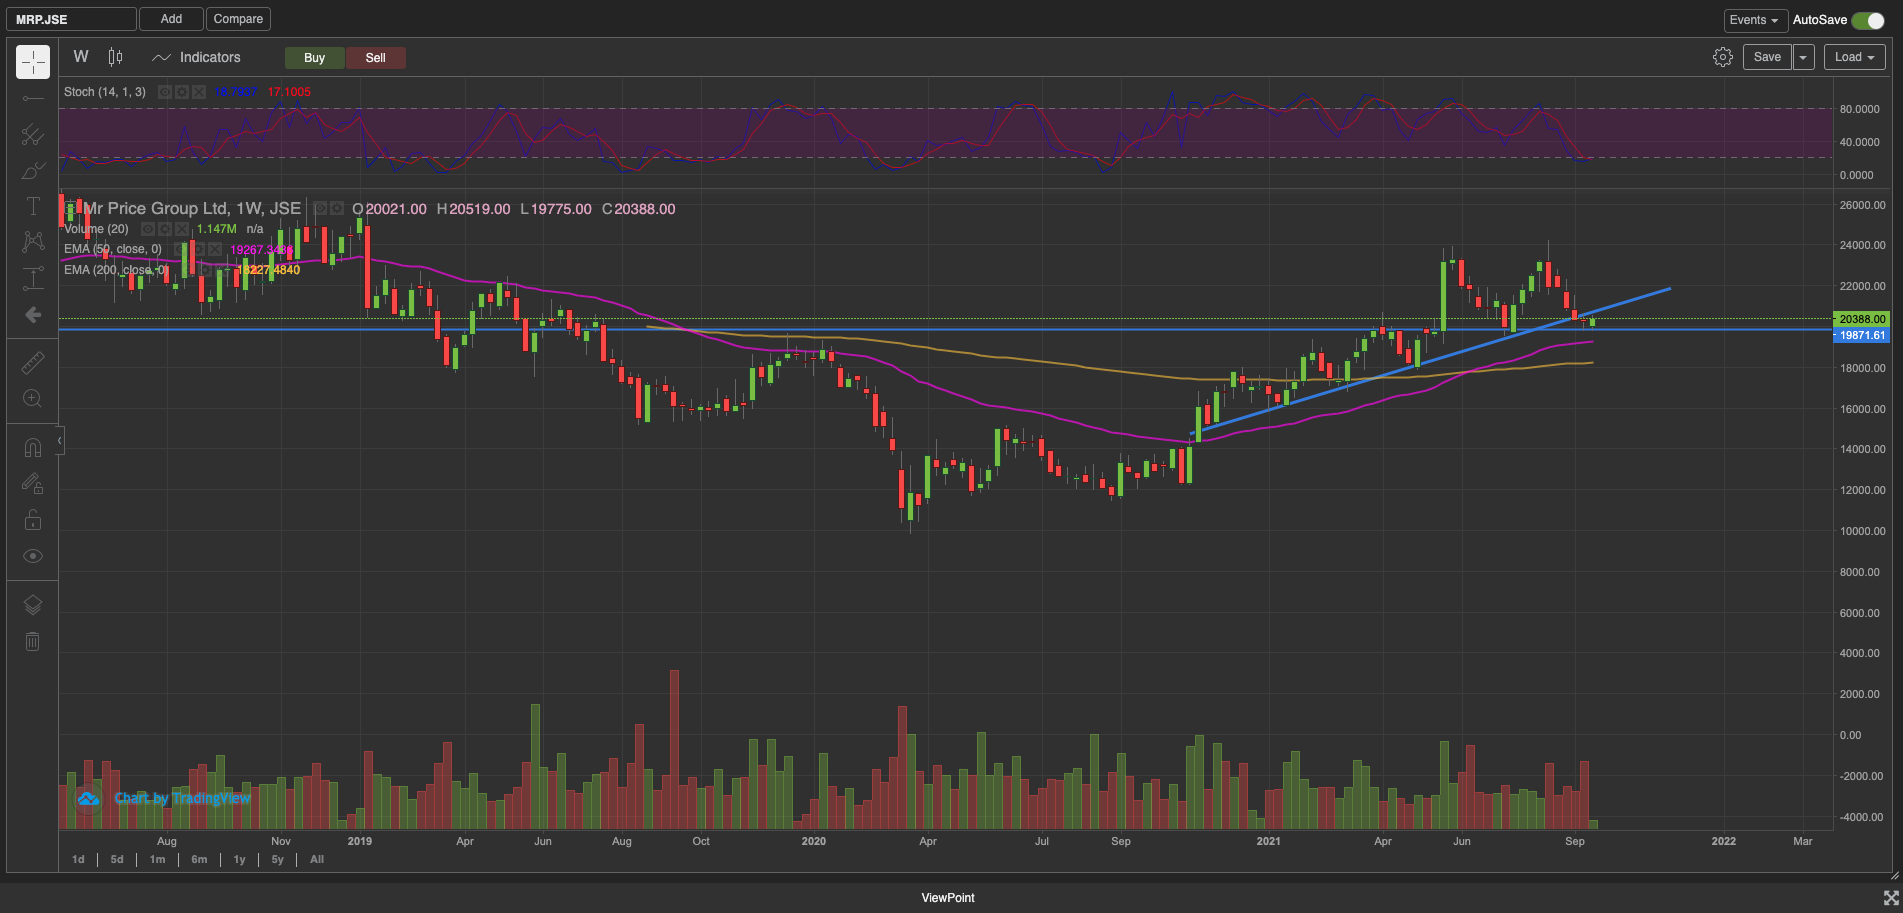
Zooming into the weekly chart.
We have a golden cross on the weekly chart. The corrected back to around the 50 week EMA. Holding the R198 which the stock held after the correction. Violating the trendline slightly. But not by very much.
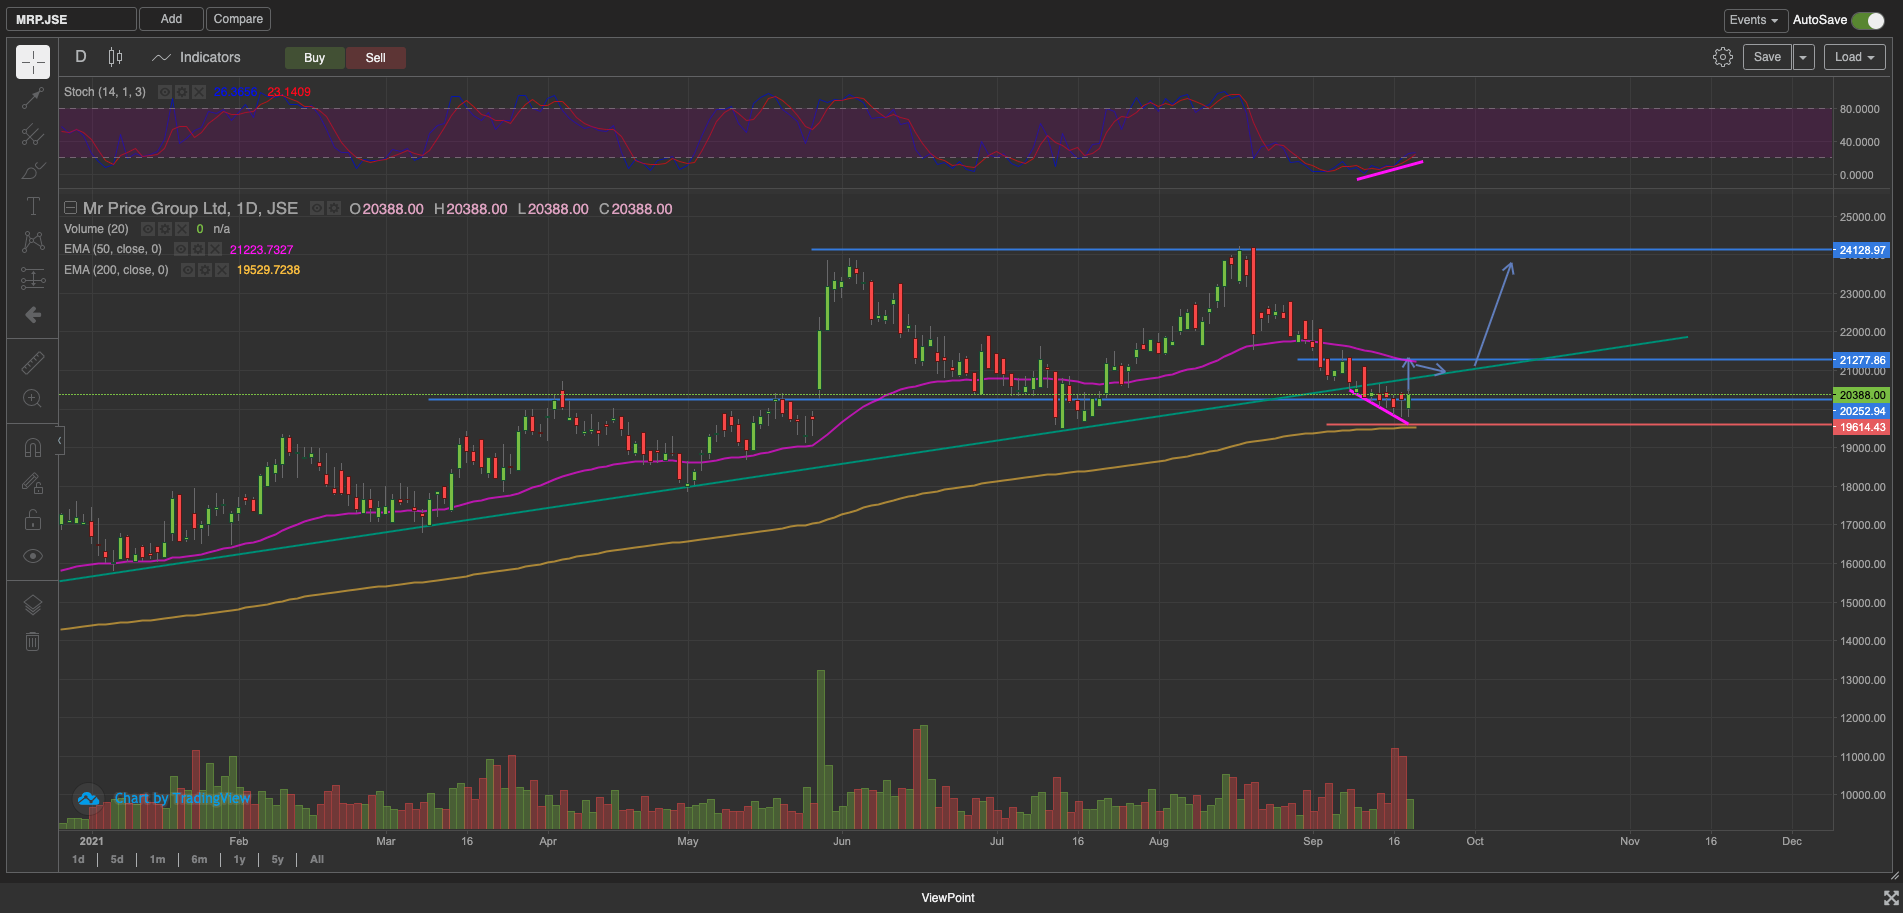
Let’s look a bit closer.
The stock has a bullish divergence at the stock is repelling from the 200 day EMA. If the stock can come back above R205 without making a new low. The stock provides a great opportunity with a tight stop around R196 just below the 200 day EMA. The odds for a strong rally are greater above R240. That rally would be backed by further growth in retail sales as we go into the festive season. We’ll see the cash flow from the acquisitions particularly the Power fashion investment. Possible debt reduction or better yet dividends back to shareholders.
Given the bullish divergence and the strong fundamentals from the company we’re likely to see a turn in the stock coming back above the uptrend support challenging the 50 day EMA, then test of the support from above. Great buy at these levels from long term investors for short term traders rather waiting for the trend line to become support again before buying in the stock. With a short term target of R240.
CUP AND HANDLE PATTERN
The cup and handle pattern is a bullish continuation pattern that can, on occasion, be a reversal pattern as well. It was developed by Willian O’Neil in 1988.
Formation
The first part of the pattern is the cup, which is a round bottom formation that typically trades away from the resistance level after touching it a few times before consolidation, forming the round bottom.
There will usually be a failed small break the market comes back to the resistance to consolidate again, to form the handle.
Handle consolidation, however, is much more shallow than the first. It will usually form another continuation pattern such as a bullish flag, falling wedge, pennant etc, before they break out.
The pattern does, at times, resemble the head & shoulders pattern. That’s because the chart patterns have a lot in common. They both show when up sellers temporarily “win” the battle. When sellers start showing some weakness, both patterns pick that information up in the formation of the handle or the right shoulder. It’s not surprising that these two patterns have a relatively high hit rate. However, the occurrence rate is relatively low.
Entry
You enter on the break the neckline/resistance. The more volume on the breakout, the better. I prefer to wait for a close above the neckline, and enter on the open of the next candle.
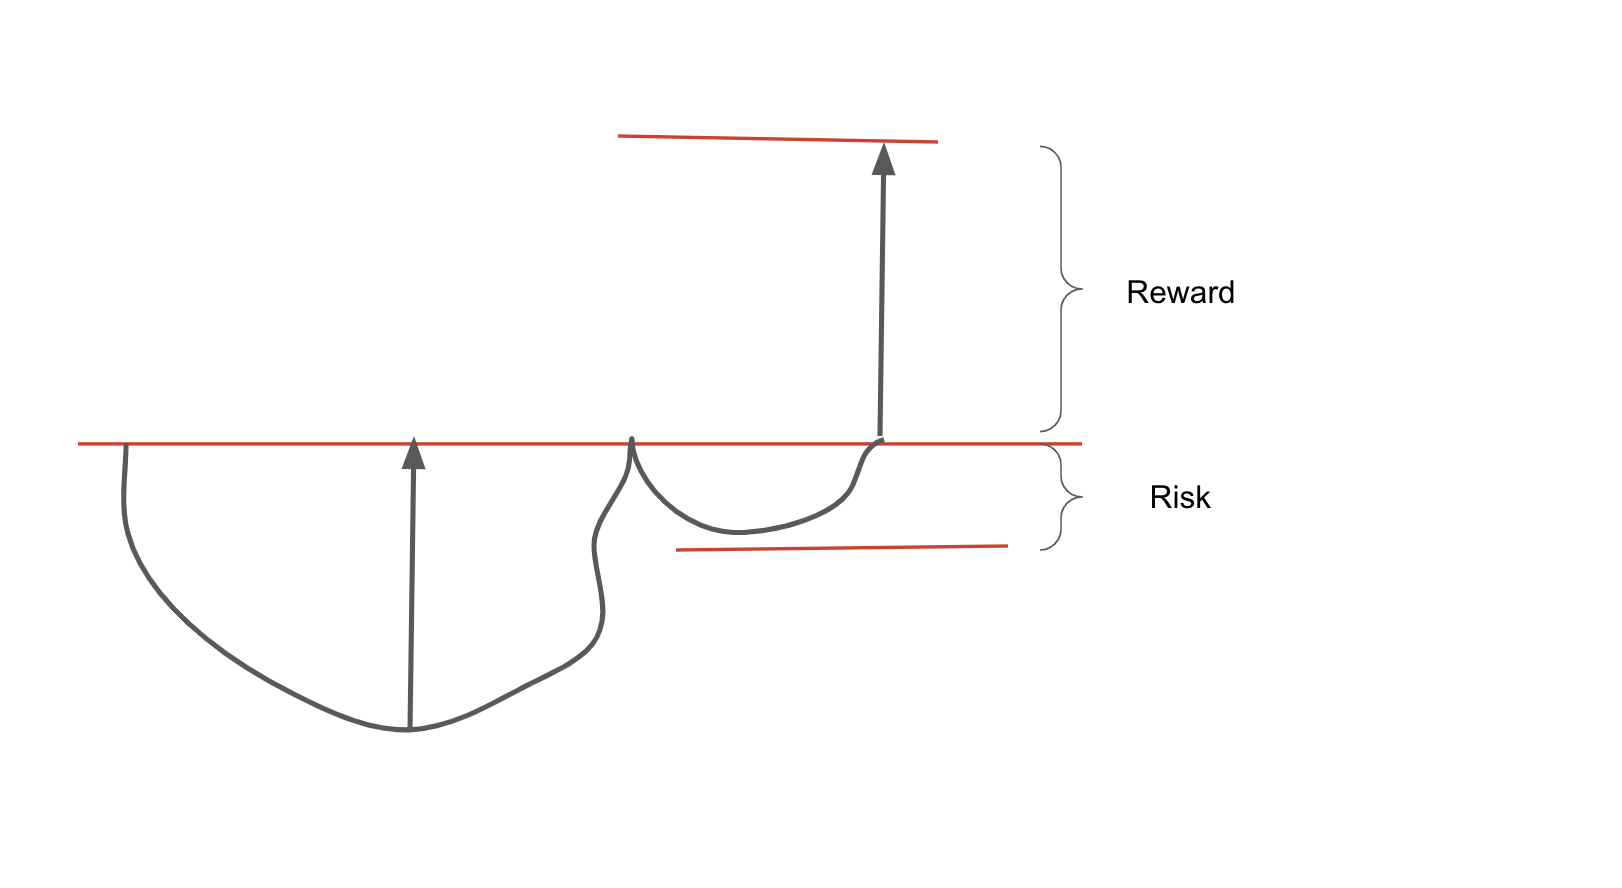
Stop loss & risk
Stop loss is then placed below the low of the handle. You can also place it below the low of the handle’s last low. I prefer placing it well below the entire handle, to give my stop some room to breath.
Target
The distance from the right pick to the low of the cup, projected from the breakout, will provide the target. It typically provides a nice 2:1 or 3:1 risk reward ratio.
If the sellers manage to take out the low of the handle, we know that they still have strength at least at the moment. I’m more than happy to take a second try if the chat breaks the neckline again.
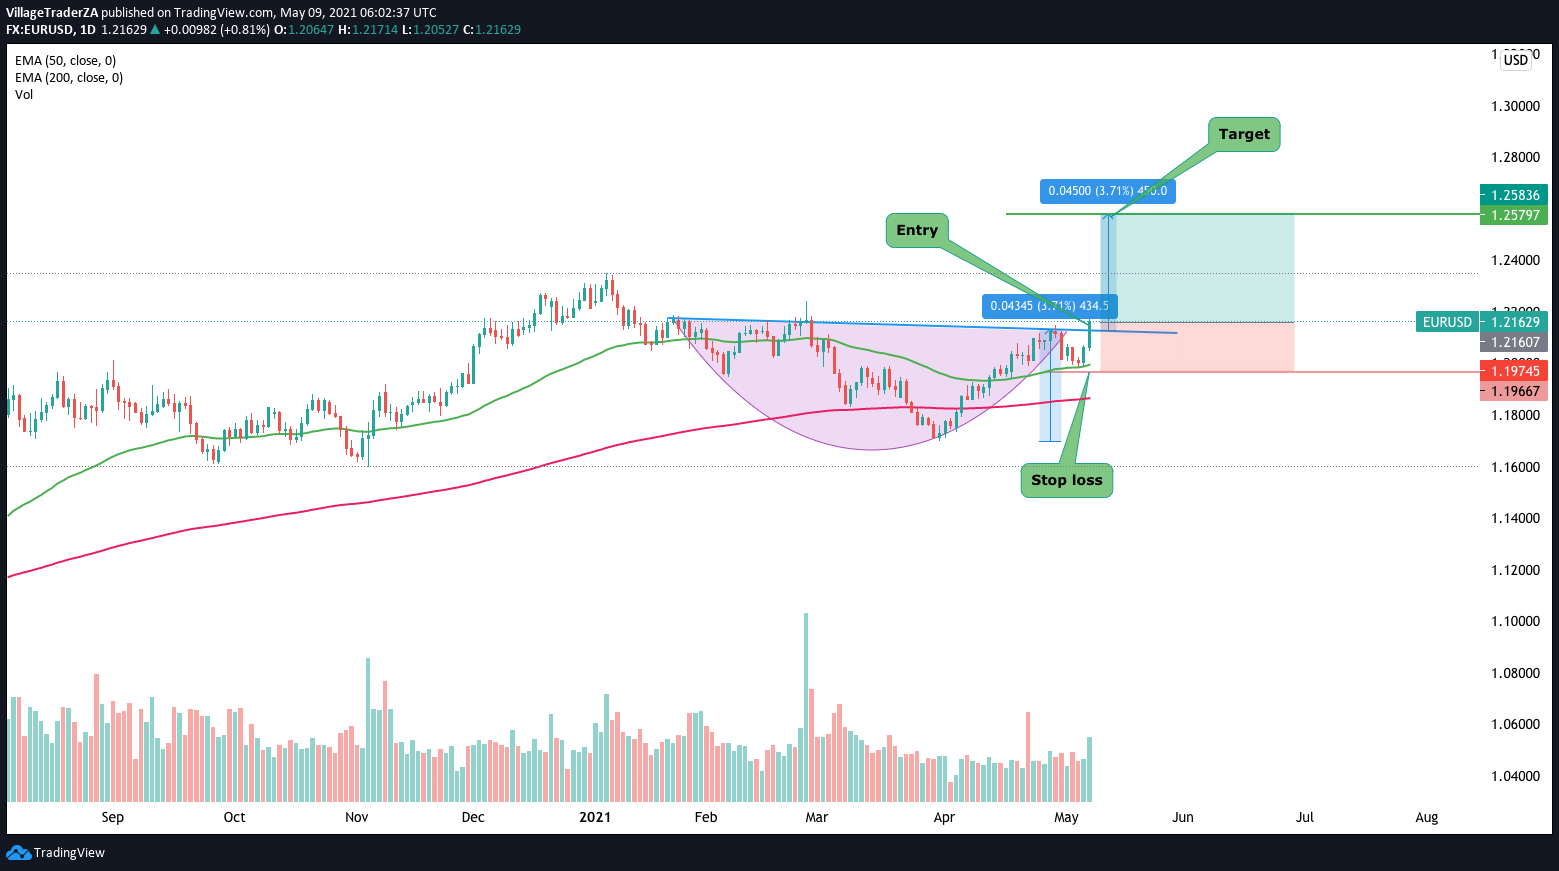
The above example happens to be the EURUSD chart that had a nice breakout recently.
Other considerations
As a continuation pattern, the cup would retrace about a ⅓ or ½ of the preceding uptrend. On rare occasions, it would trade up to ⅔ of the preceding trend. Usually the Cup holds the 200 MA as support and the handle will hold the 50 MA as support. Don’t get me wrong it could also be any ratio of slow and fast MAs.
The cup and handle has a low occurrence rate, which means it needs to be supplemented with other chart patterns. Importantly, even though one can trade multiple setups, they all need to fit with a broader set of system rules.
Conclusion
Even with a high hit rate, it doesn’t mean we should ignore the risk. Always have respect for risk.
Keep bets small and grow your equity slowly.
Another example
Glencore, weekly chart
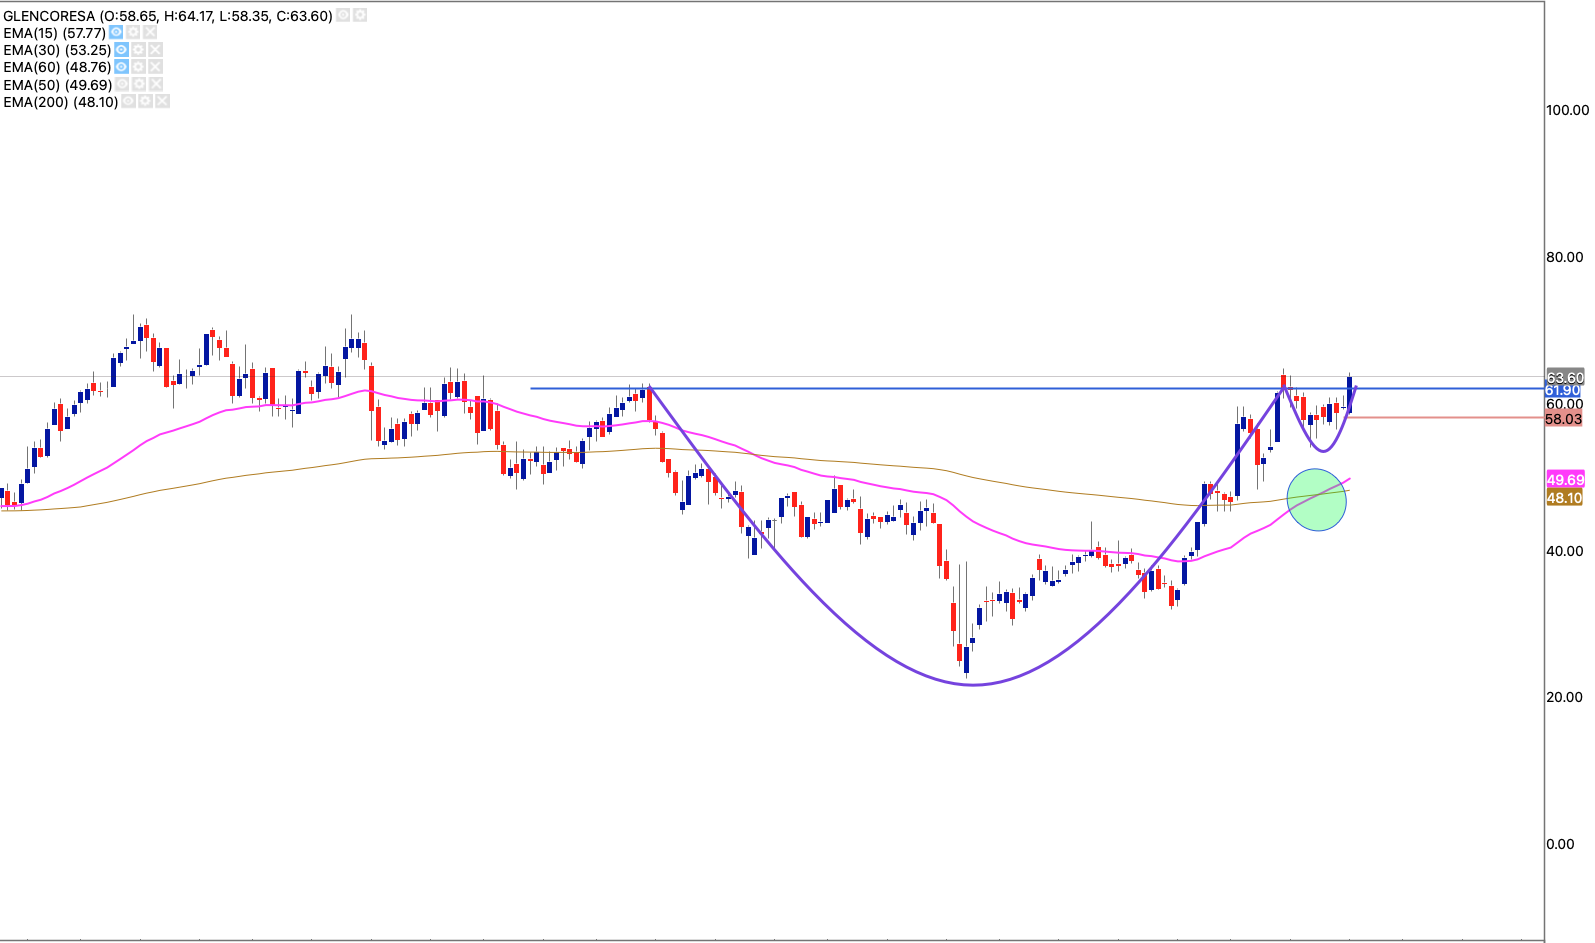
We have two variations of the flag. A normal and a horizontal flag.
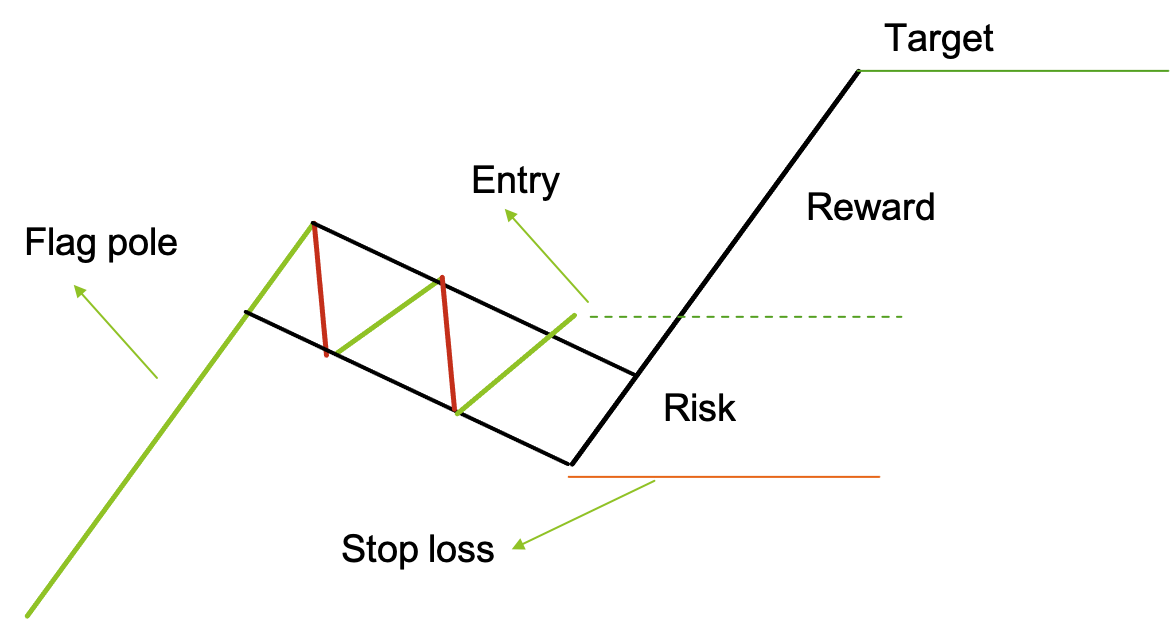
A normal flag as shown above is a pullback/pause after the market had been rallying. Consisting of support and resistance levels of lower highs and lower lows. We then wait for a breakthrough the resistance line. We enter on the break, placing the stop loss below the low of the flag structure. We use the height of the flag pole and project it upwards from the base of the flag. This pattern normally gives a 2:1 Risk: Reward ratio.
We have a horizontal flag variation of the flag.
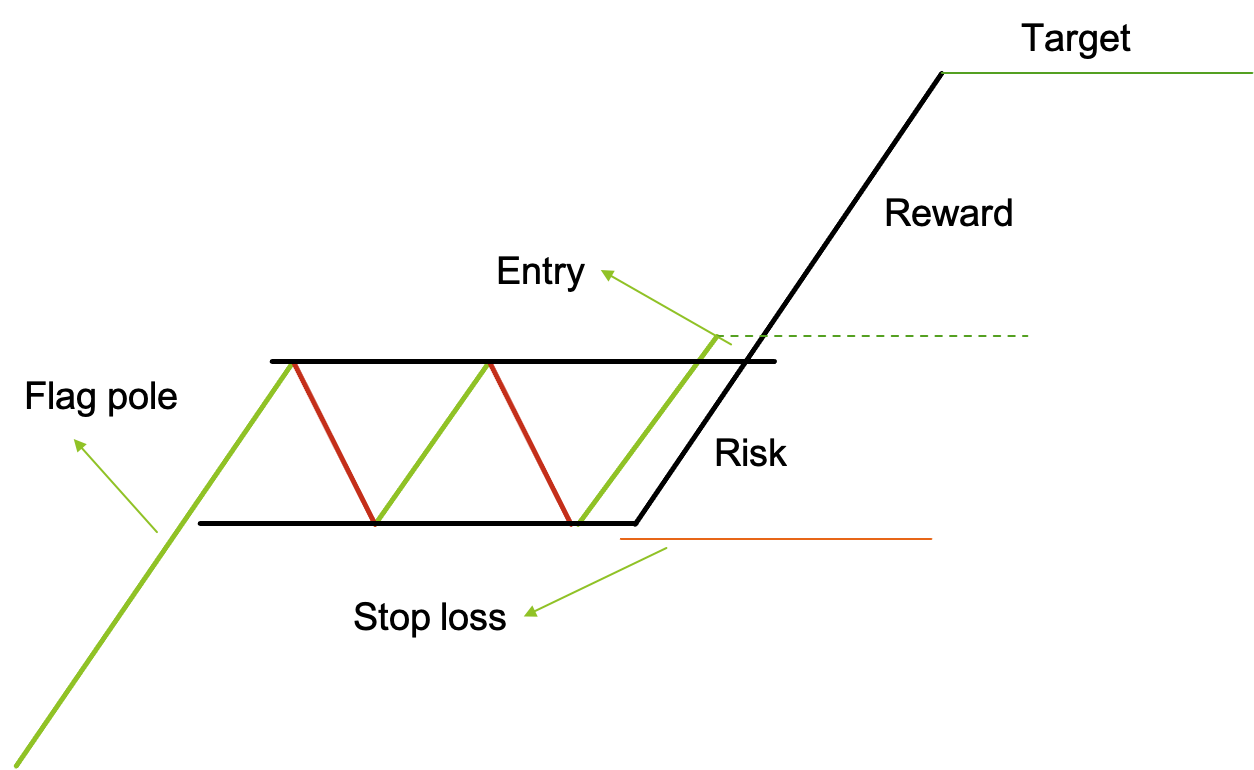
It’s quite similar to the normal flag except that it’s support and resistance lines of the flag are horizontal instead of slanted.
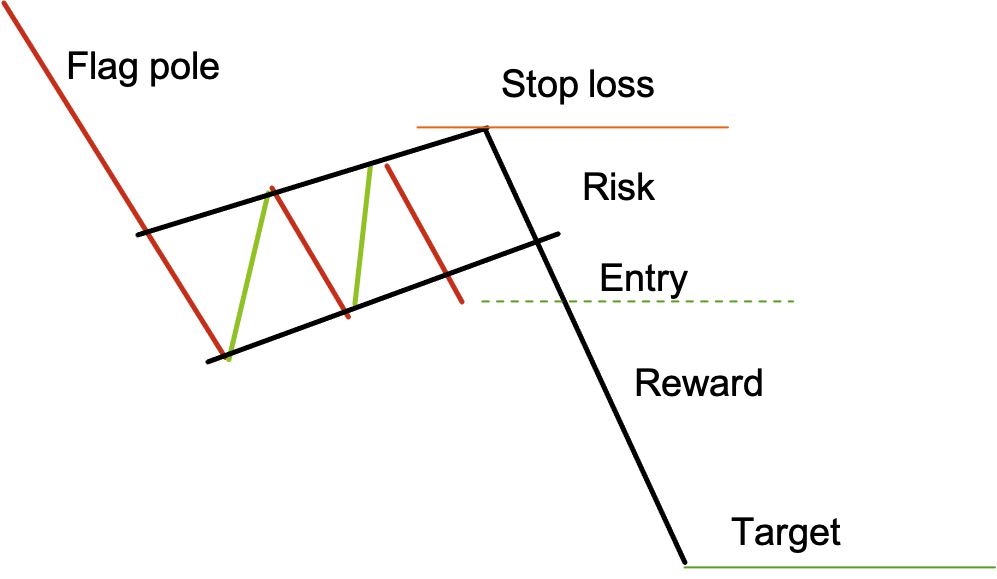
Bearish flag
The bearish variation works the exact same way except for the direction.
Normal bearish flag
Bearish horizontal flag