
Resources
Resources have been going higher even before the Russian invasion in Ukraine. In part because they were hard hit after the commodity boom leading to 2021. They’ve since found their respective bottom. The War has been just a catalyst and further pushed them even higher. With continued rising commodity prices. Miners will rise in price in anticipation of higher profit and higher dividends over the next few years. Miners with the cheapest holes, with low debt and high cash levels will be the biggest benefactors of rising commodity prices.
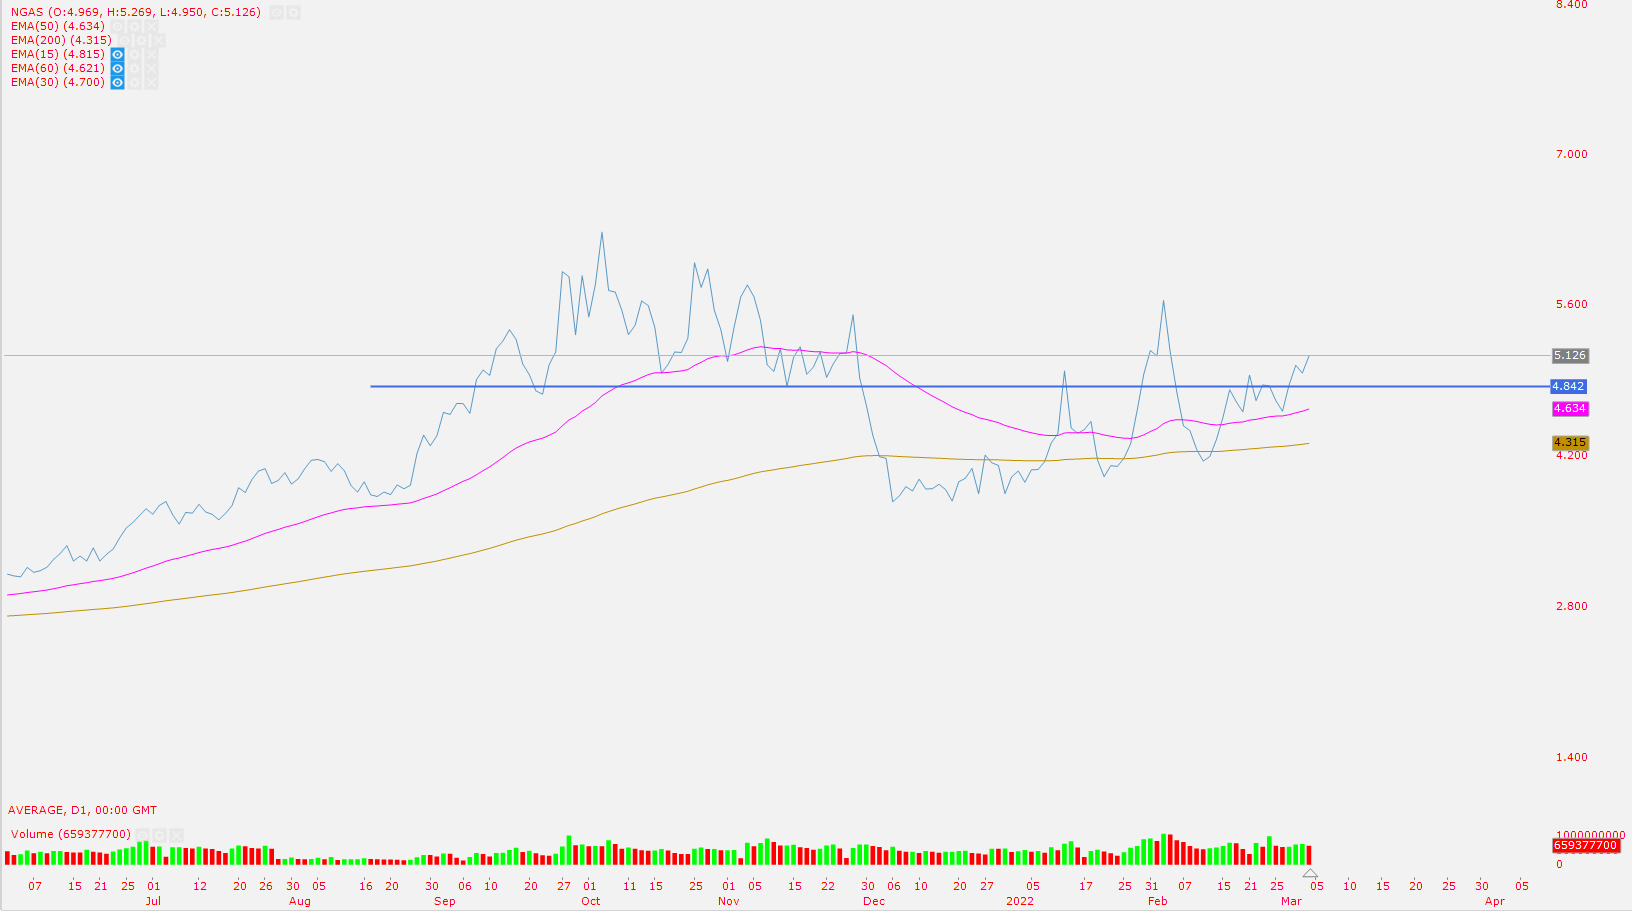
Natural gas
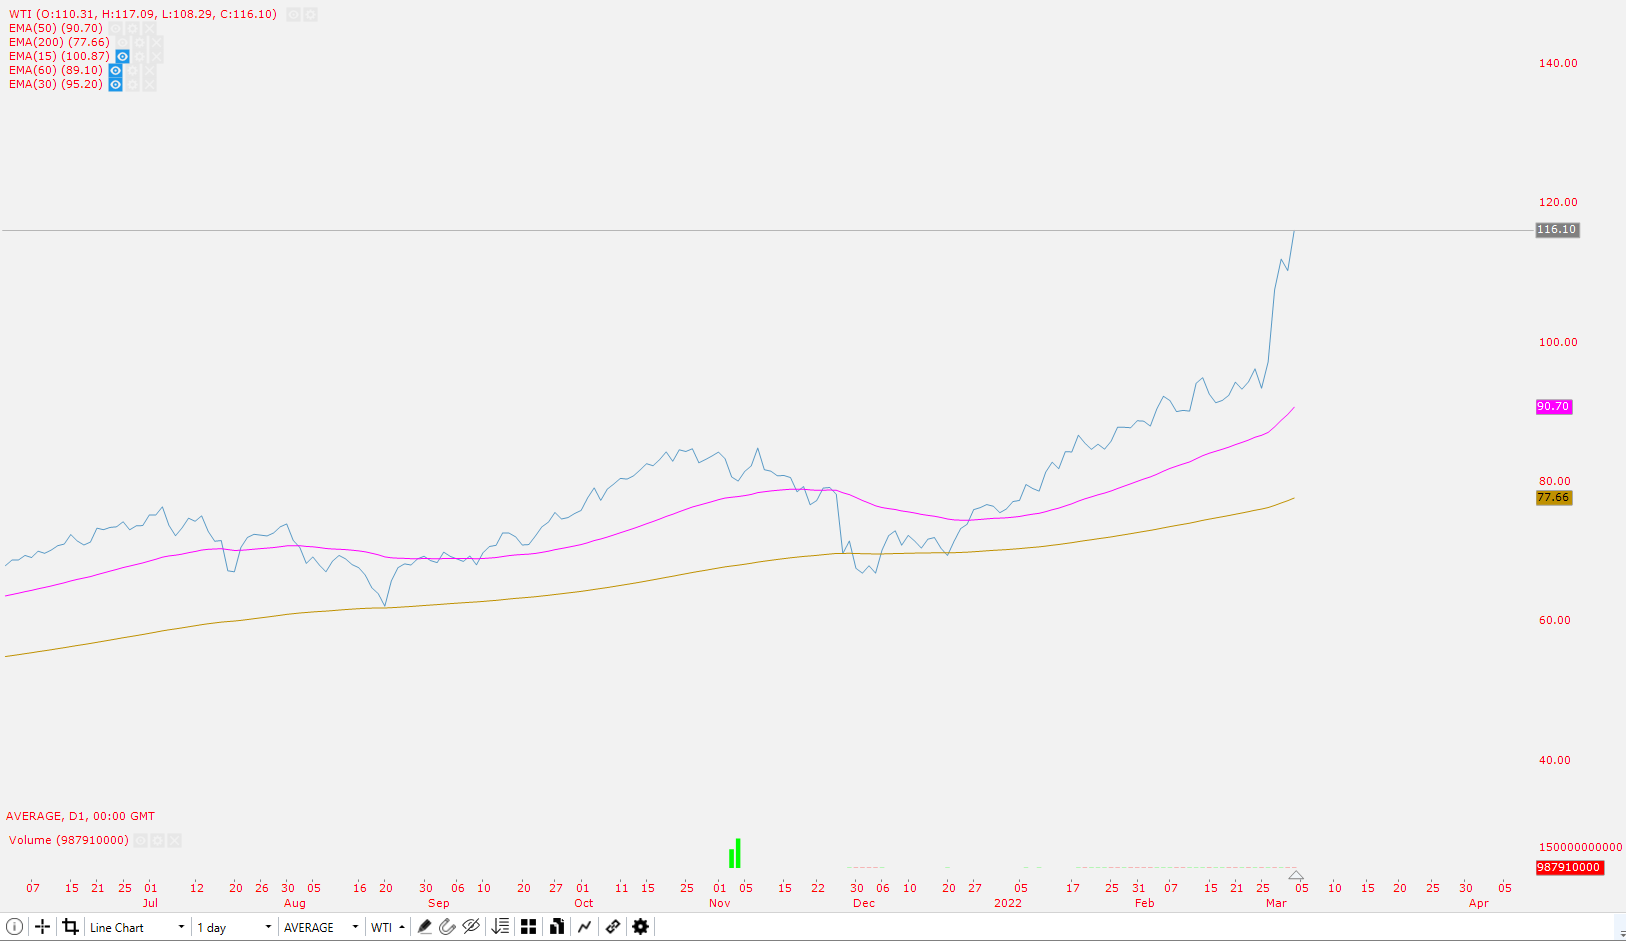
Oil
WTI
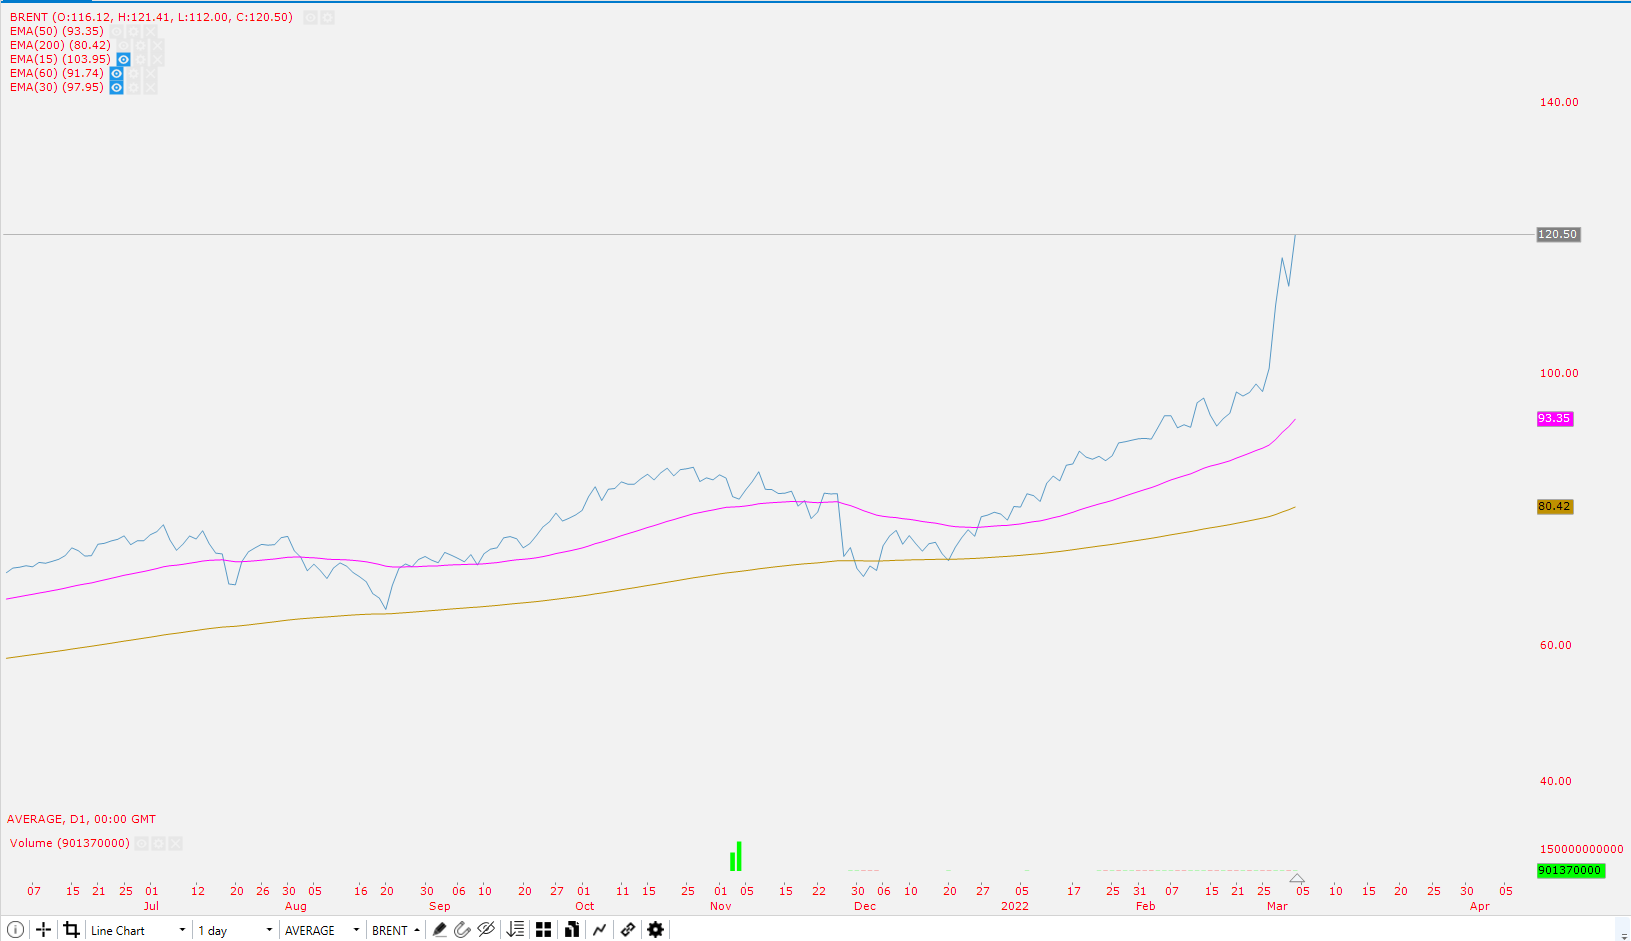
Brent
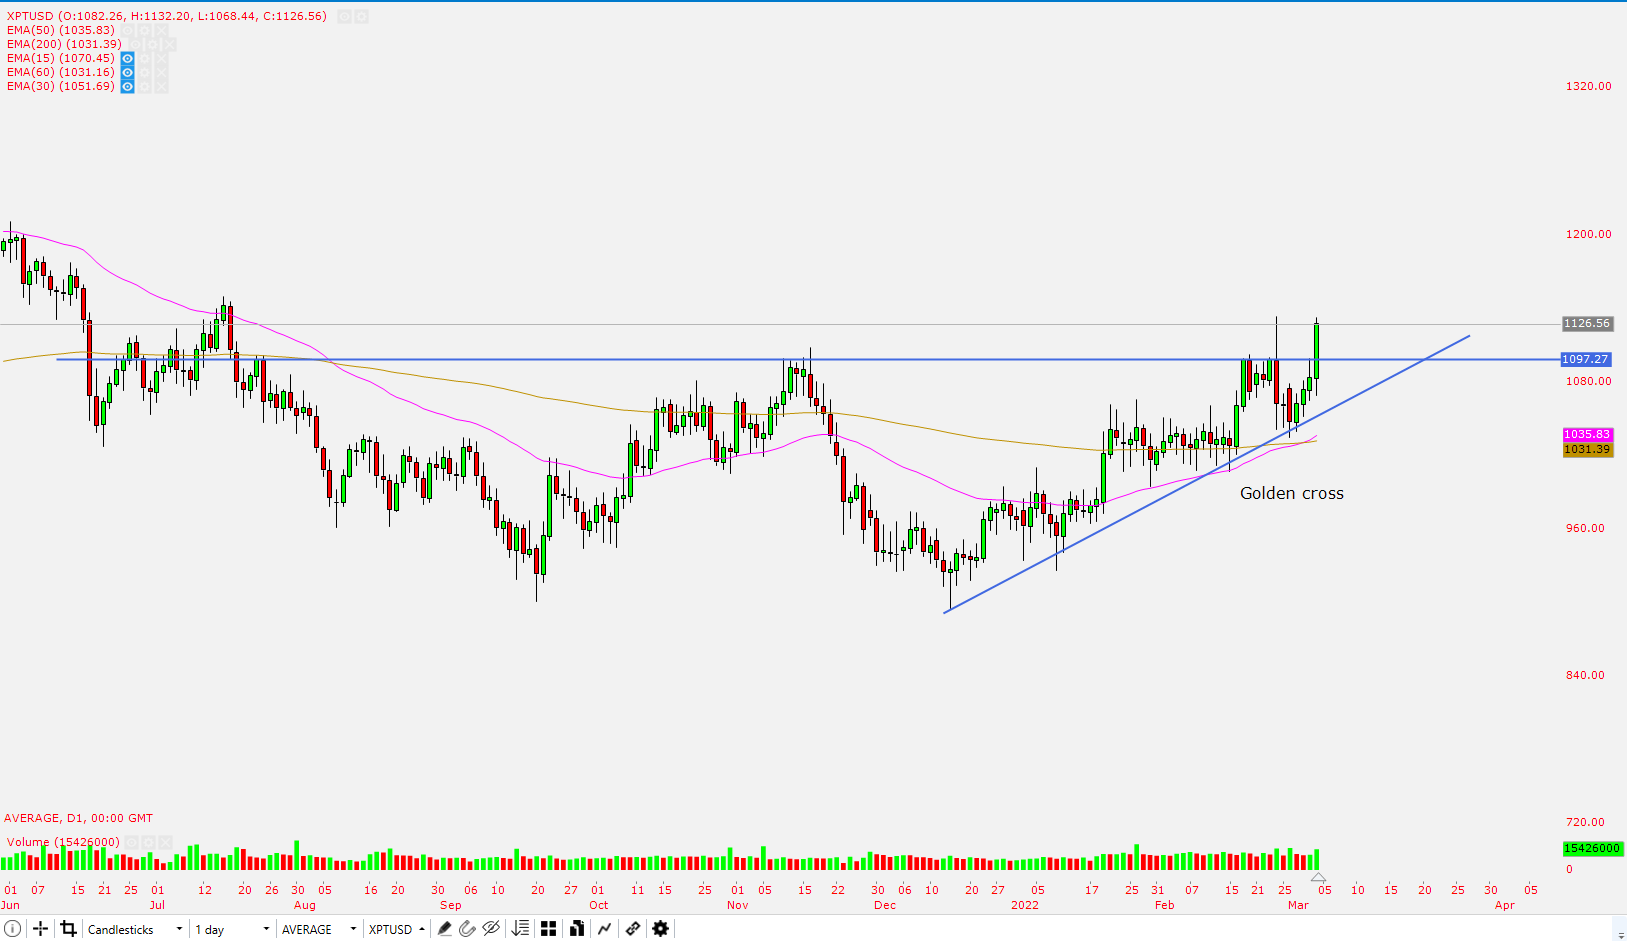
Platinum
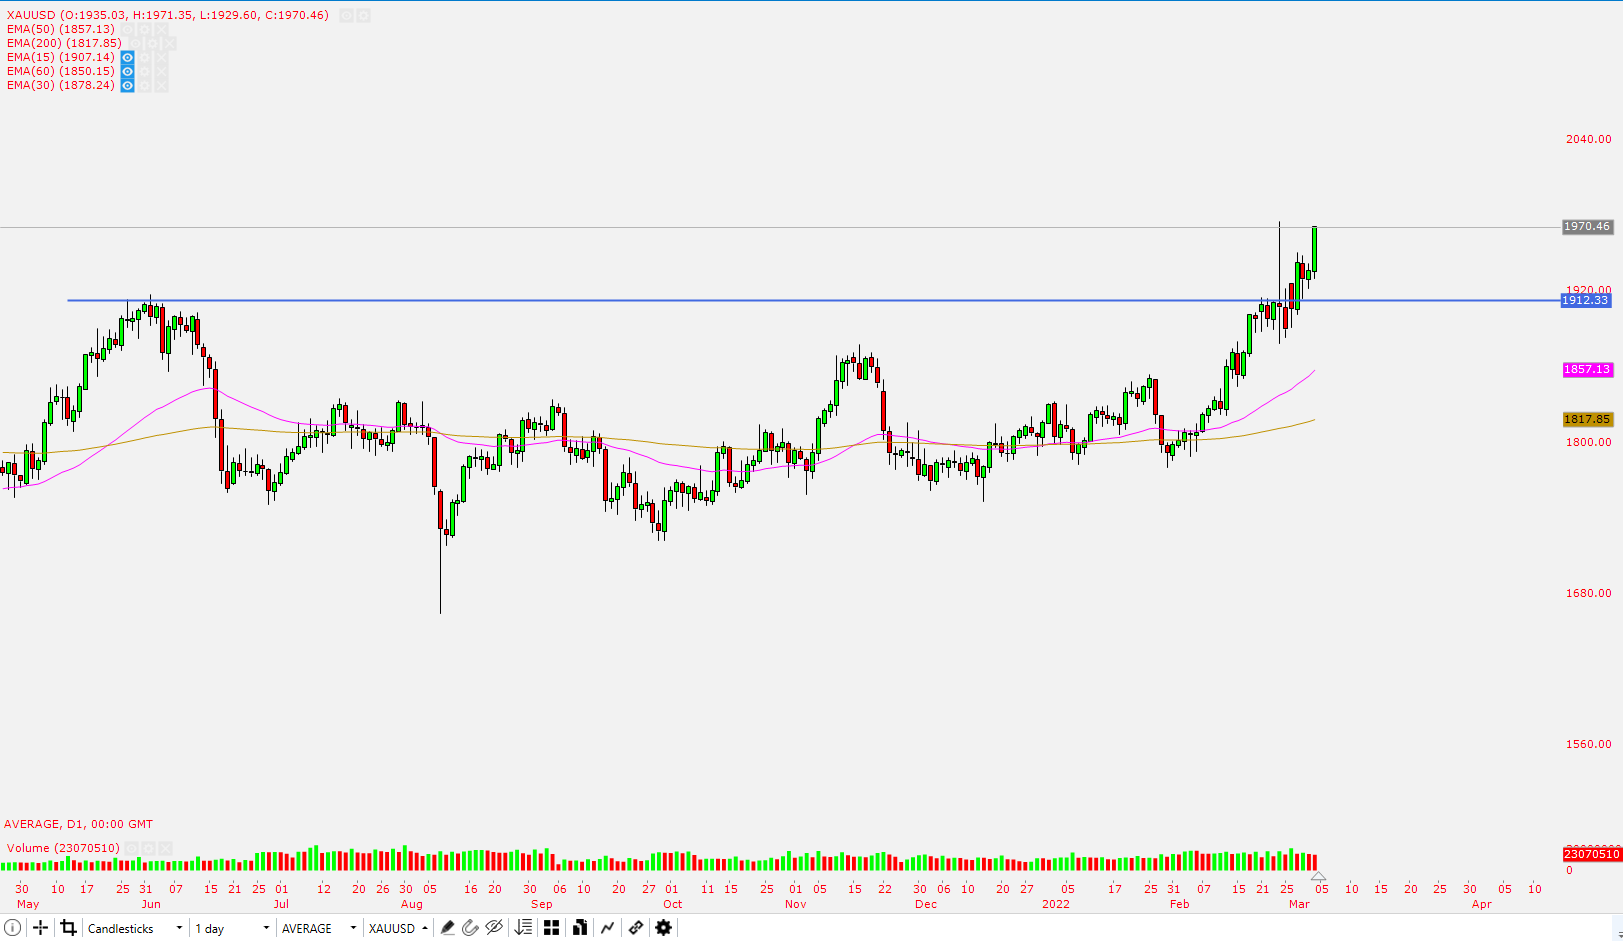
Gold
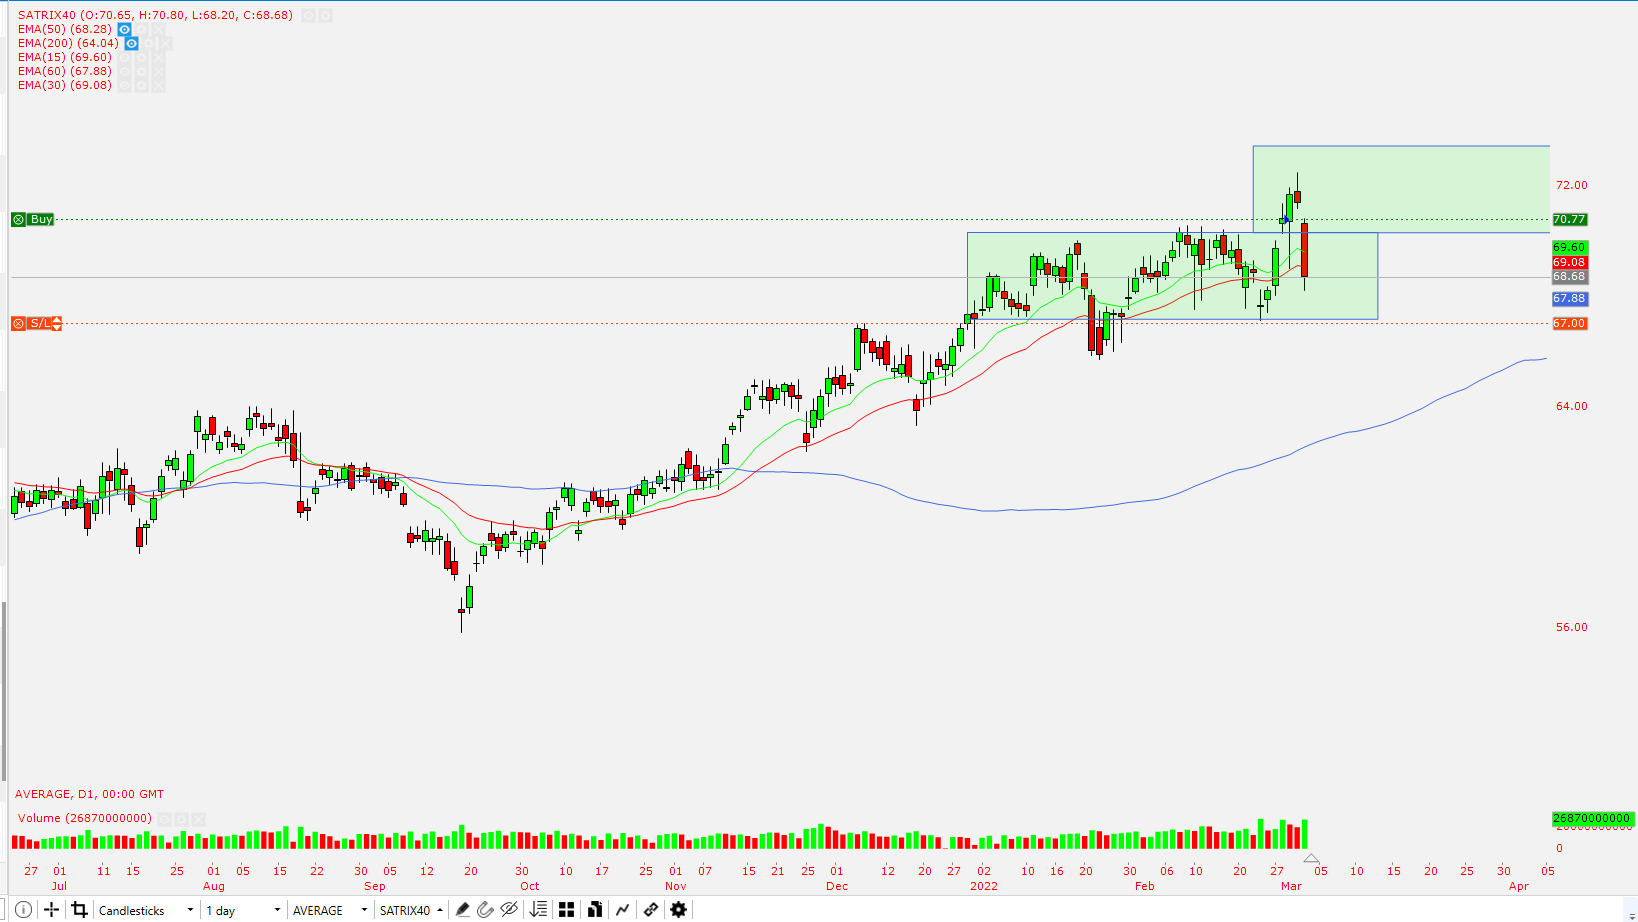
Lazy System update
We have a stop loss triggered. The ETF closed below the 30-day EMA as the Naspers & Prosus got hammered by the market last week. Going to be exiting the trade at the open on Monday
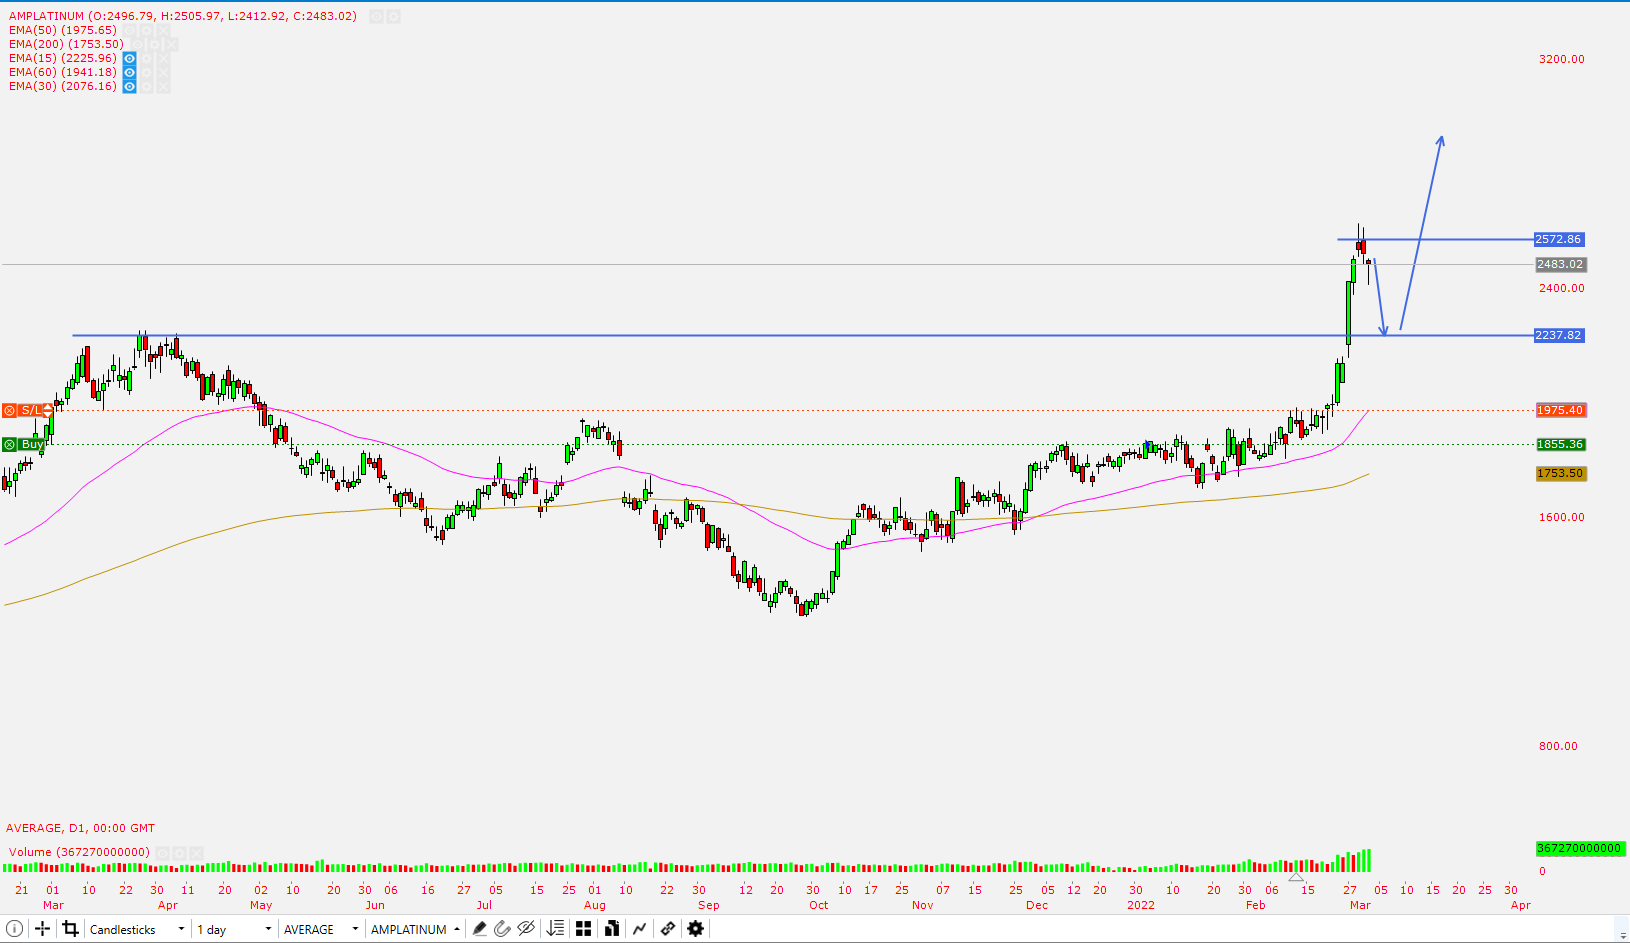
Amplats
The last 3 days of the past week was quite bearish. With a reversal pattern of a bearish engulfing candle. I think the market is about to shake of it’s first set of “weak hands”. With bullish conditions I think the reversal pattern is as a result of a stale bulls from the commodity super circle boom seeing profits for the first time since March 2021. Some people were caught and set with a losing position for a year and would be happy to break even or take the profits they haven’t seen in a year. We could see the market come to the R2237 resistance and provide good buying opportunities to pick the “dip”. I will be looking for a reversal pattern back to the upside this week. To raise my stop and add to my position.
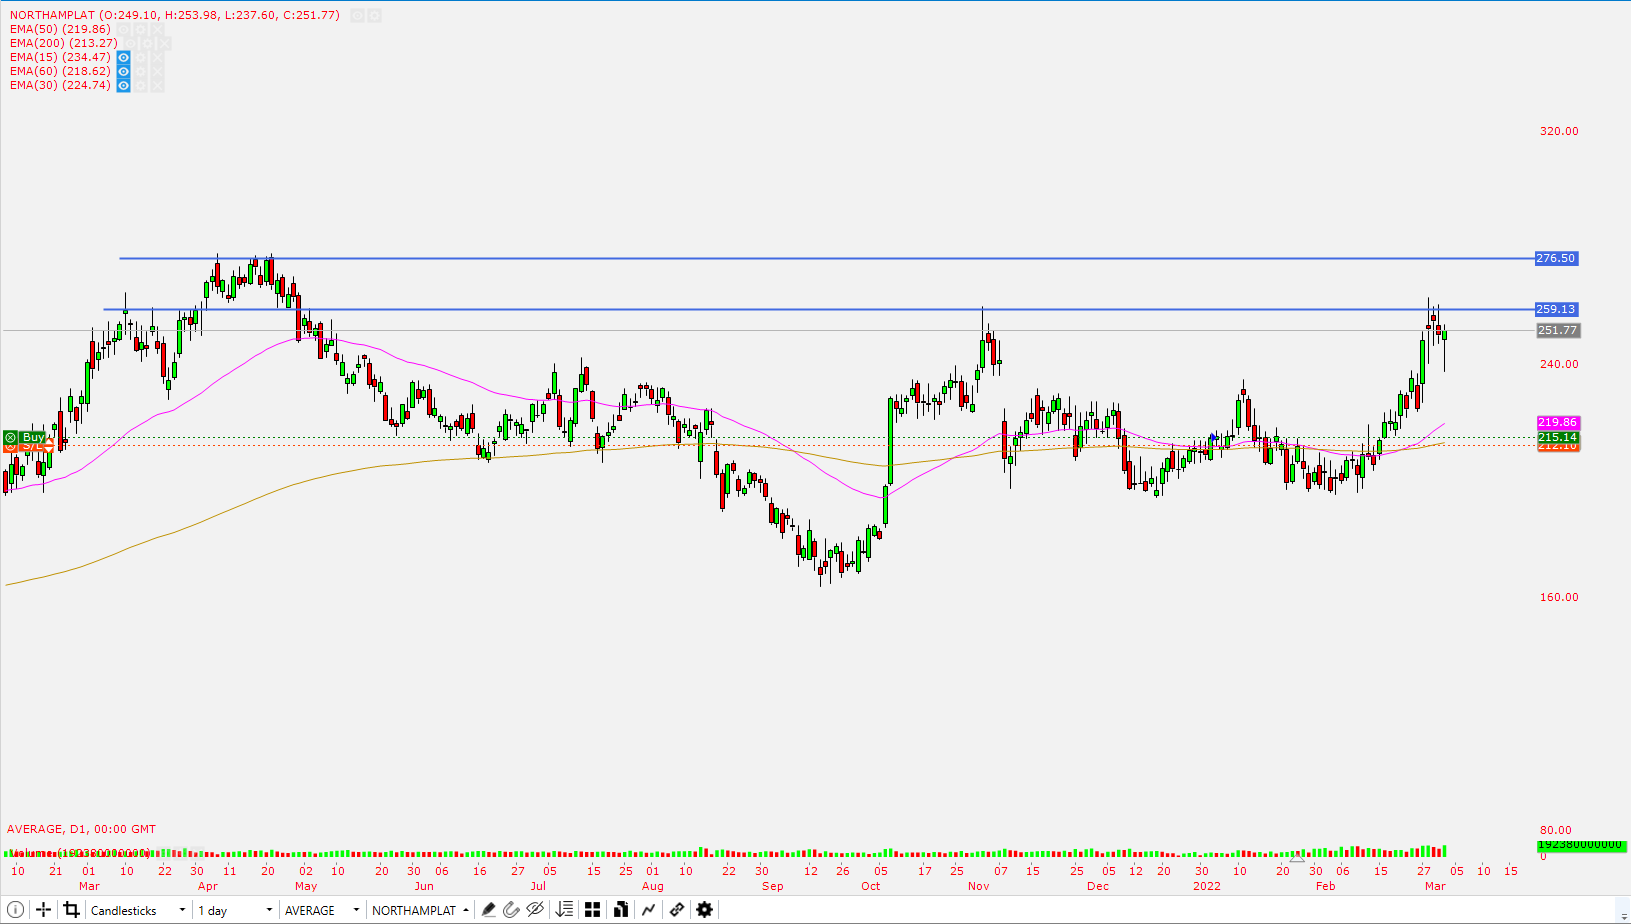
Northam Platinum
The stock found some selling at the R259. I’m waiting the break of this level on the up side to then raise my stop loss and add to my position. I think will have a strong rally once the stock breaks R276.50.
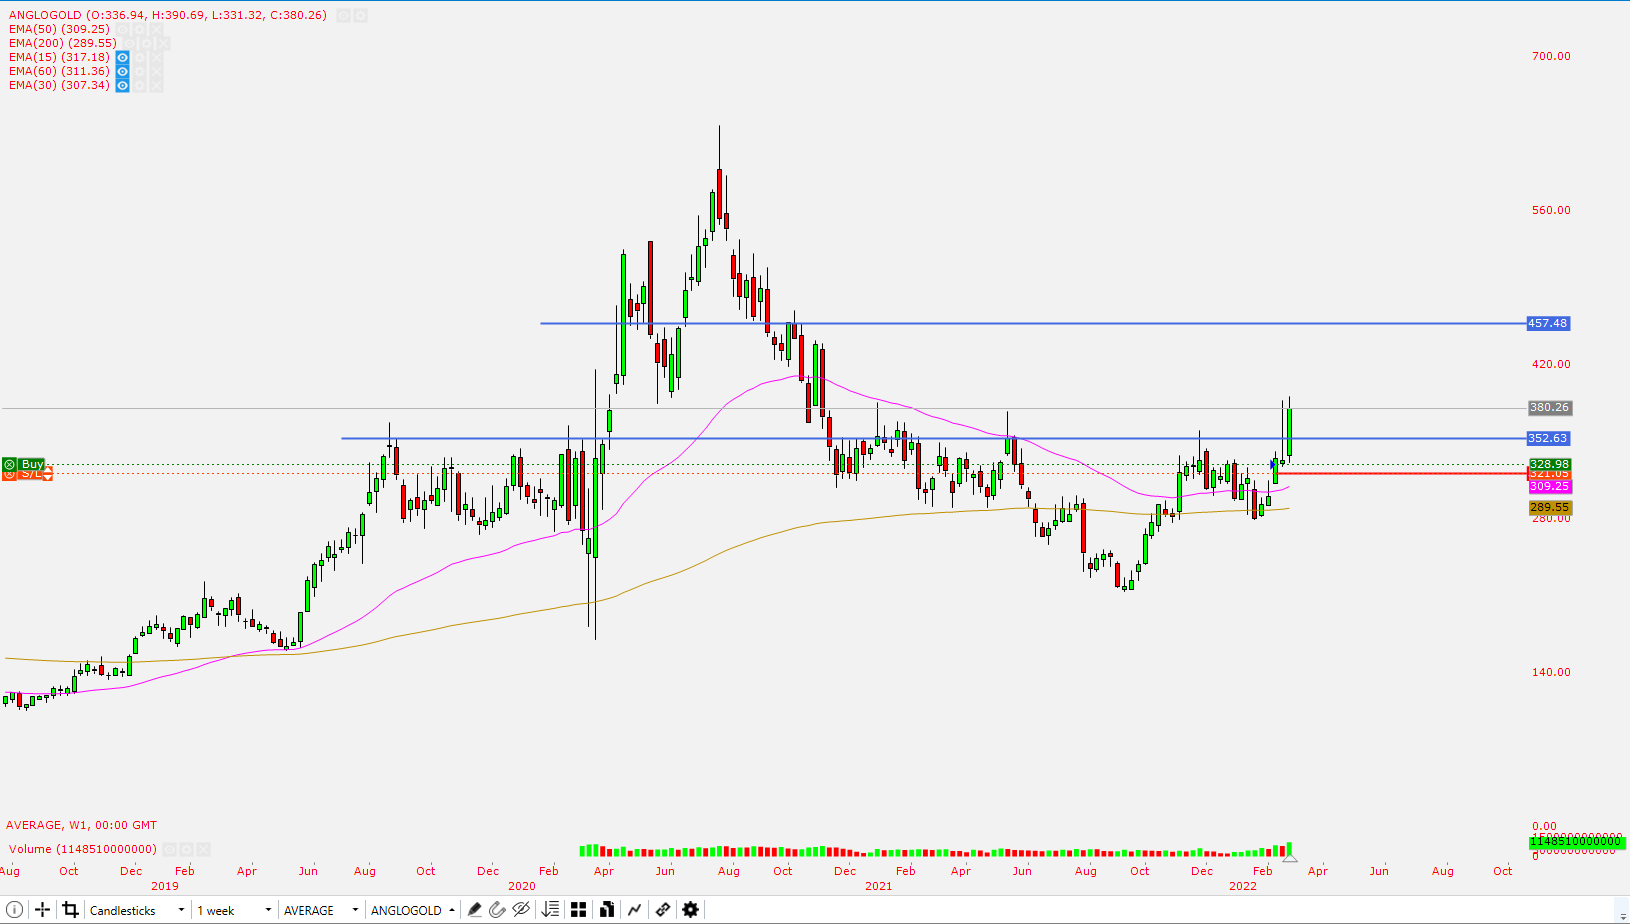
Anglo Gold
The broke out and retested the resistance and held it well as support from the other side. I raised my stop loss slightly to just under the 50-day EMA to R321.05 reducing my risk to -0.22%. I will be watching the price actions for an opportunity to raise my stop and add to the position.
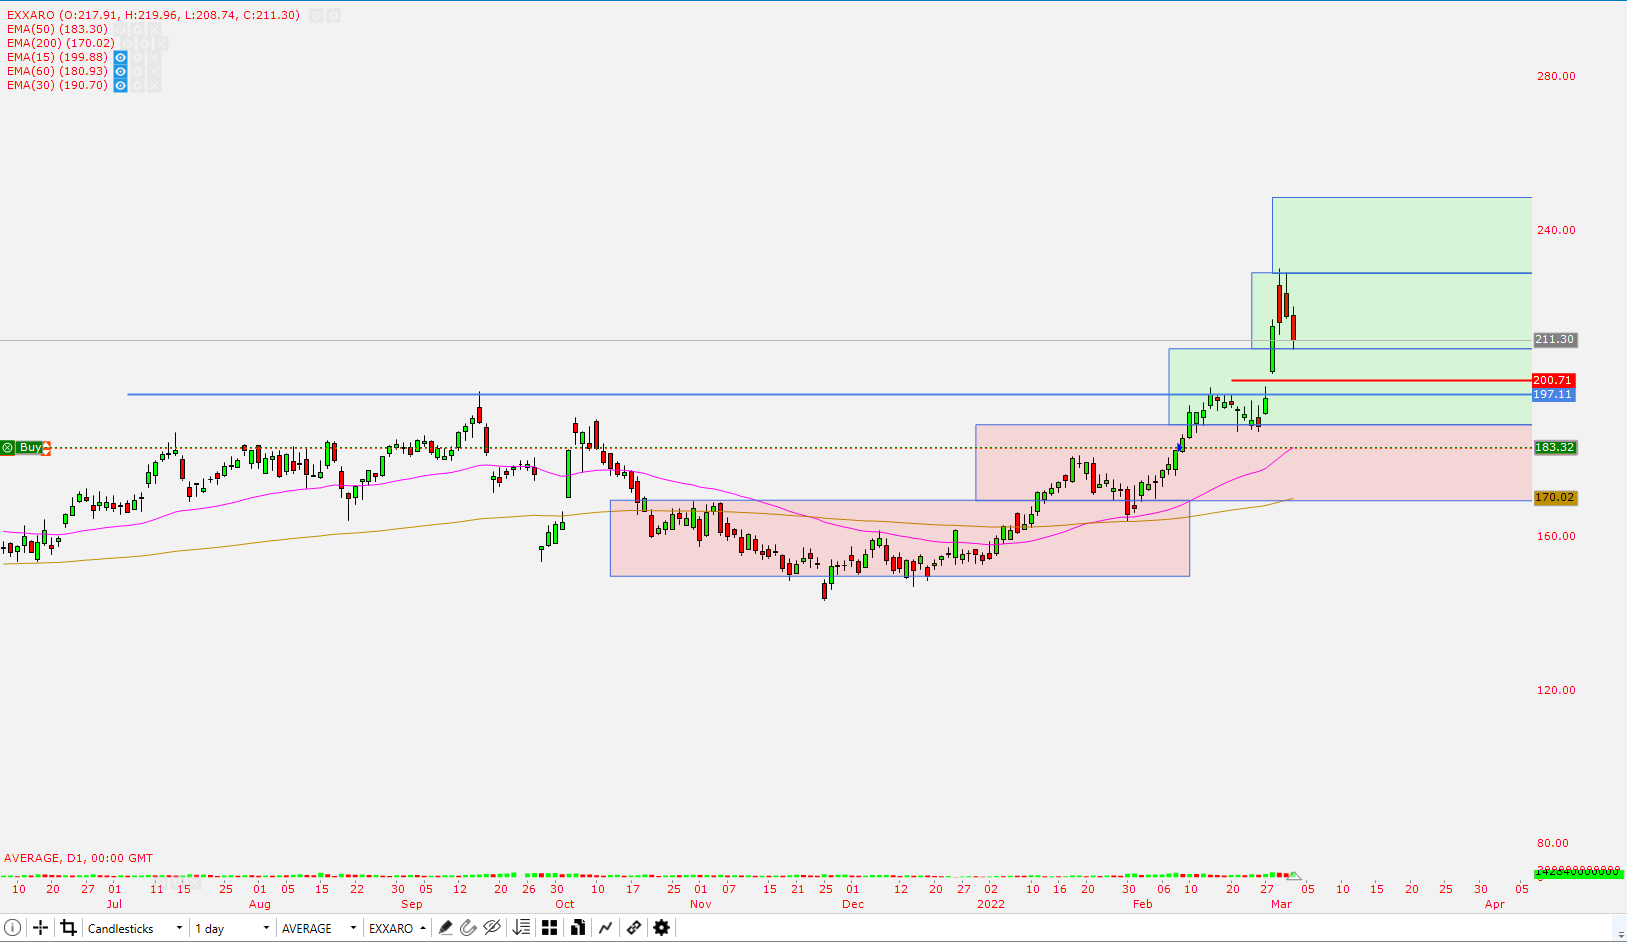
Exxaro
The stock has been moving to higher boxes I held off in adding to my position when I raised my stop loss to R183.32 though my stop loss is a break even. I eexpect the market to rested the R197 resistance. But if the current base holds up. I will raise my stop loss to just below the gap and drive candle to R200, and add to the position
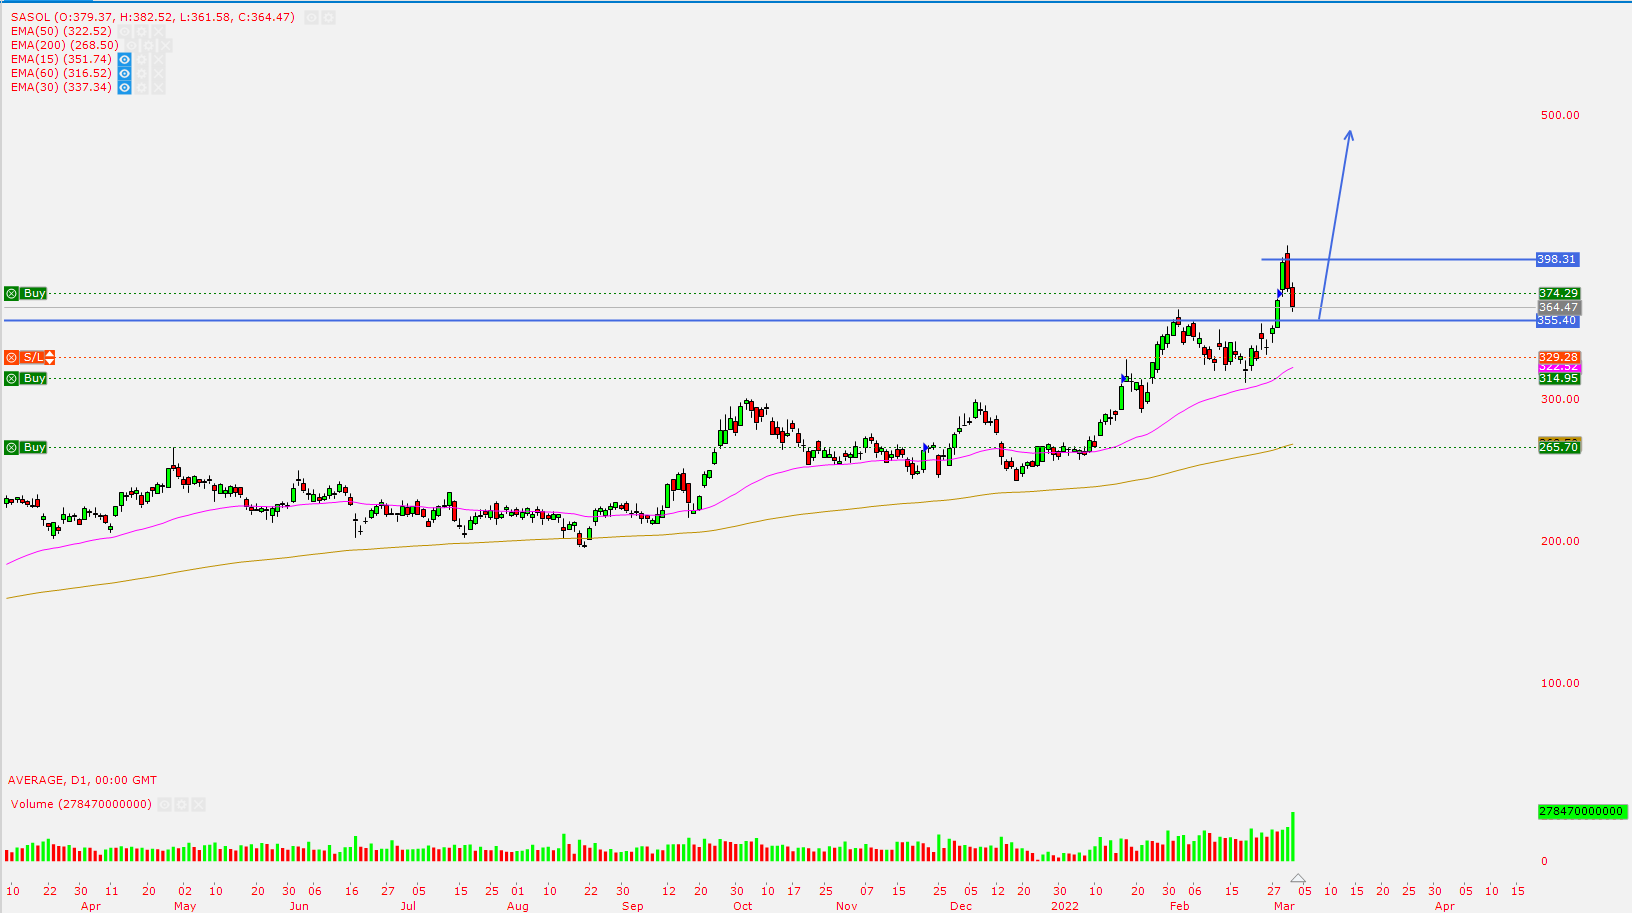
Sasol
As oil continues to make new highs Sasol continues to benefit from that. The stock saw a bit of sell of last couple of days, coming to perhaps retest the R255 resistance. I’m waiting for the stock to break R398 to look for a place to hide my stop loss.
S
Sibanye
Sibanye came with strong interim results. Increased earnings and declared a dividend. Trading at 6-7x PE ratio. With rising platinum and gold price. The company will likely sell in rising price. The stock looks quite cheap indeed. I’m waiting for last Wednesday’s doji which was then engulfed on Thursday to be invalidated with a close above R76.45 to look for a higher place to hide my stop loss perhaps just below the 50-day EMA around R60.40

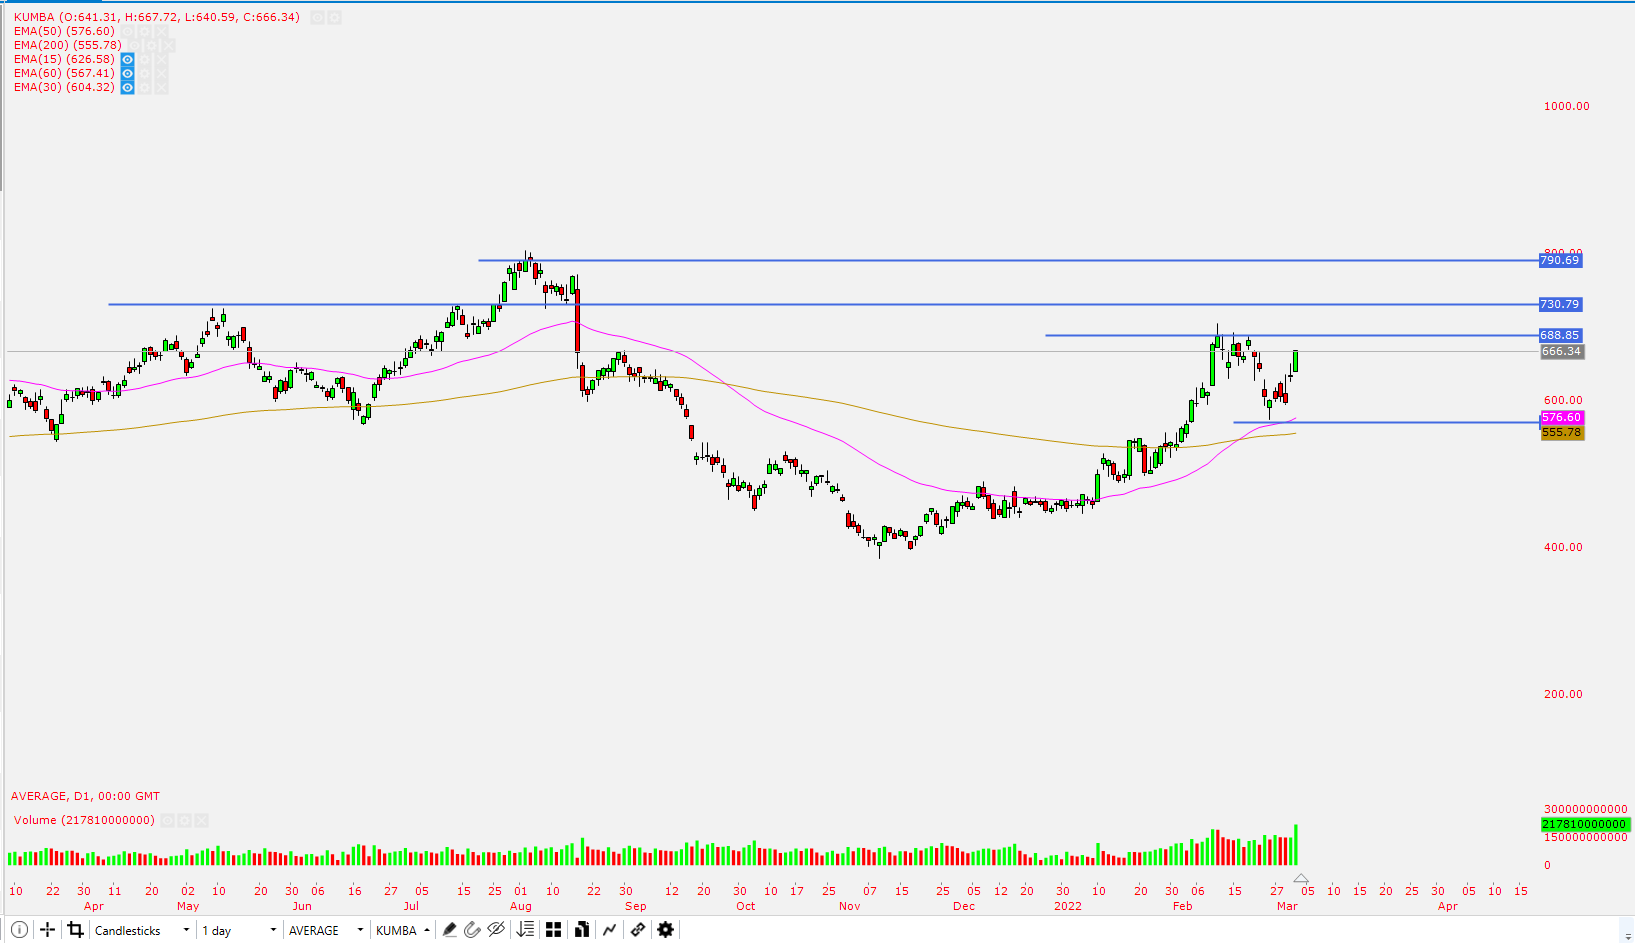
Kumba Iron Ore
The stock got sold off quite a bit down to the 50-day EMA, and it held strongly. Now I’m waiting for a close through R668.85 to start building a position. I expect the stock to have some reaction at R730 & R790. I will be looking for places to hide my stop and perhaps add to the position, but for now I wait.
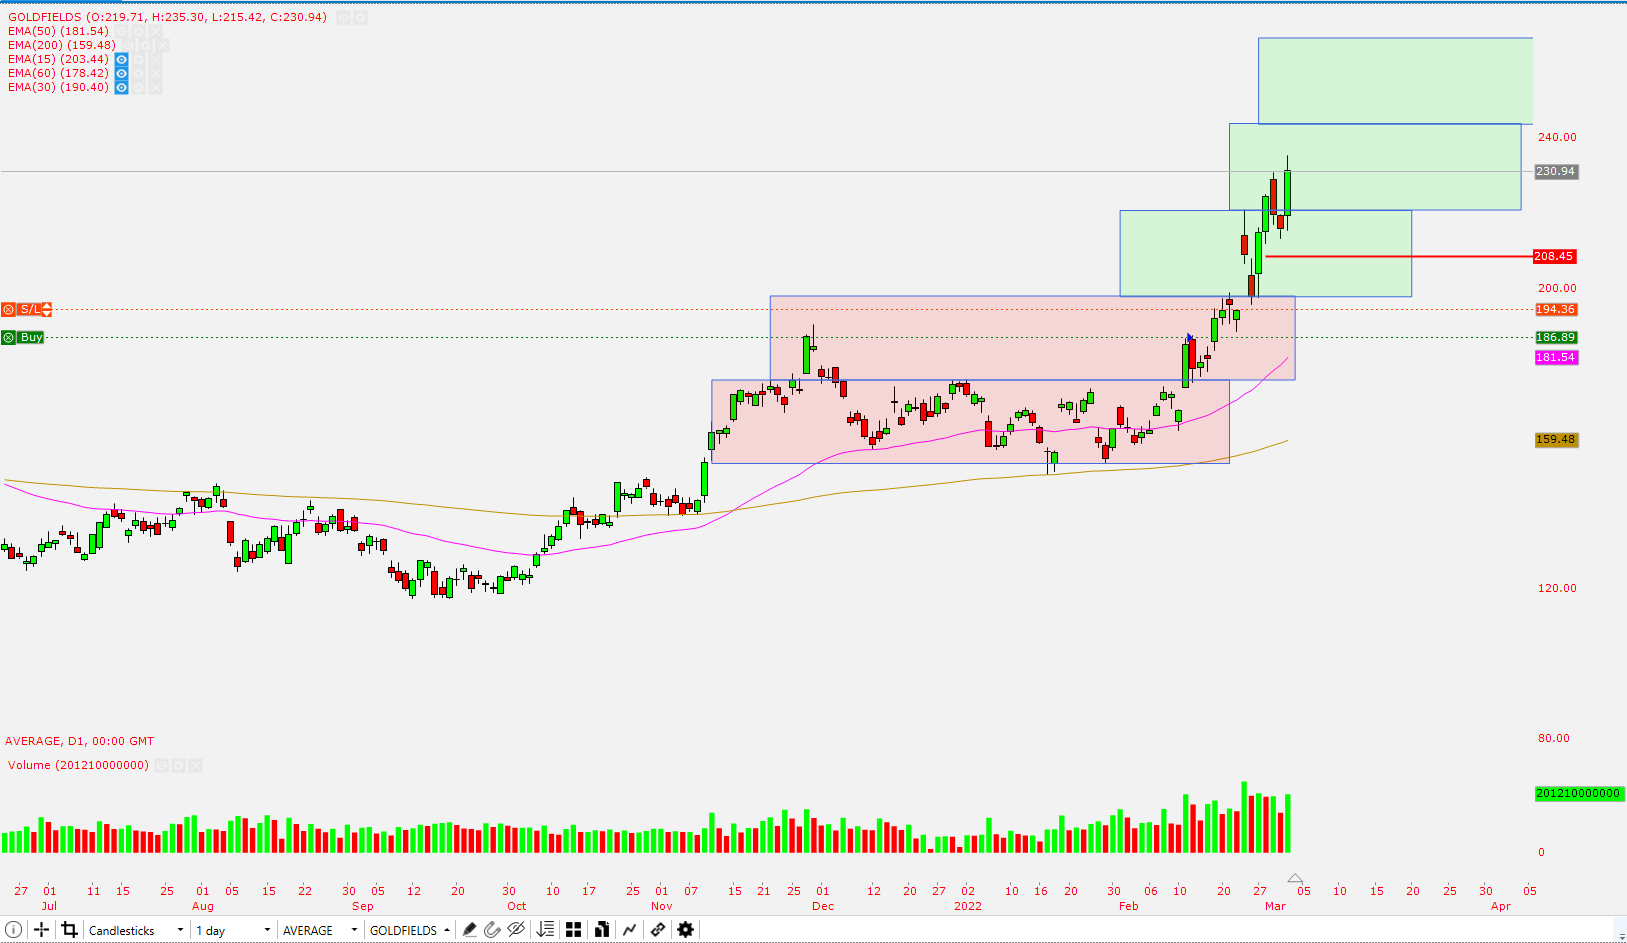
Goldfields
The stock moved to a higher box, not without dunking to the lower box. I raised my stop loss to R194.36 raising my position to just above breaking even at +0.28%. I will add another 1% risk to the position with 2.6 shares
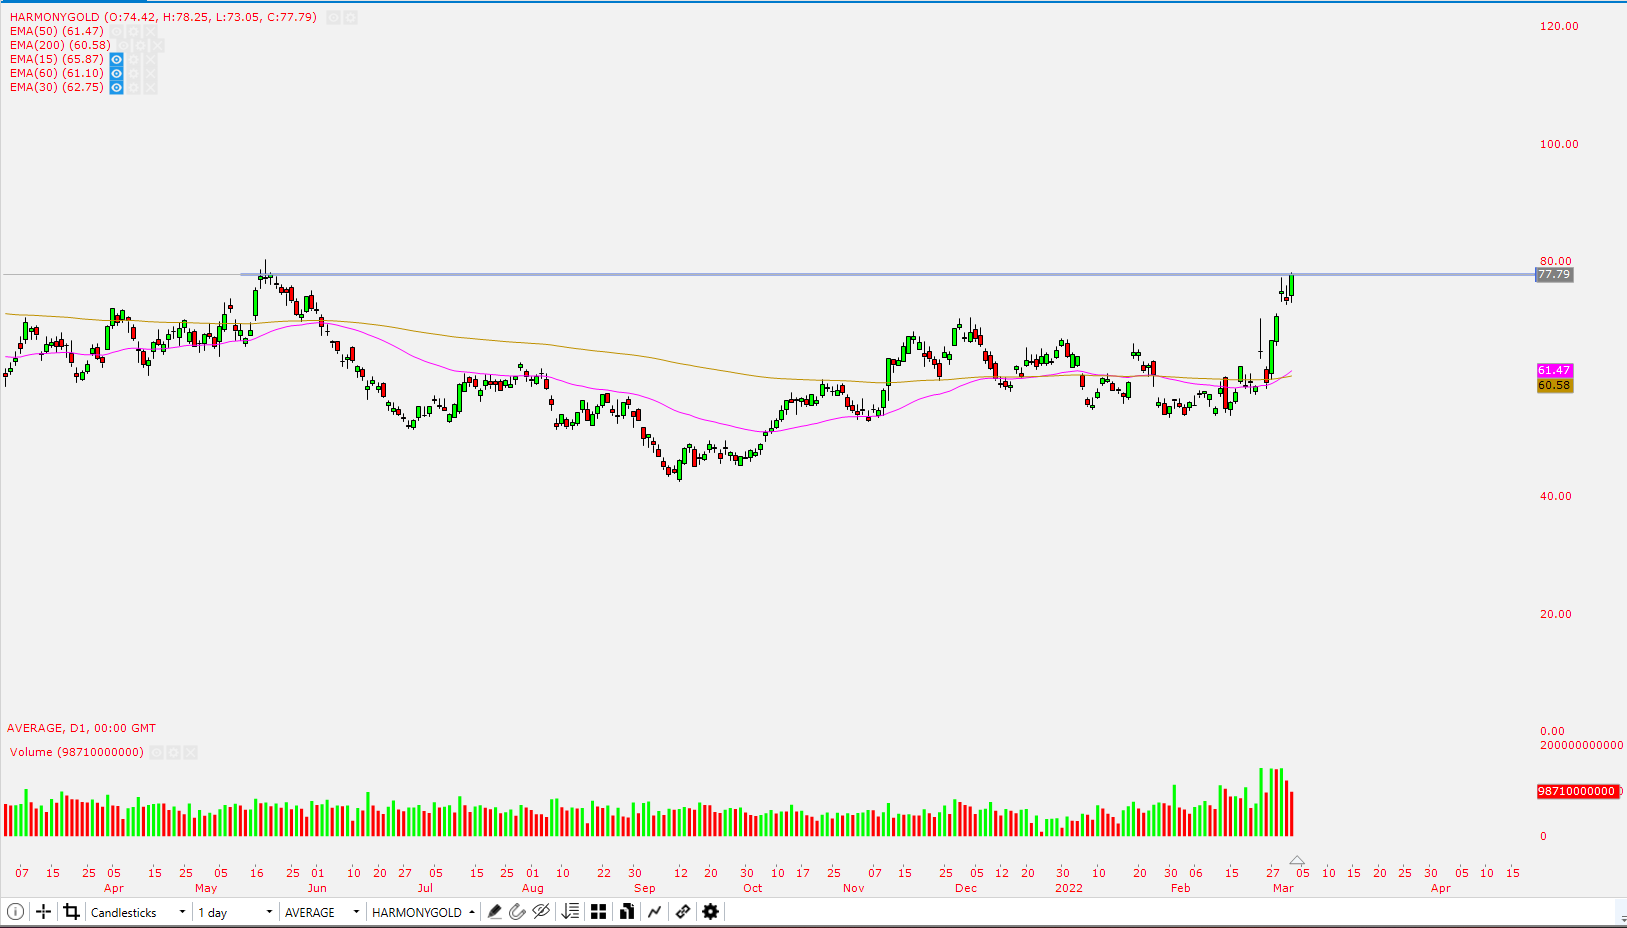
Harmony Gold
We have a golden cross on the stock. It close bang on the resistance on Friday. Perhaps it was genuine resistance or sellers were saved by the bell. I’m waiting to see how the market reacts this week. If it continues to break. I will start building a position on the stock
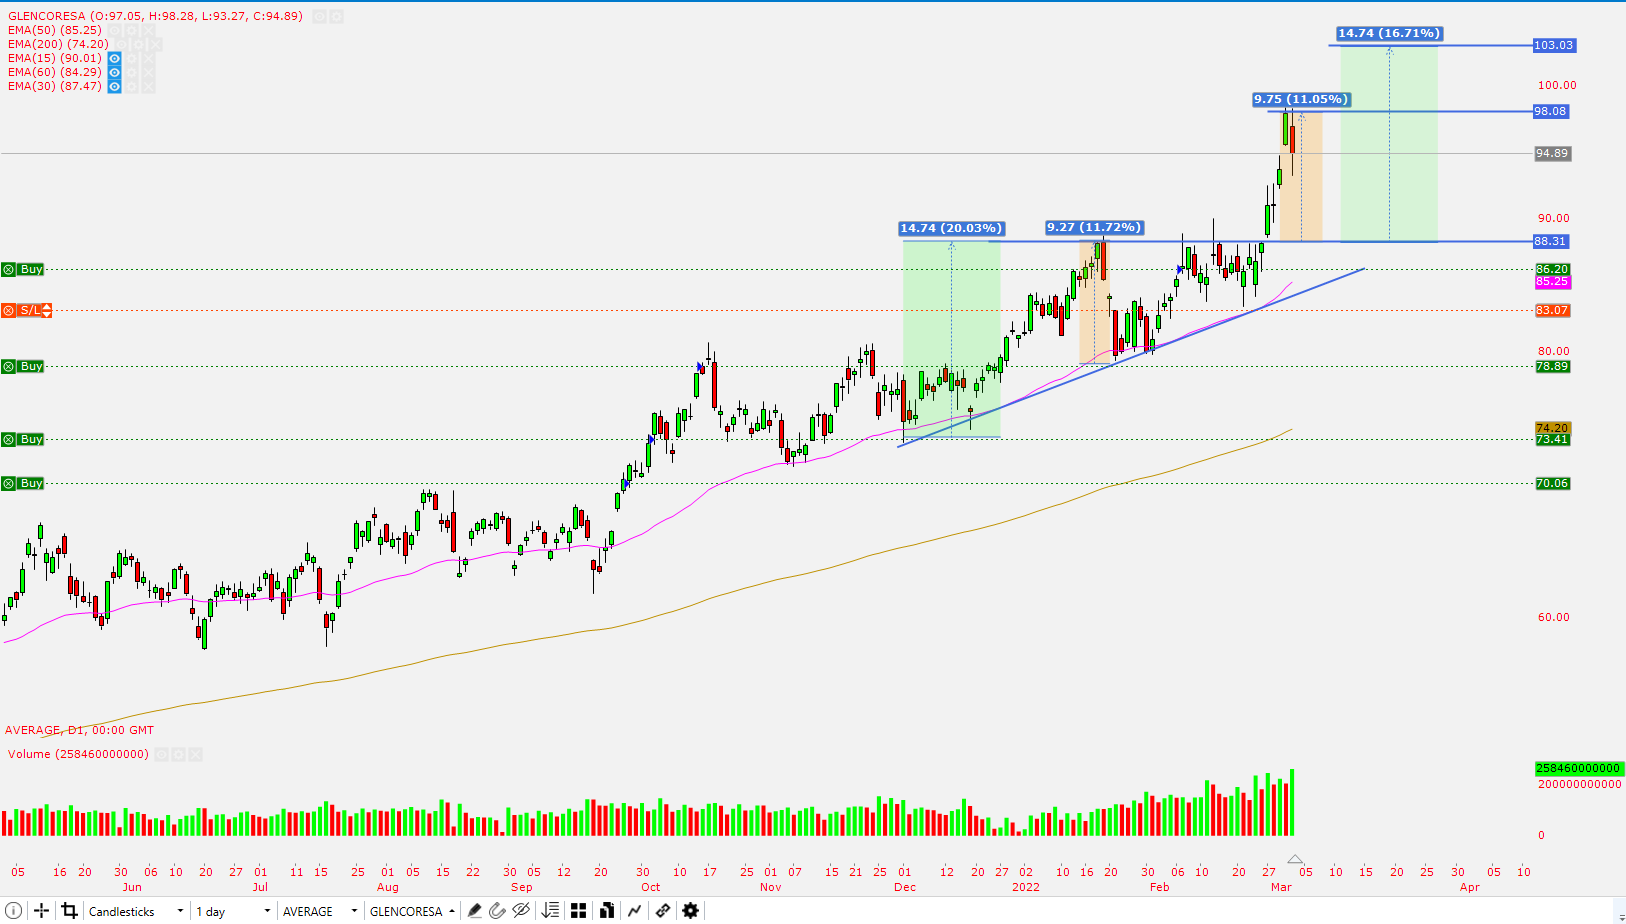
Glencore
The reached it ascending triangle short term target with no surprise found some selling at the target level. I except the R98 level to hold up a bit as it become the new area of memory for the market. When the market breaks this level I will look for another place to hide my stop loss. And possibly add to my position
Retail
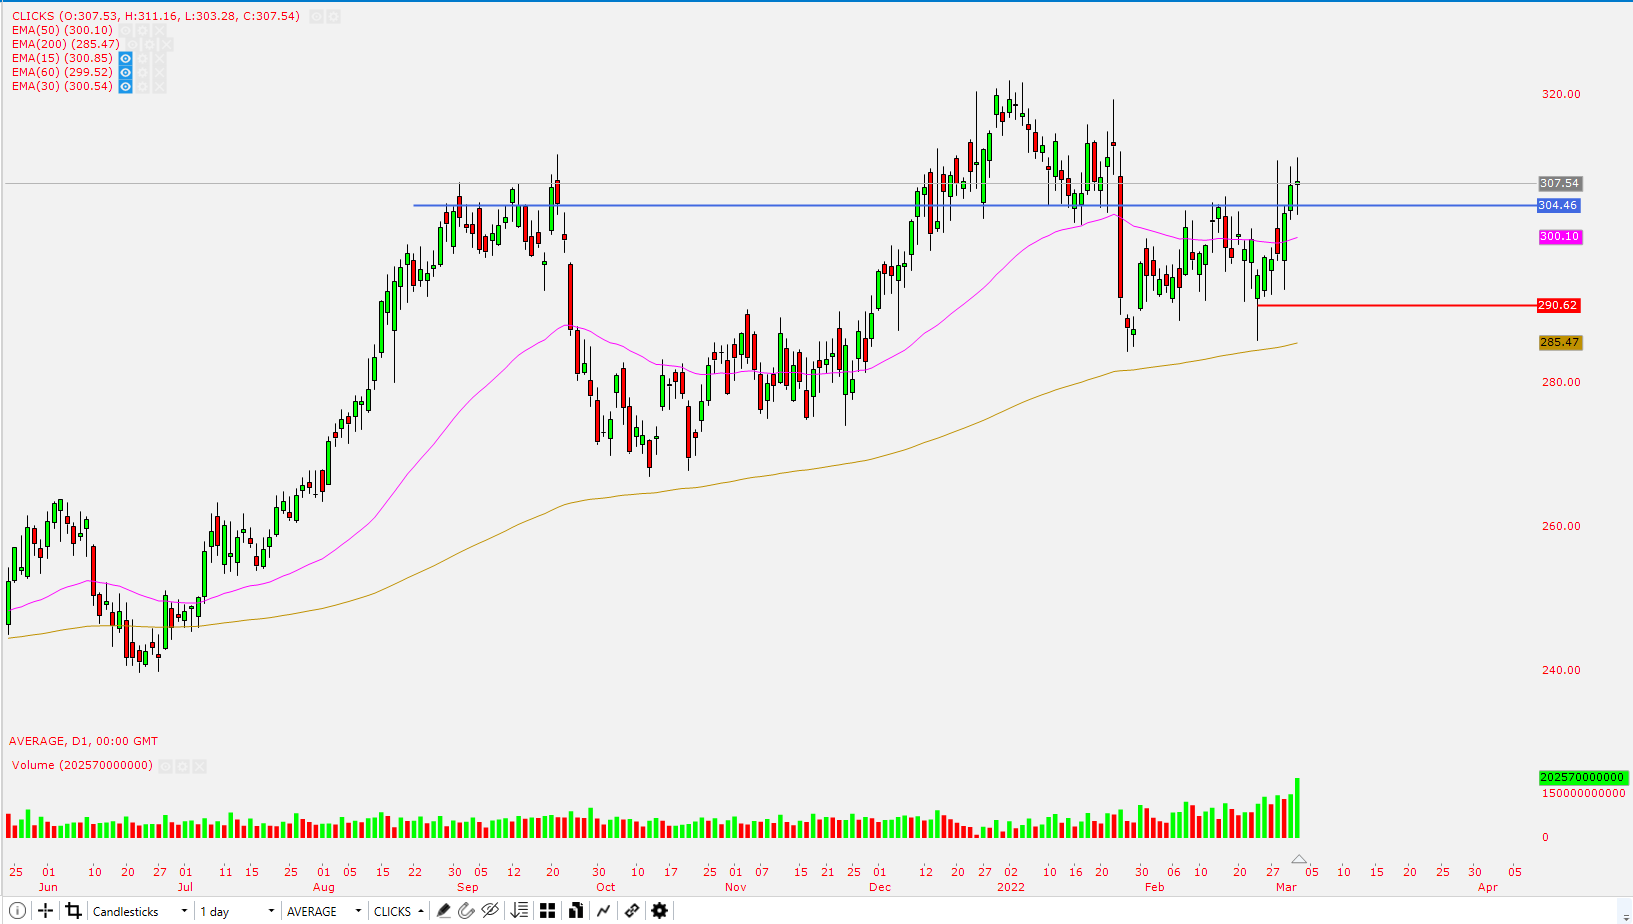
Clicks
The stock came back above the 50-day EMA breaking the R304 resistance. I will build a position on the stock, with an initial stop loss at R290.60. Putting 1% risk with 5.6 shares.
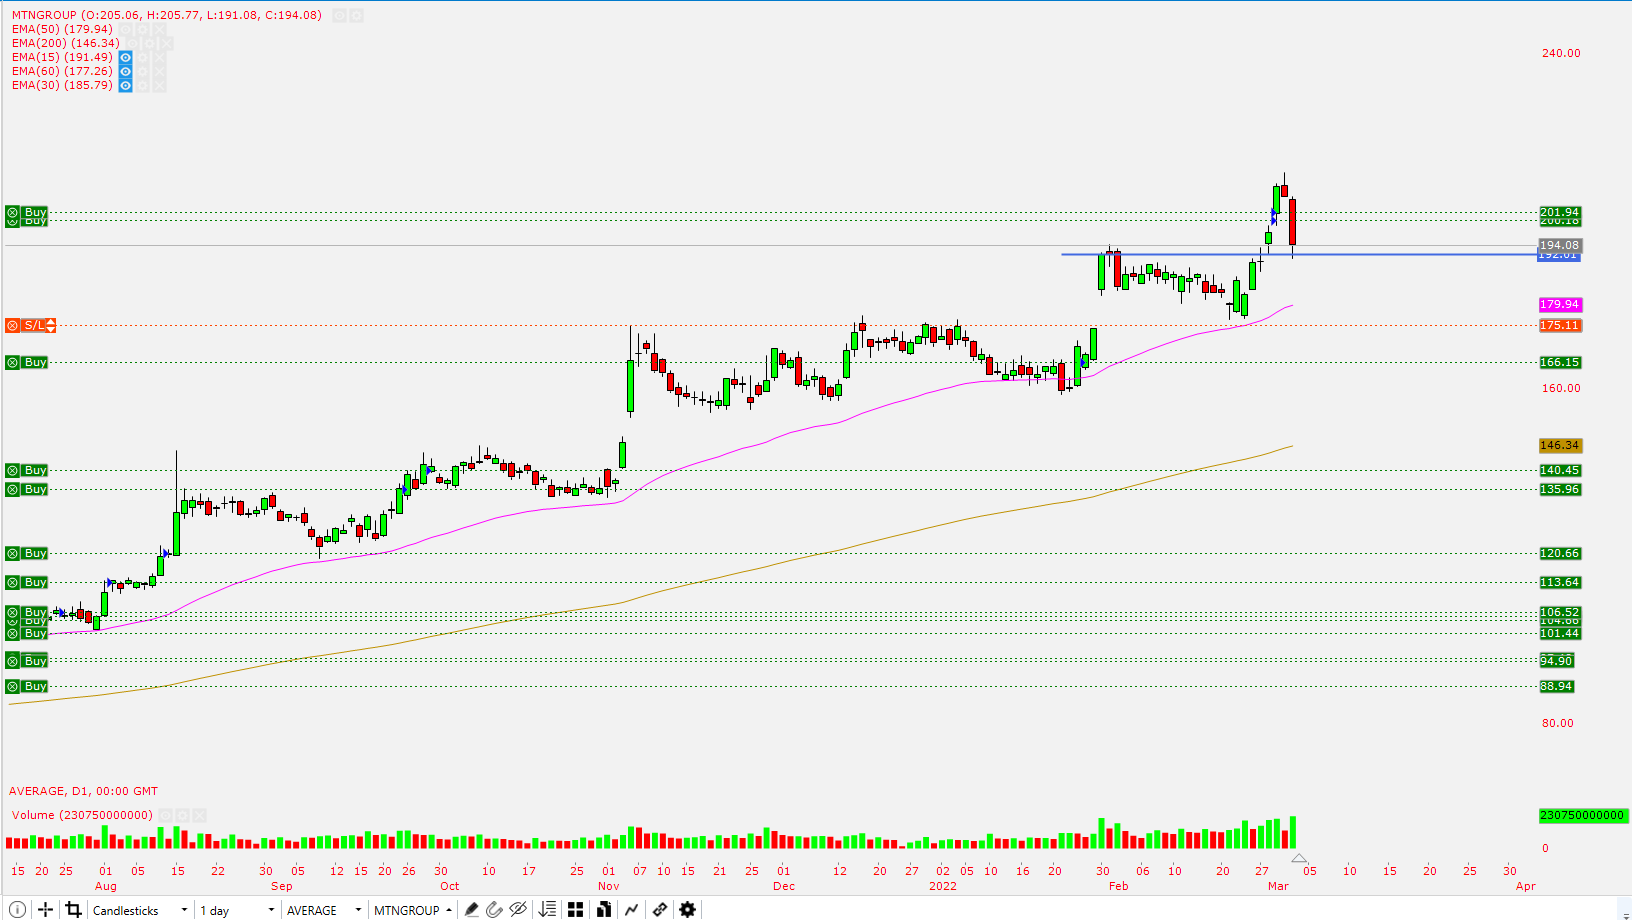
MTN
MTN perhaps provides a much better risk reward play on the Russian Vs Ukraine. As it is not a direct play on oil prices but merely an indirect play through its exposure to Nigeria (their biggest market). The stock broke the R192 short term resistance. Only to find some selling at the long term R200 resistance to re-test old resistance. It held on Friday. Not sure if it was saved by the bell or buyers came in to buy the retest.
Portfolio Summary on 6 March 2022
Capital invested: R10 303.77
Current Balance: R9 477.36 -8.02%
Current Equity (Balance including paper P&L): R24 223.38 135.09%
Current P&L : R14 746.02
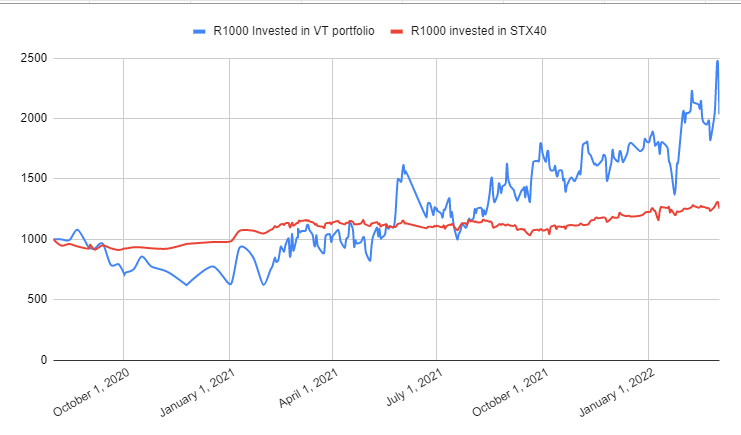
Village Trader Equity curve Vs Benchmark STX40
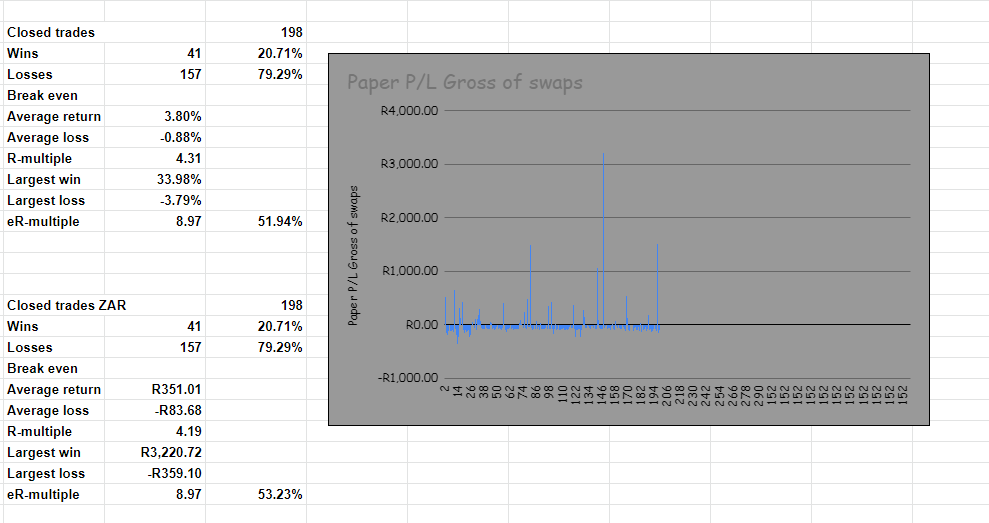
Closed trades statistics and distribution
Open positions statistics

Thank you for reaching far. For any questions feel free to email me at njabulo@villagetrader.co.za