Resources have been going higher even before the Russian invasion in Ukraine. In part because they were hard hit after the commodity boom leading to 2021. They’ve since found their respective bottom. The War has been just a catalyst and further pushed them even higher. With continued rising commodity prices. Miners will rise in price in anticipation of higher profit and higher dividends over the next few years. Miners with the cheapest holes, with low debt and high cash levels will be the biggest benefactors of rising commodity prices.
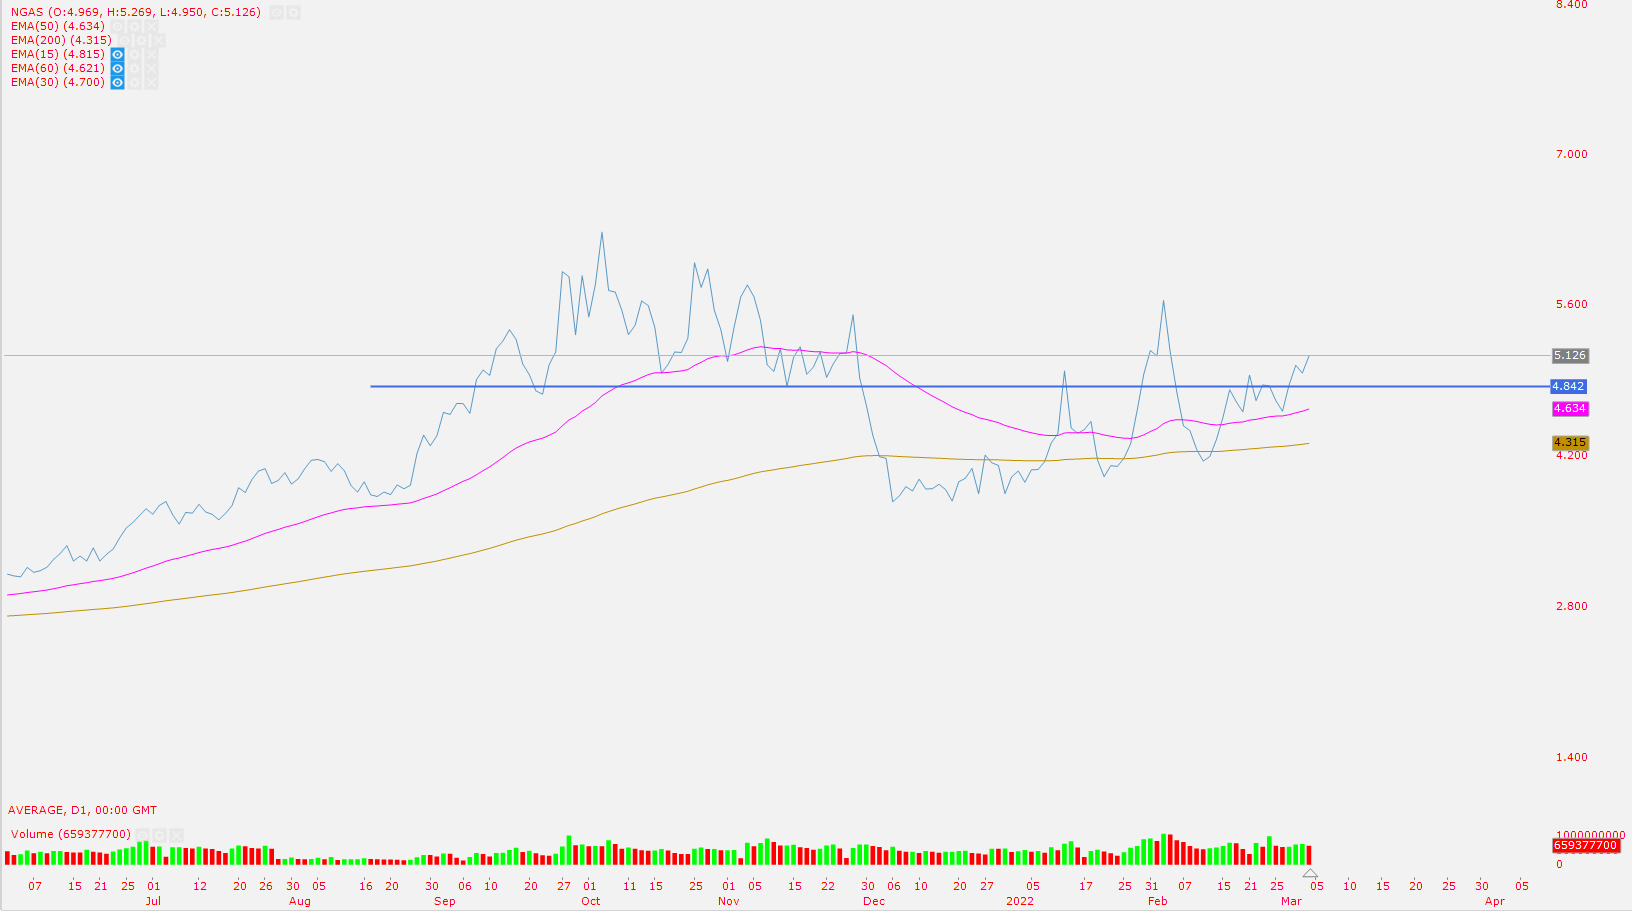
Natural gas
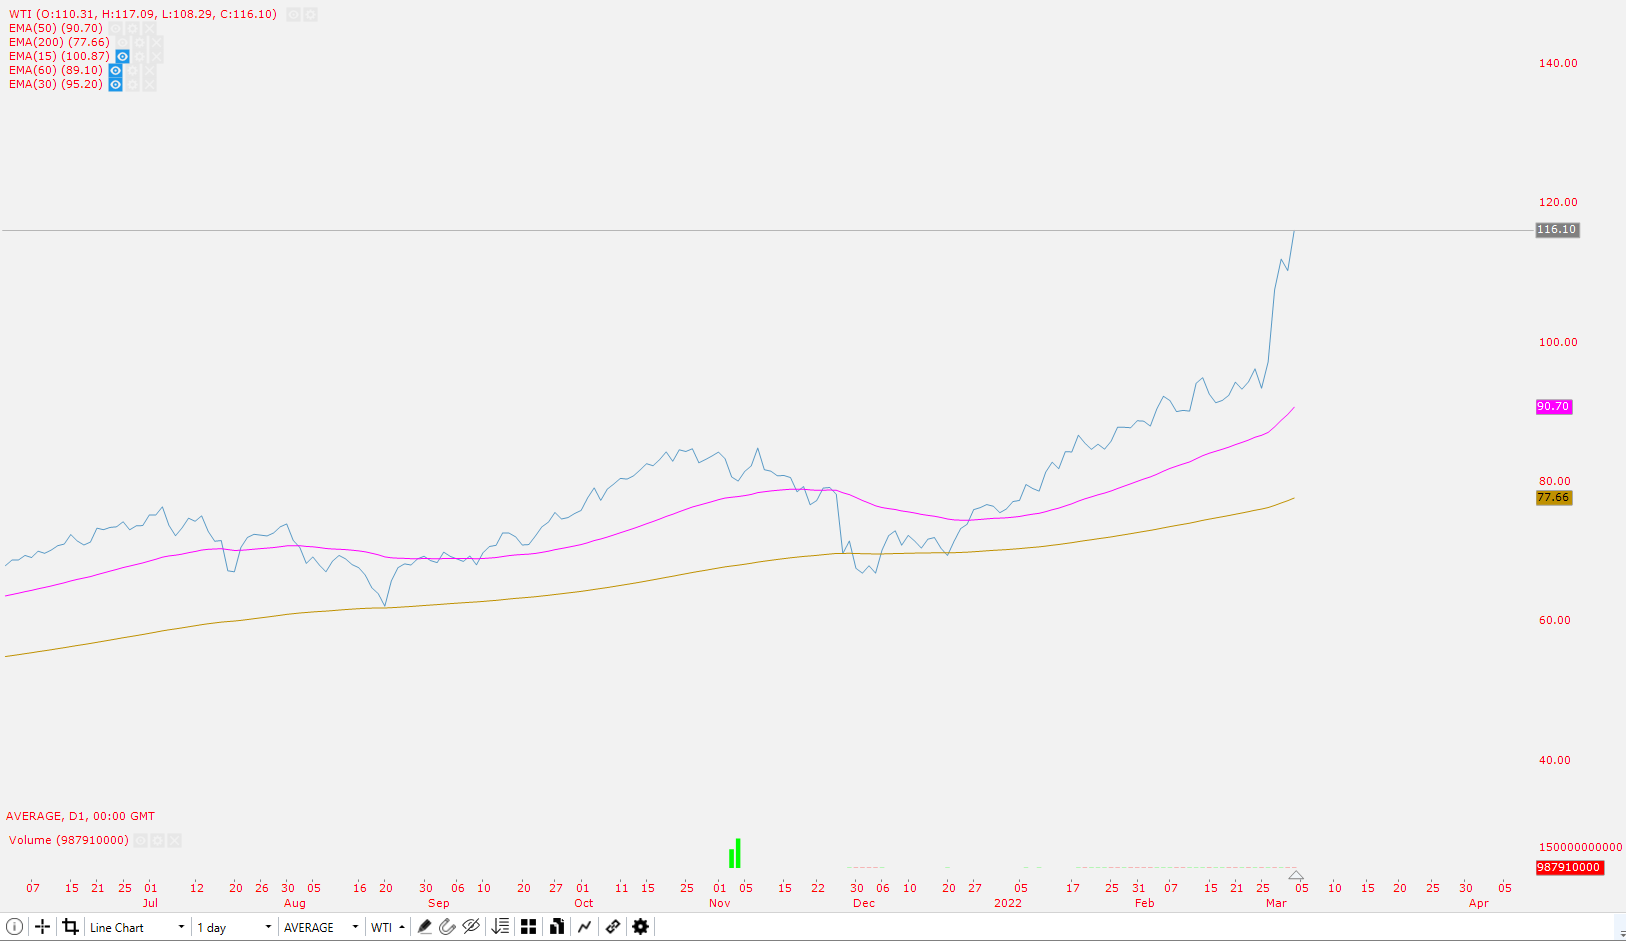
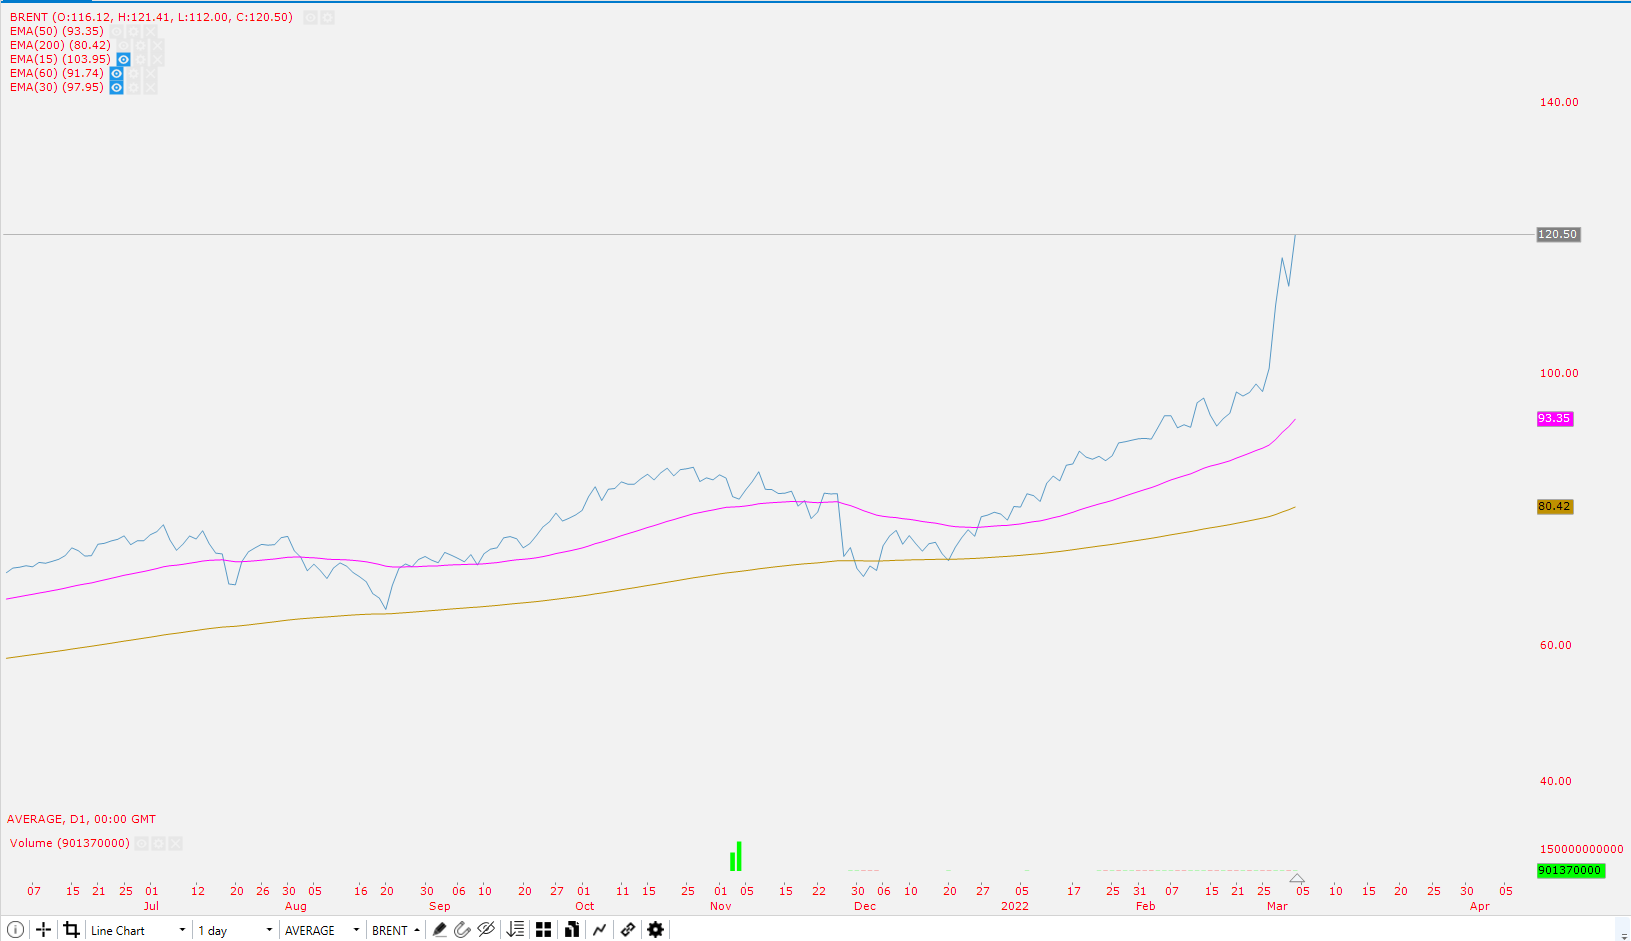
Oil
WTI
Brent
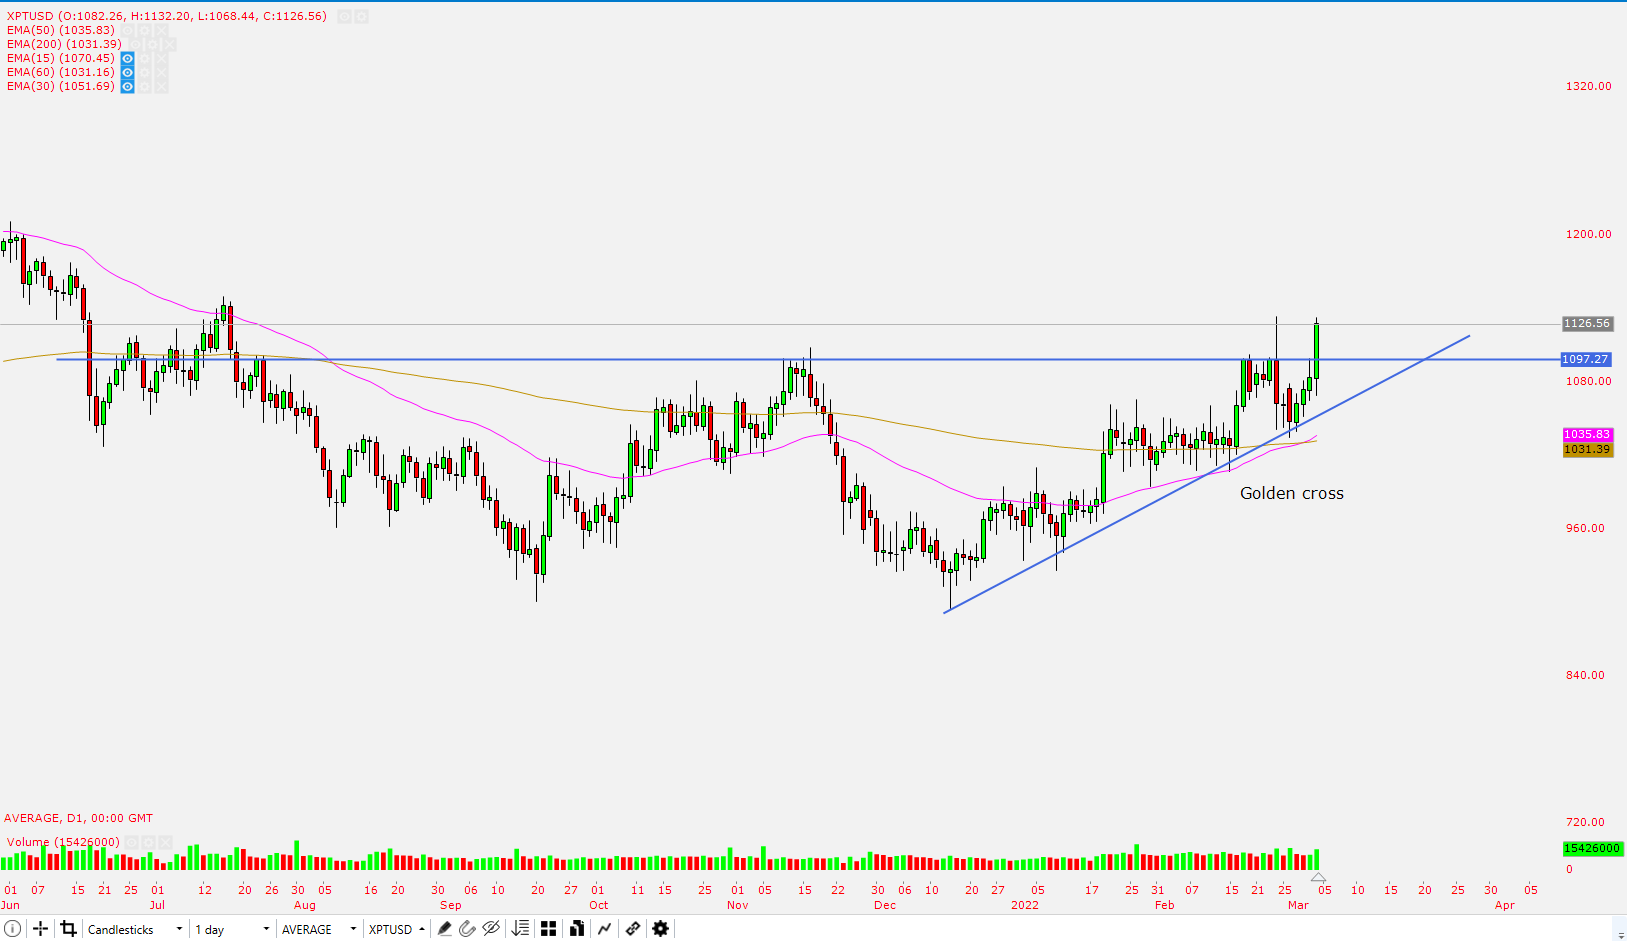
Platinum
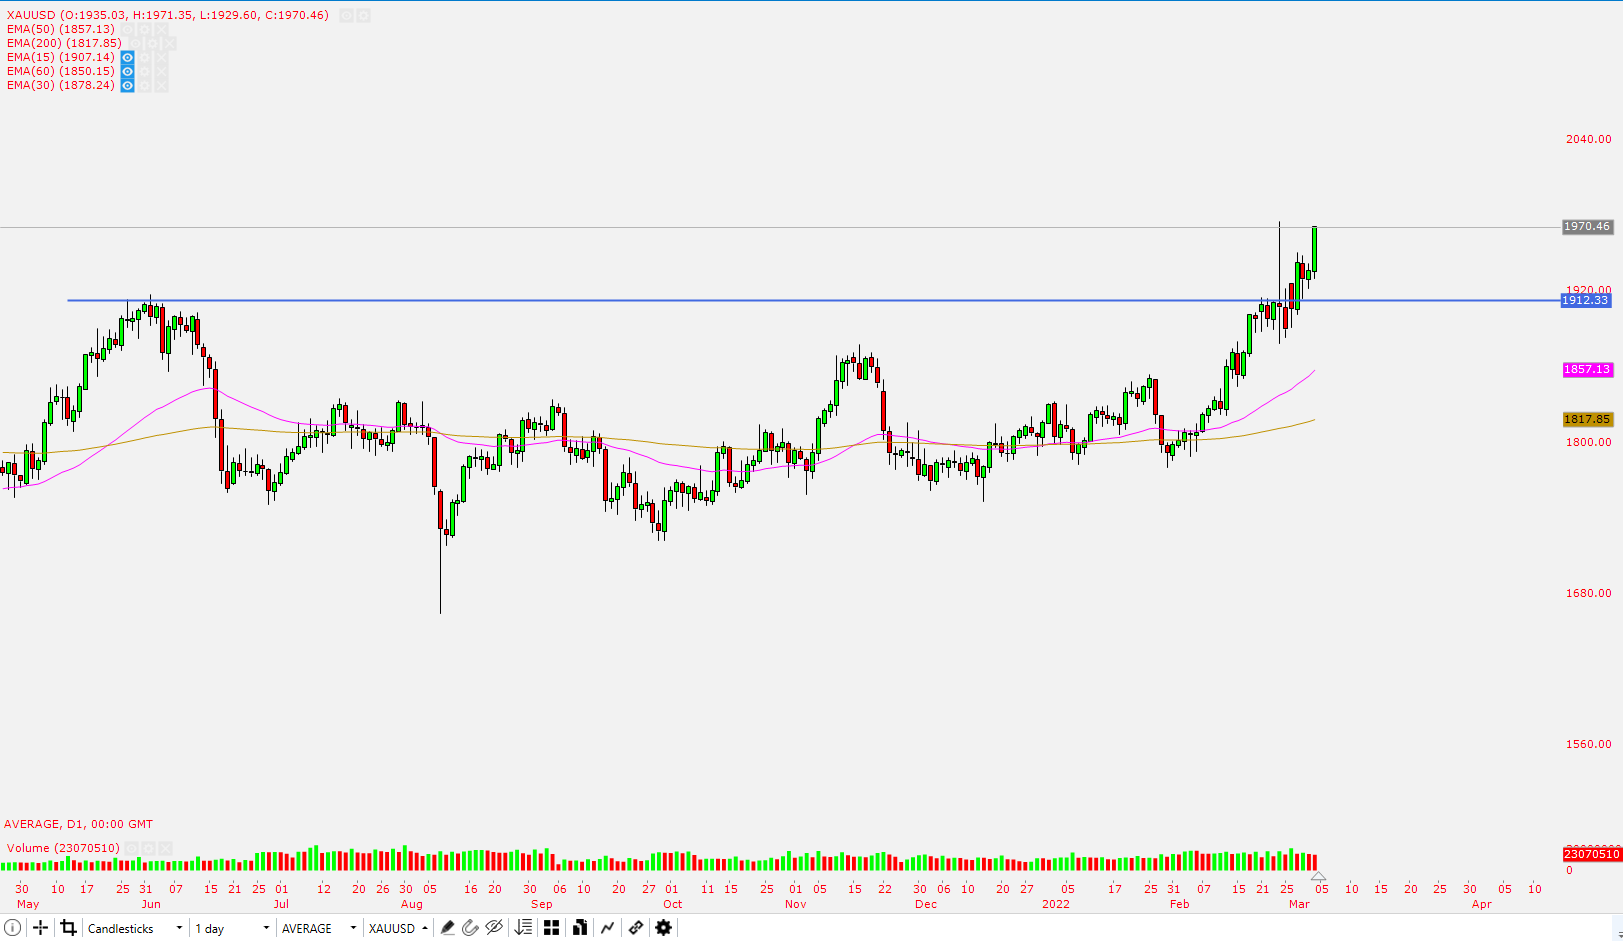
Gold
Lazy System update
We have a stop loss triggered. The ETF closed below the 30-day EMA as the Naspers & Prosus got hammered by the market last week. Going to be exiting the trade at the open on Monday
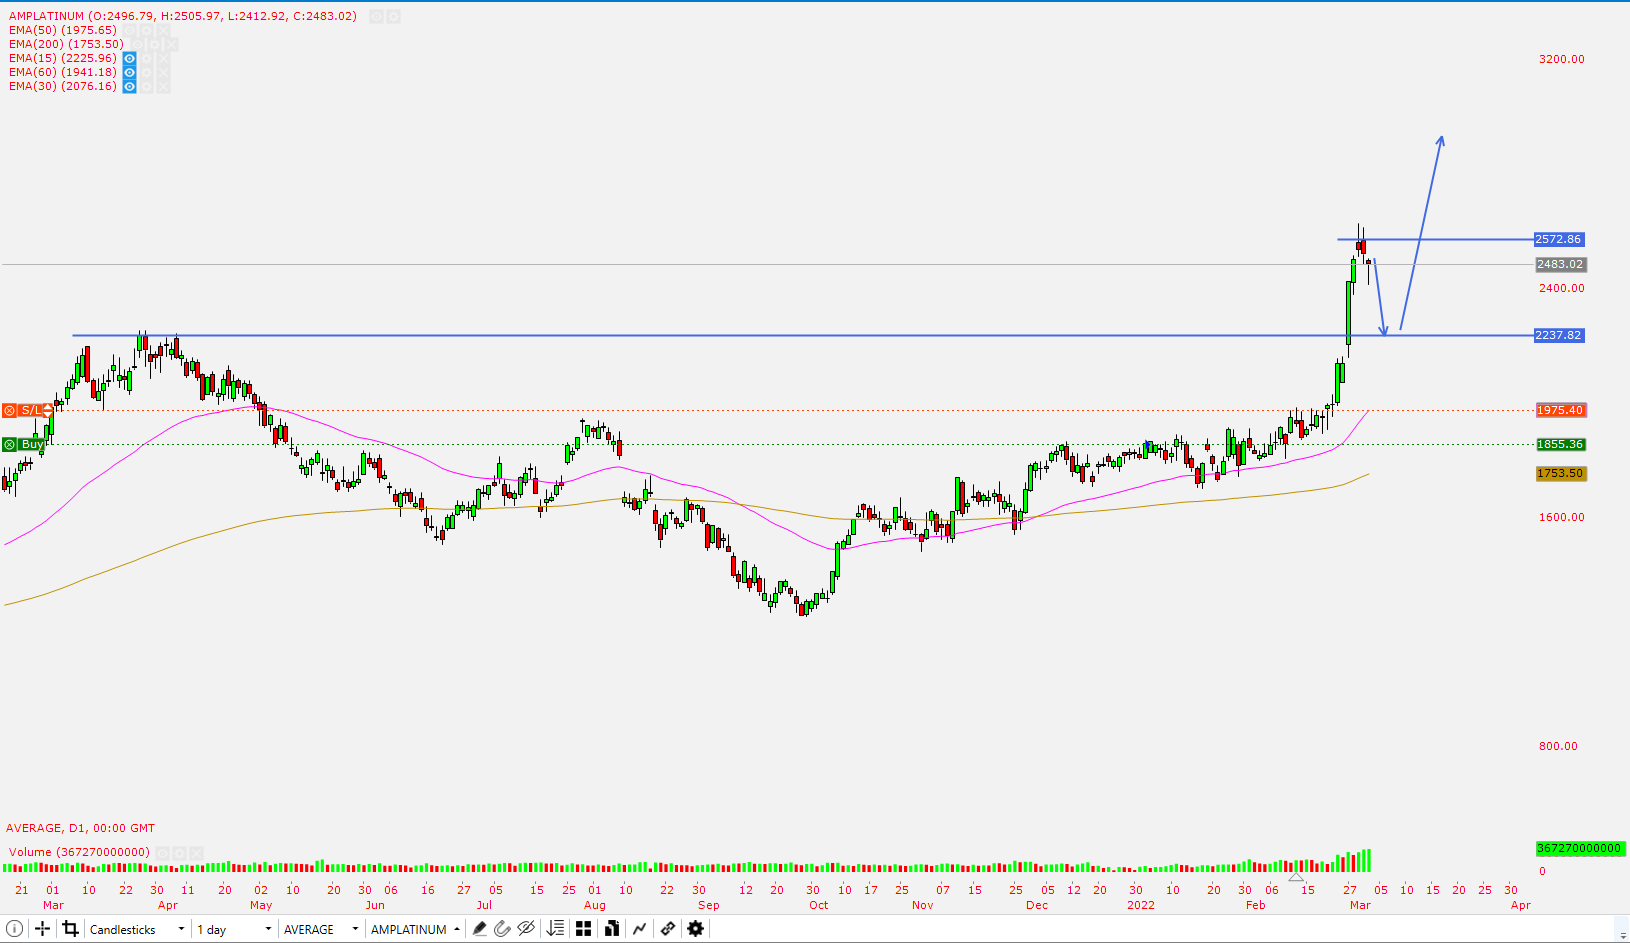
Amplats
The last 3 days of the past week was quite bearish. With a reversal pattern of a bearish engulfing candle. I think the market is about to shake of it’s first set of “weak hands”. With bullish conditions I think the reversal pattern is as a result of a stale bulls from the commodity super circle boom seeing profits for the first time since March 2021. Some people were caught and set with a losing position for a year and would be happy to break even or take the profits they haven’t seen in a year. We could see the market come to the R2237 resistance and provide good buying opportunities to pick the “dip”. I will be looking for a reversal pattern back to the upside this week. To raise my stop and add to my position.
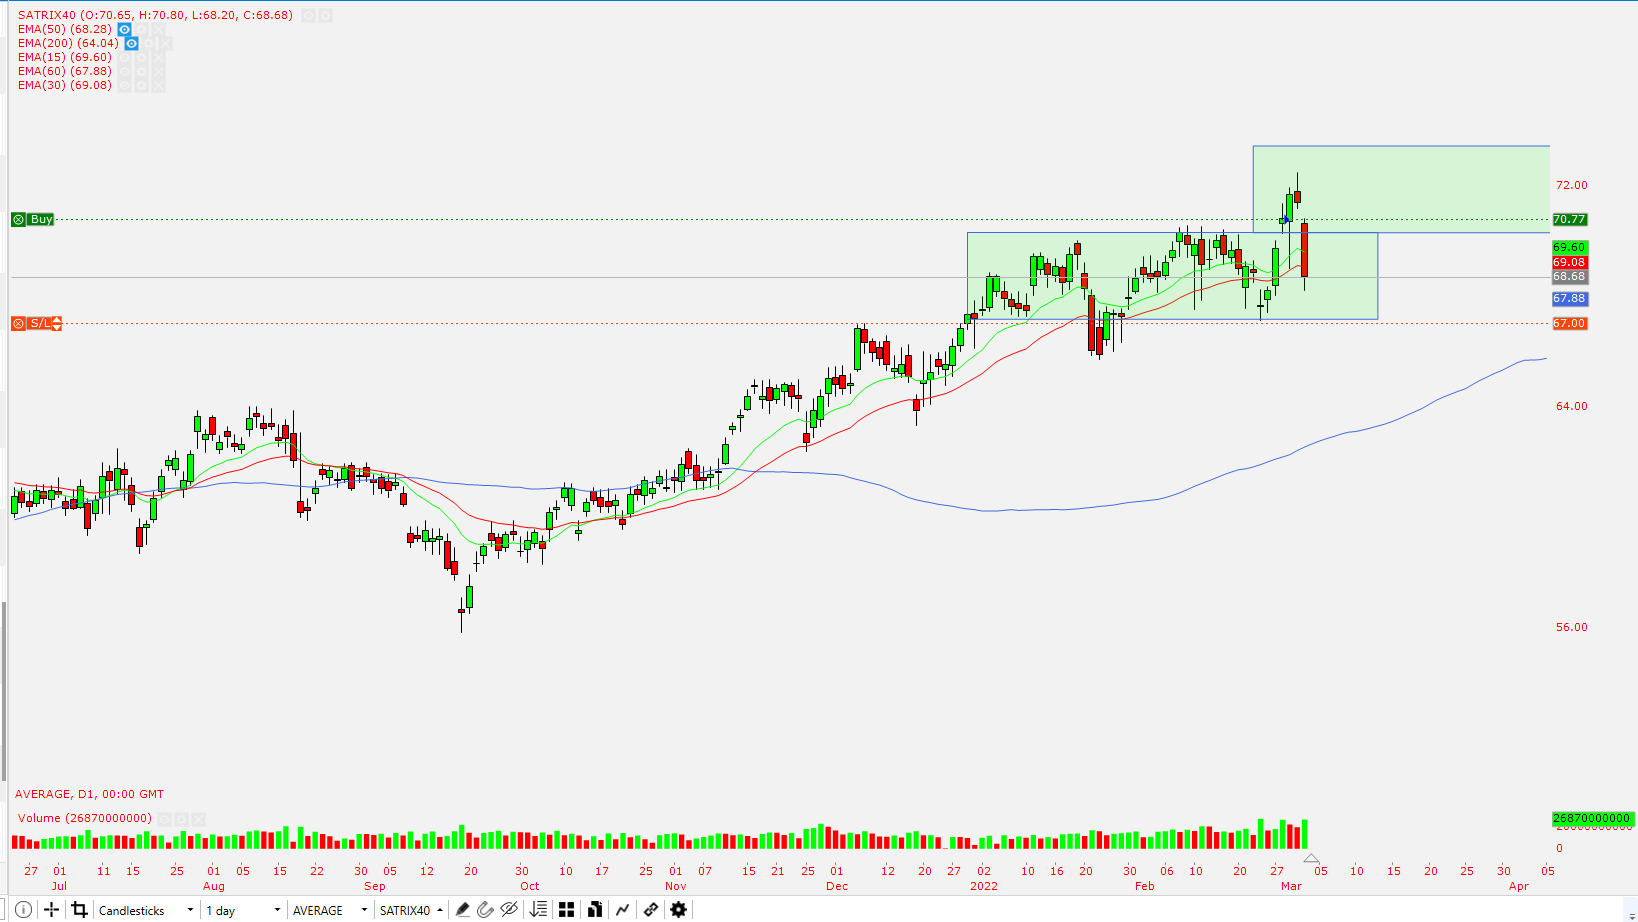
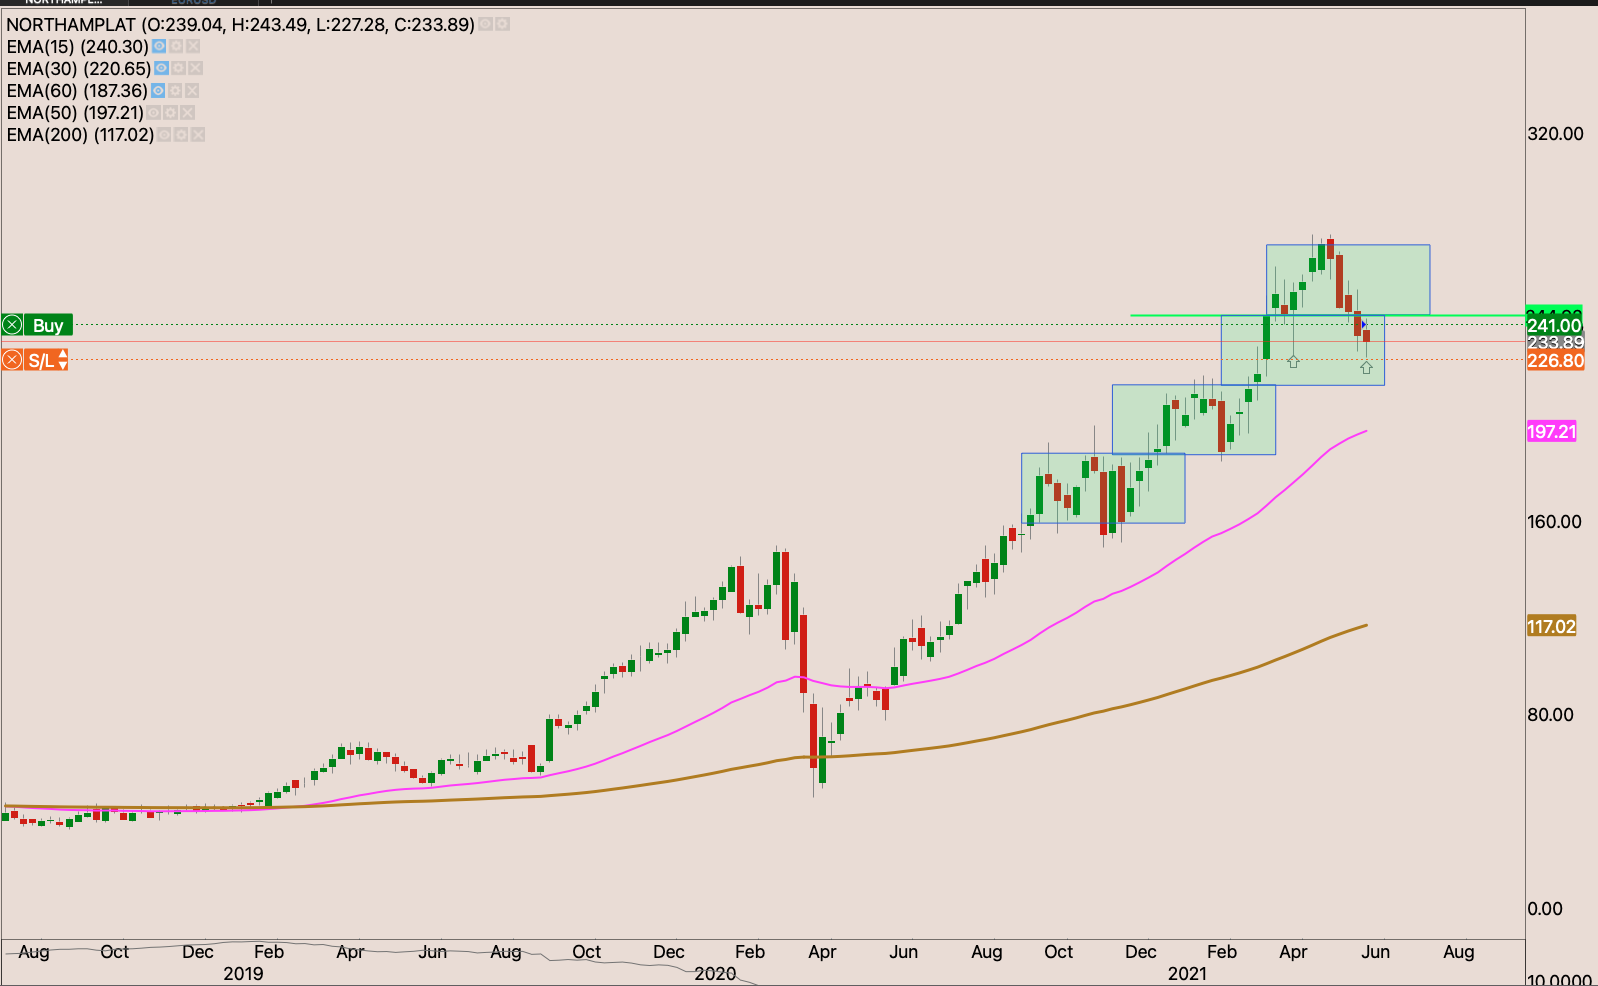
Northam Platinum
The stock found some selling at the R259. I’m waiting the break of this level on the up side to then raise my stop loss and add to my position. I think will have a strong rally once the stock breaks R276.50.
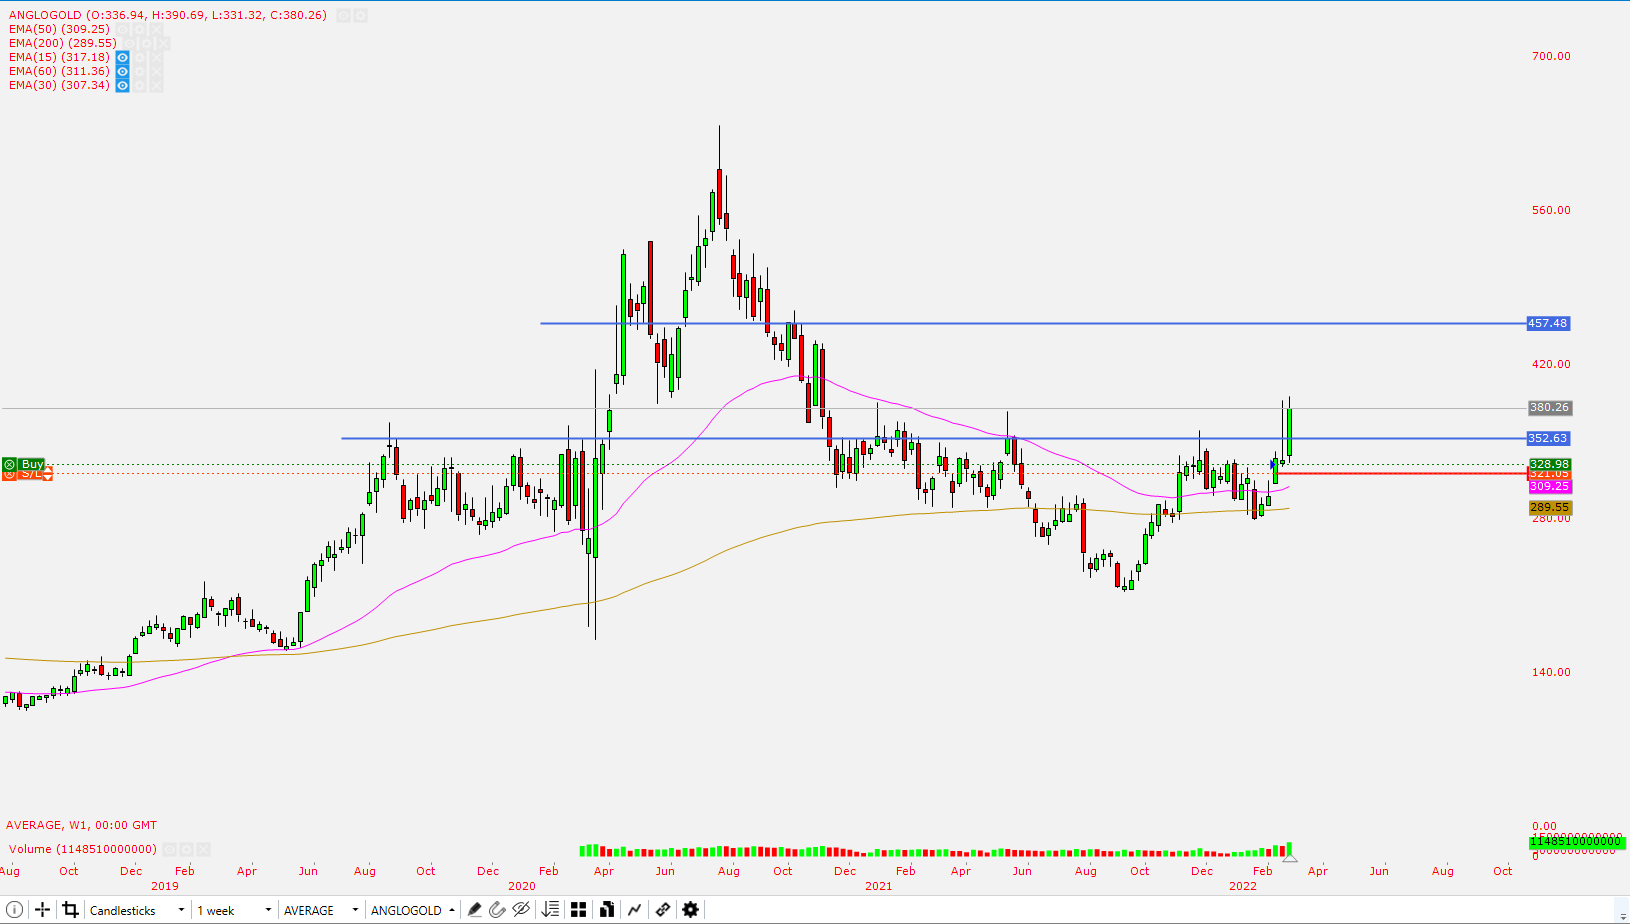
Anglo Gold
The broke out and retested the resistance and held it well as support from the other side. I raised my stop loss slightly to just under the 50-day EMA to R321.05 reducing my risk to -0.22%. I will be watching the price actions for an opportunity to raise my stop and add to the position.
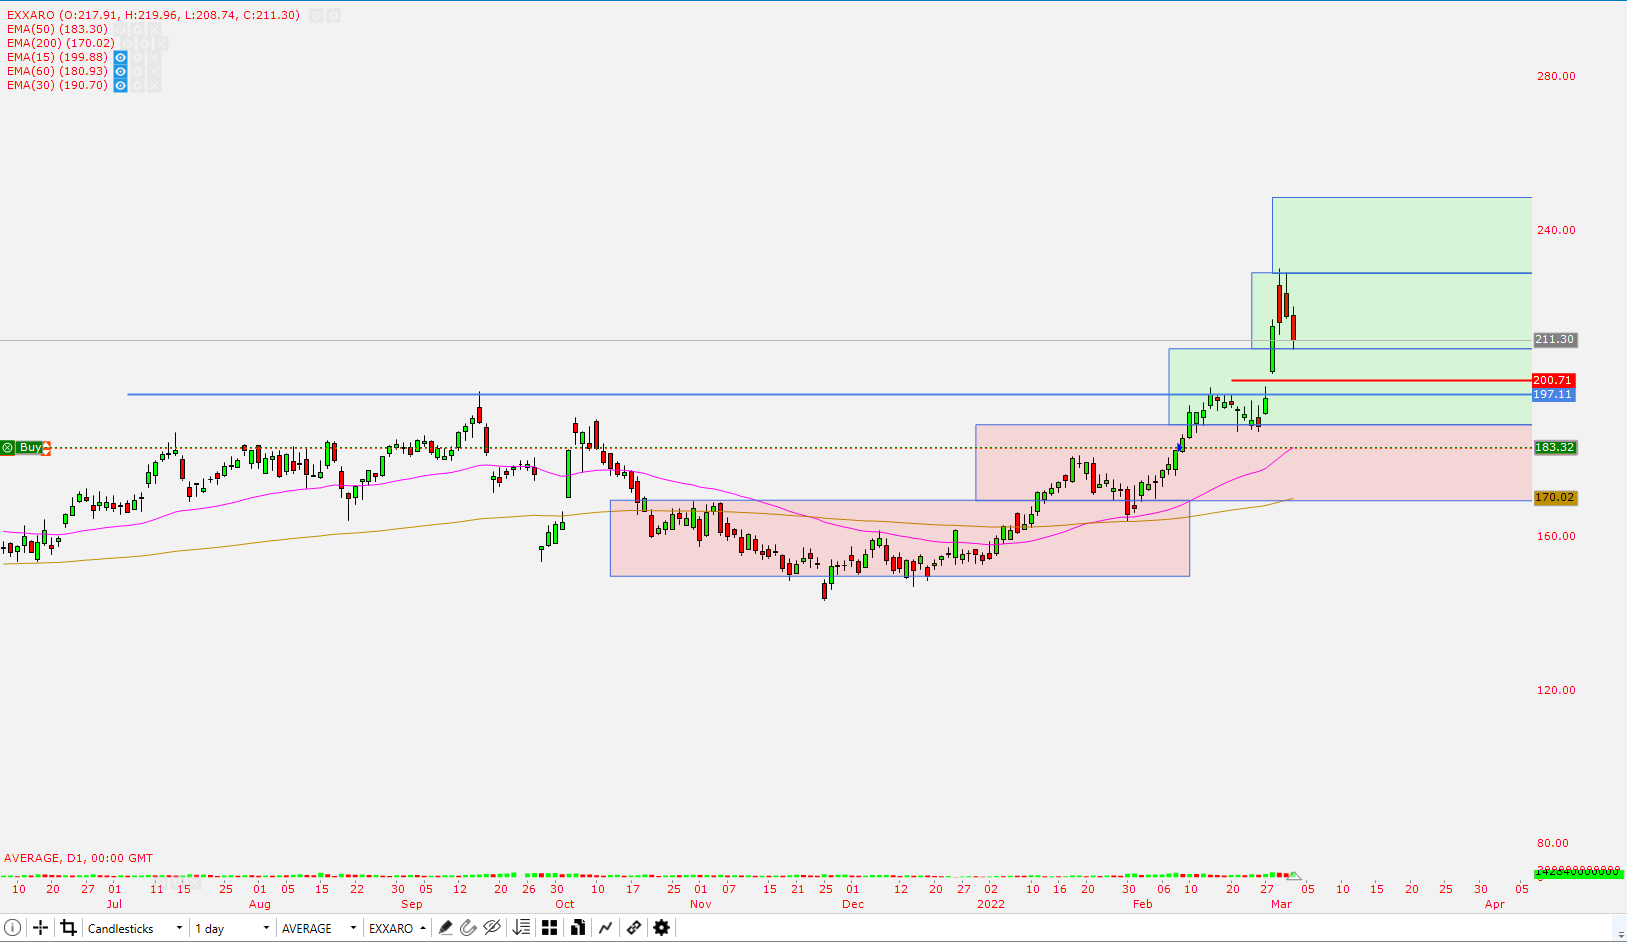
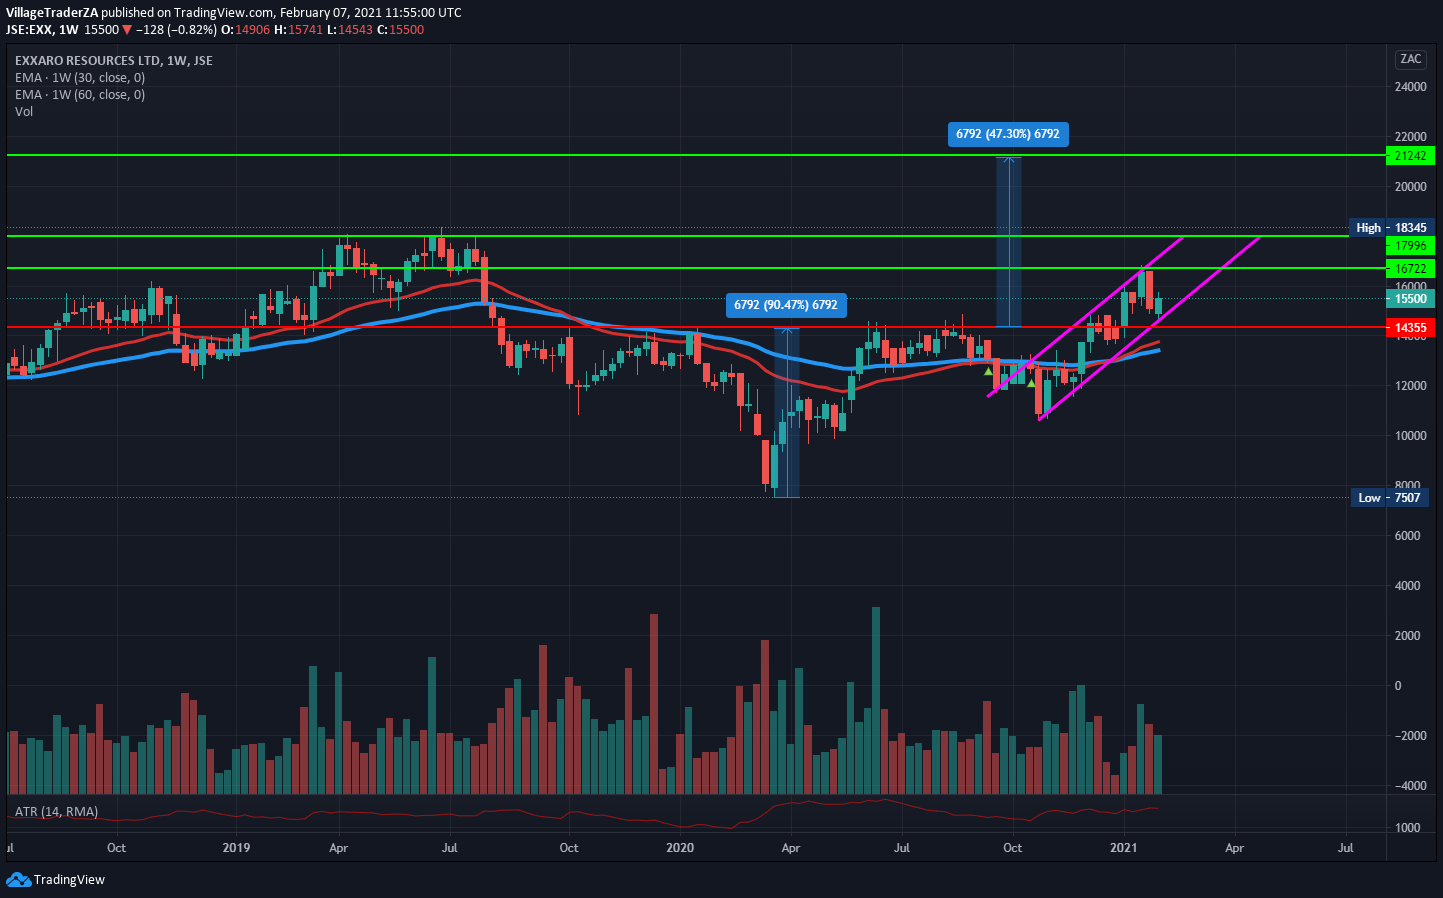
Exxaro
The stock has been moving to higher boxes I held off in adding to my position when I raised my stop loss to R183.32 though my stop loss is a break even. I eexpect the market to rested the R197 resistance. But if the current base holds up. I will raise my stop loss to just below the gap and drive candle to R200, and add to the position
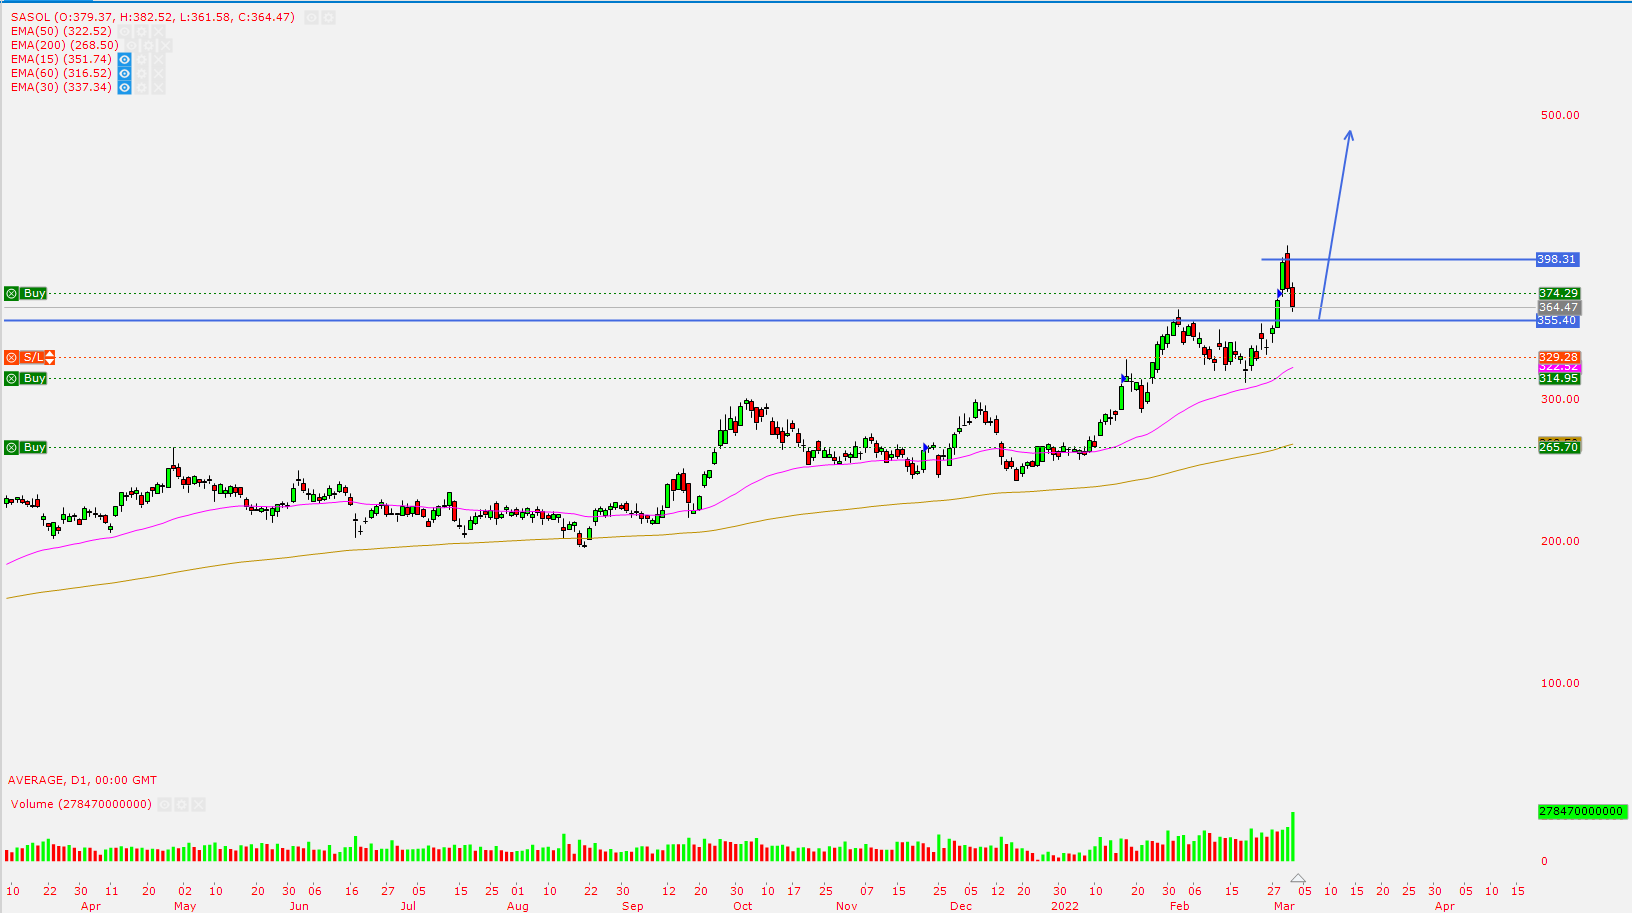
Sasol
As oil continues to make new highs Sasol continues to benefit from that. The stock saw a bit of sell of last couple of days, coming to perhaps retest the R255 resistance. I’m waiting for the stock to break R398 to look for a place to hide my stop loss.
S
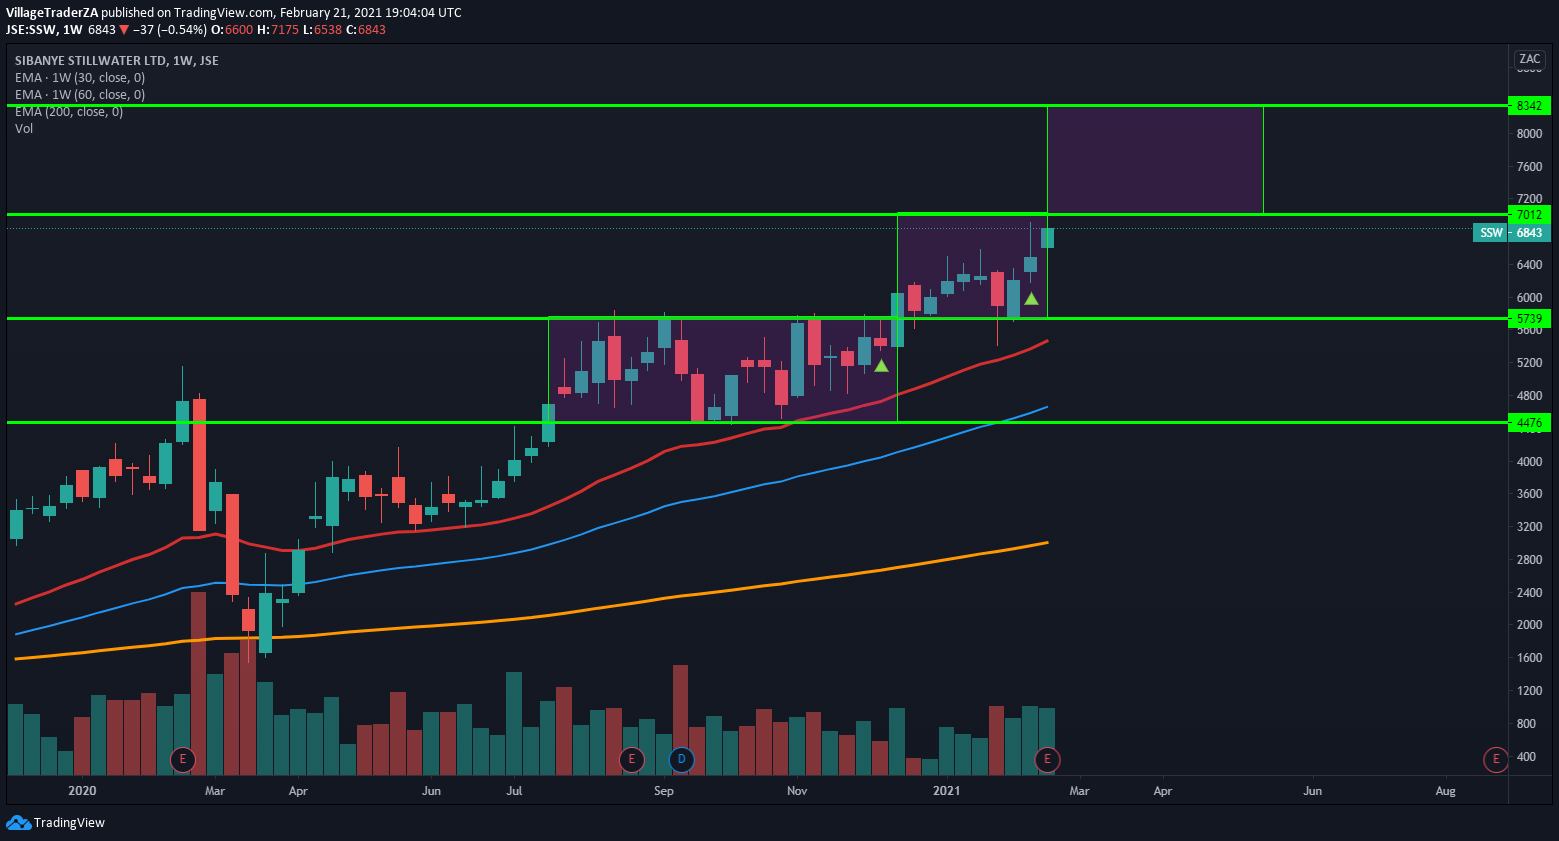
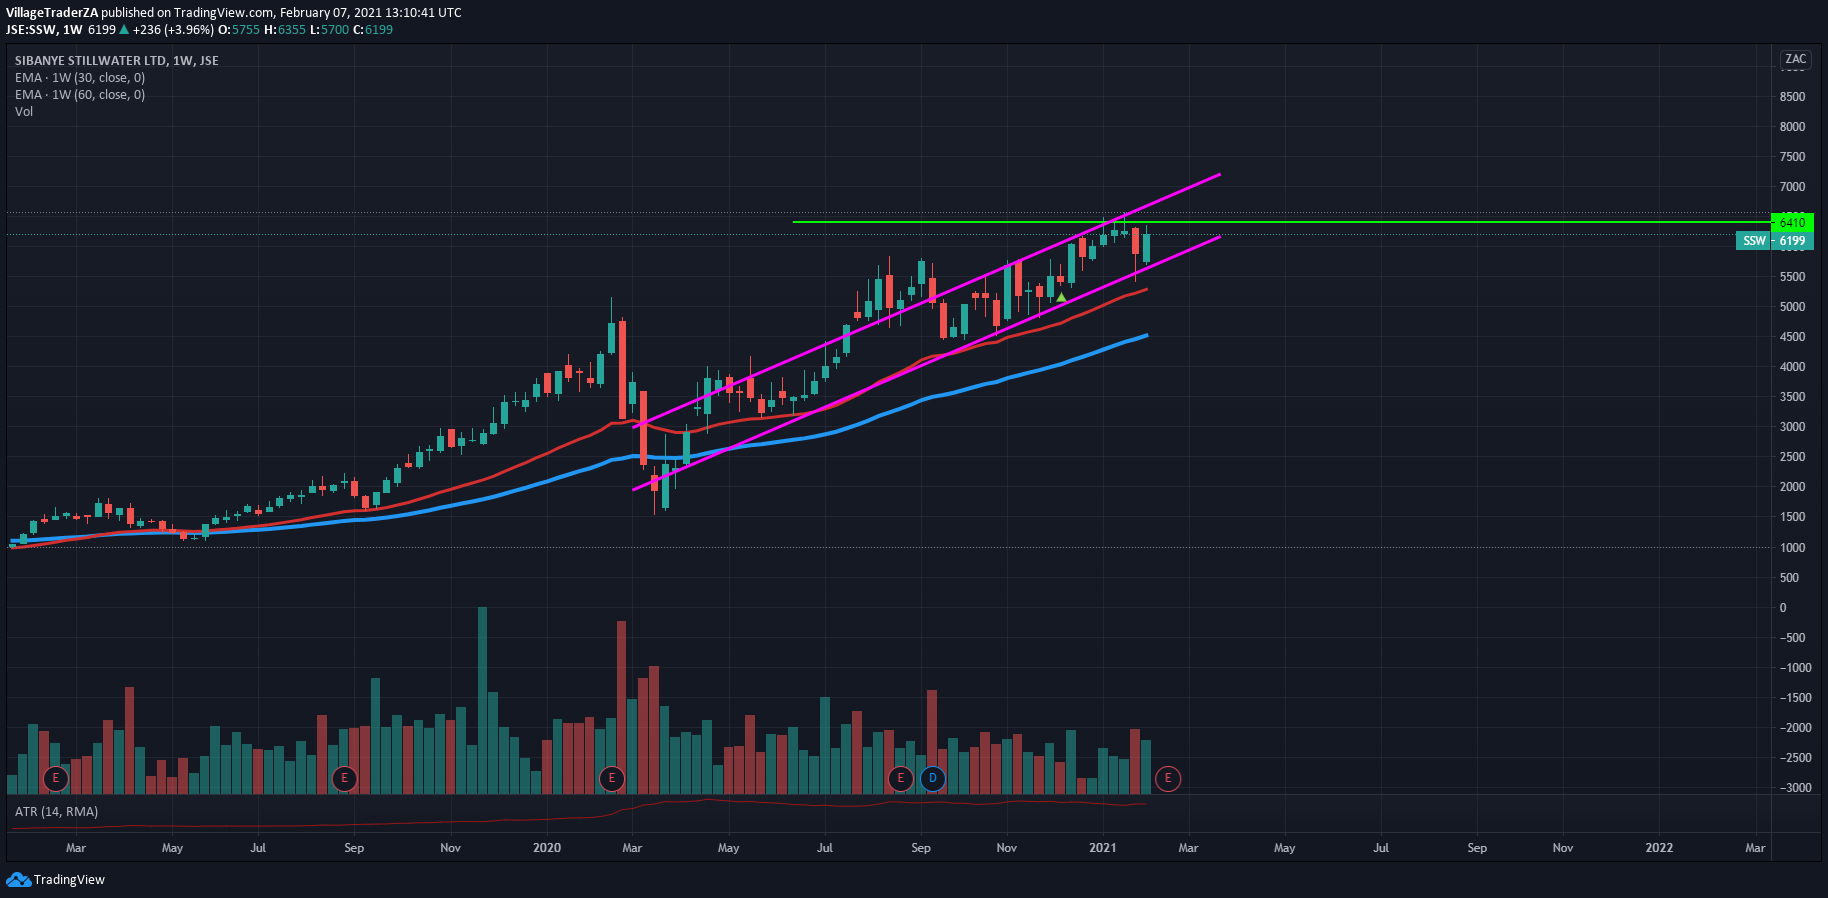
Sibanye
Sibanye came with strong interim results. Increased earnings and declared a dividend. Trading at 6-7x PE ratio. With rising platinum and gold price. The company will likely sell in rising price. The stock looks quite cheap indeed. I’m waiting for last Wednesday’s doji which was then engulfed on Thursday to be invalidated with a close above R76.45 to look for a higher place to hide my stop loss perhaps just below the 50-day EMA around R60.40

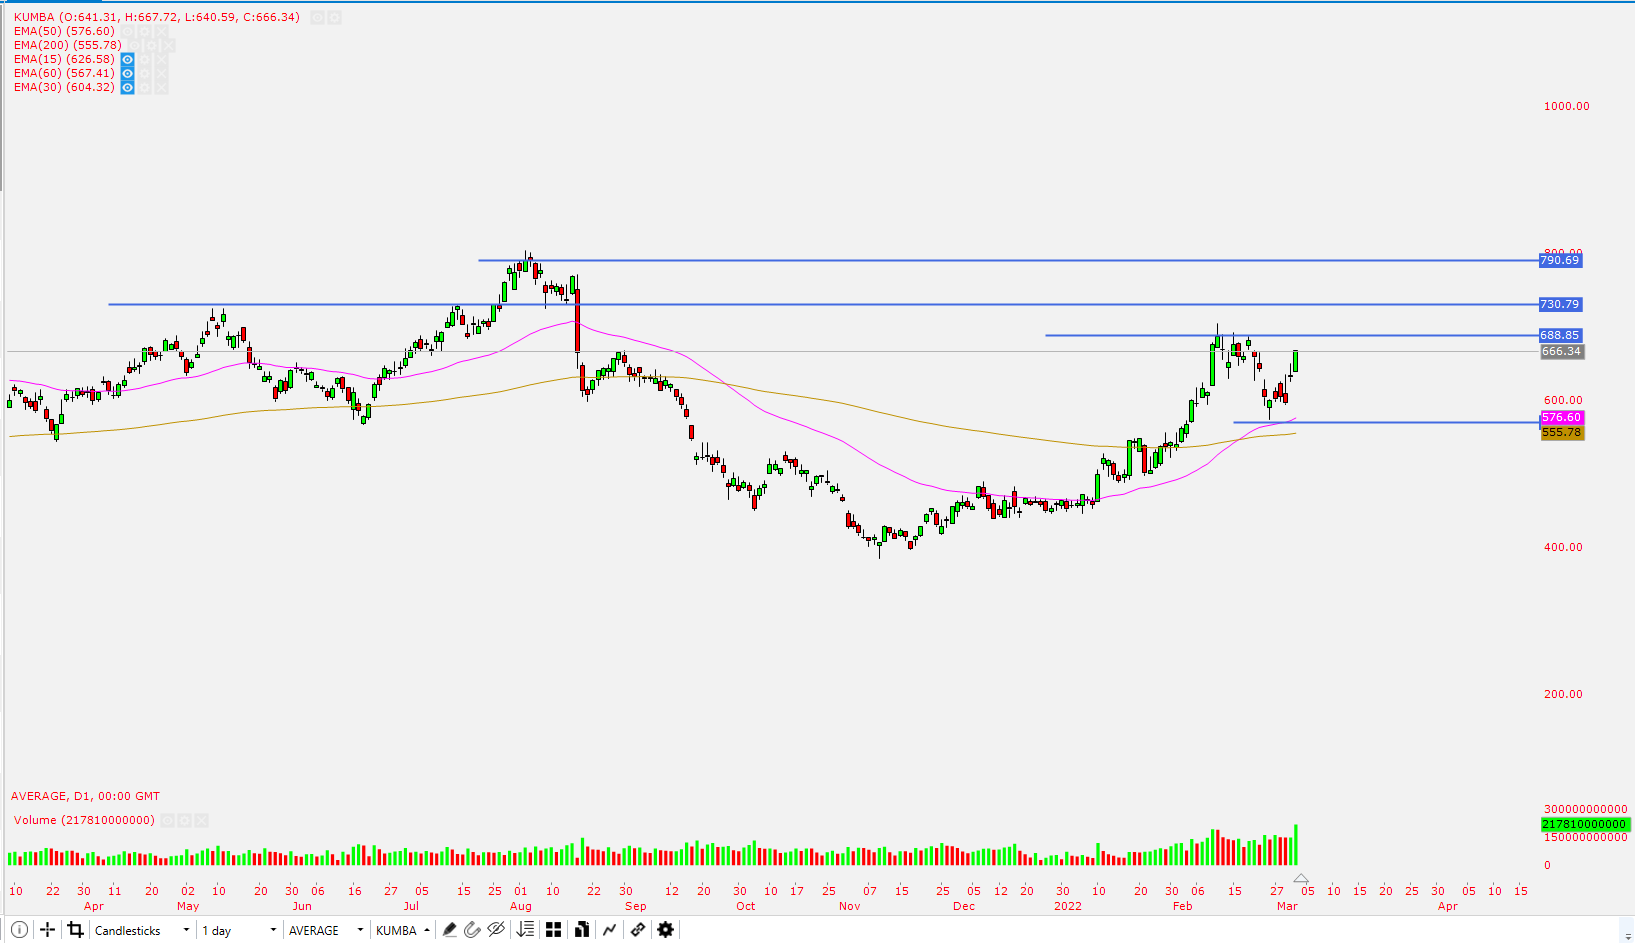
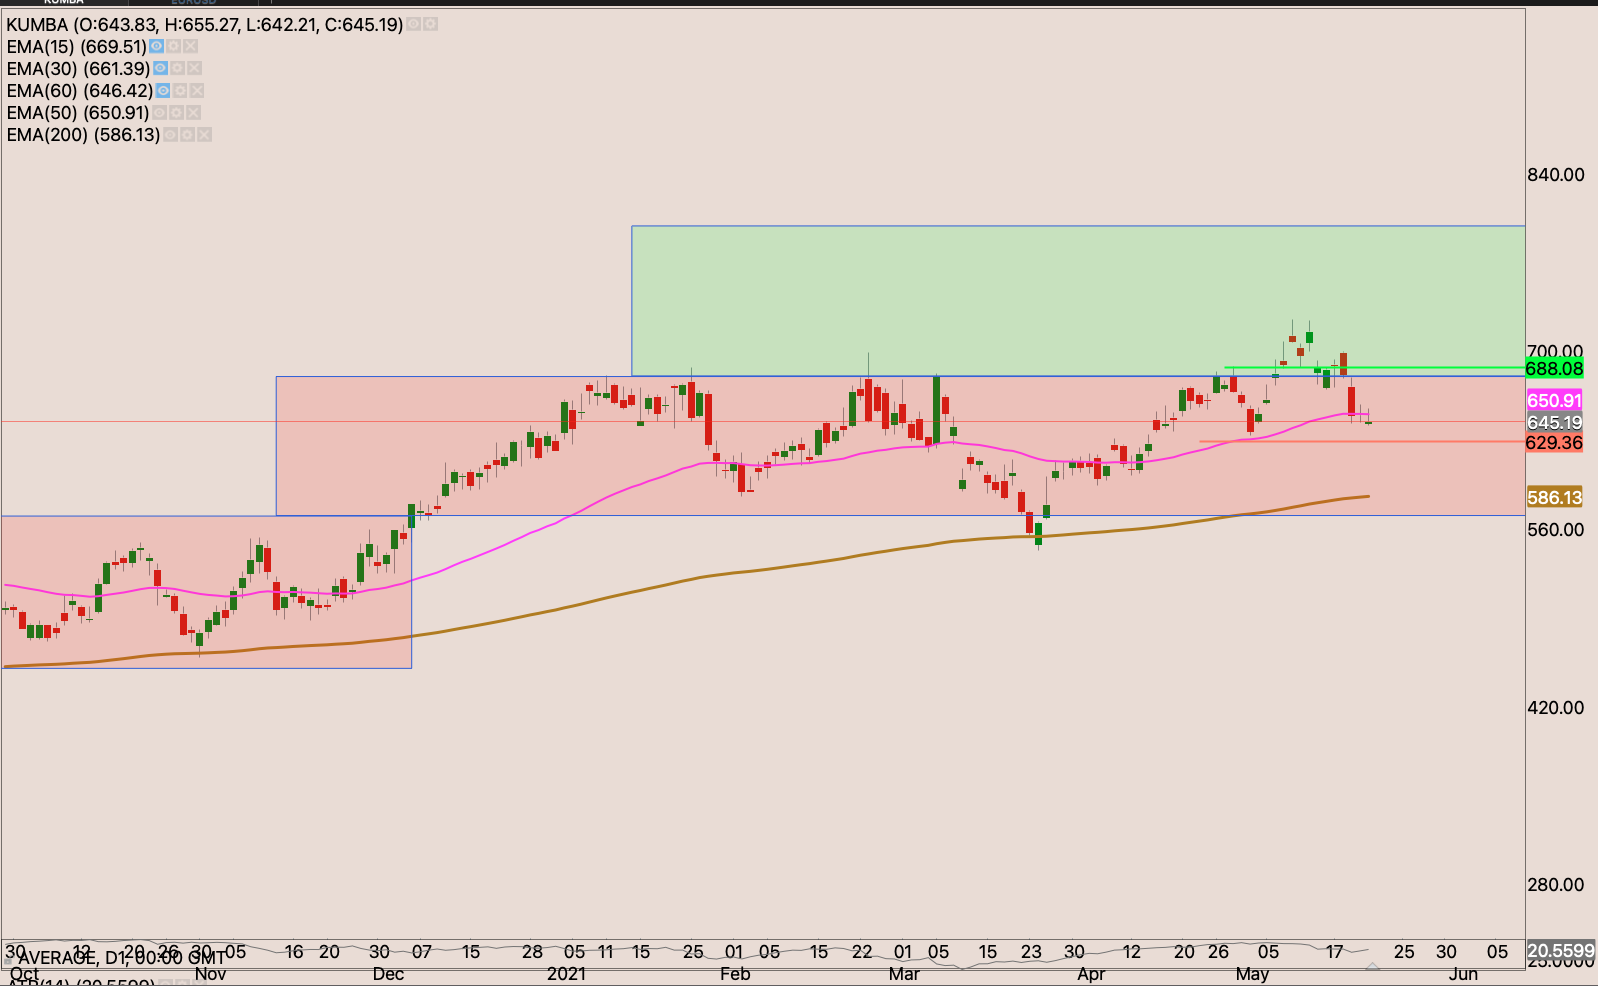
Kumba Iron Ore
The stock got sold off quite a bit down to the 50-day EMA, and it held strongly. Now I’m waiting for a close through R668.85 to start building a position. I expect the stock to have some reaction at R730 & R790. I will be looking for places to hide my stop and perhaps add to the position, but for now I wait.
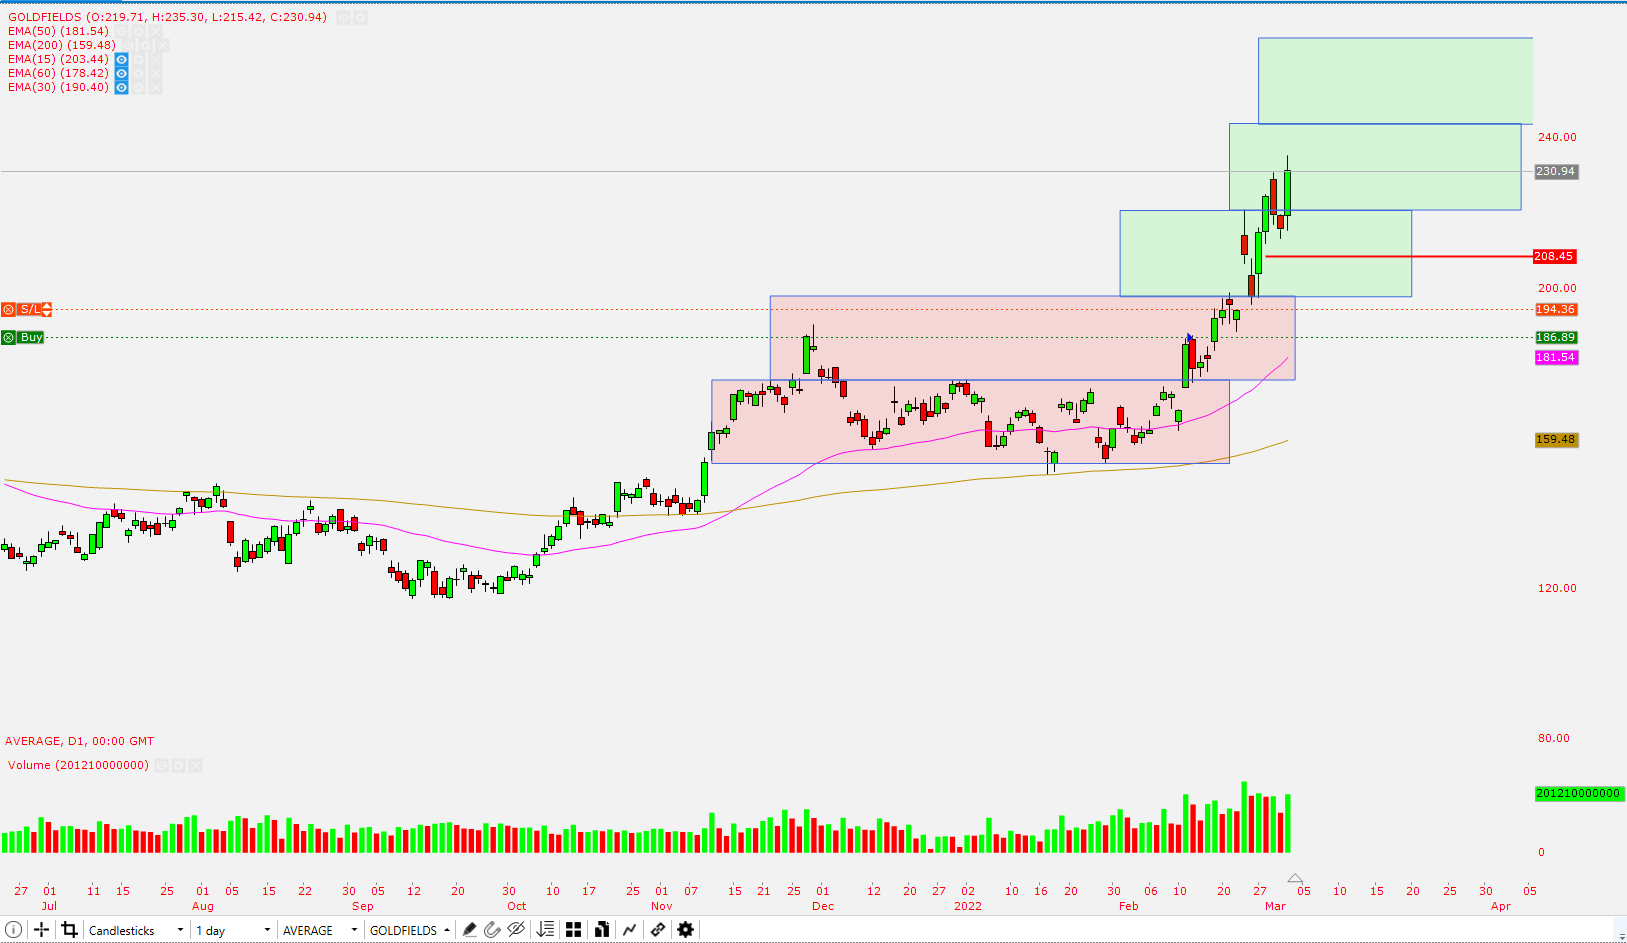
Goldfields
The stock moved to a higher box, not without dunking to the lower box. I raised my stop loss to R194.36 raising my position to just above breaking even at +0.28%. I will add another 1% risk to the position with 2.6 shares
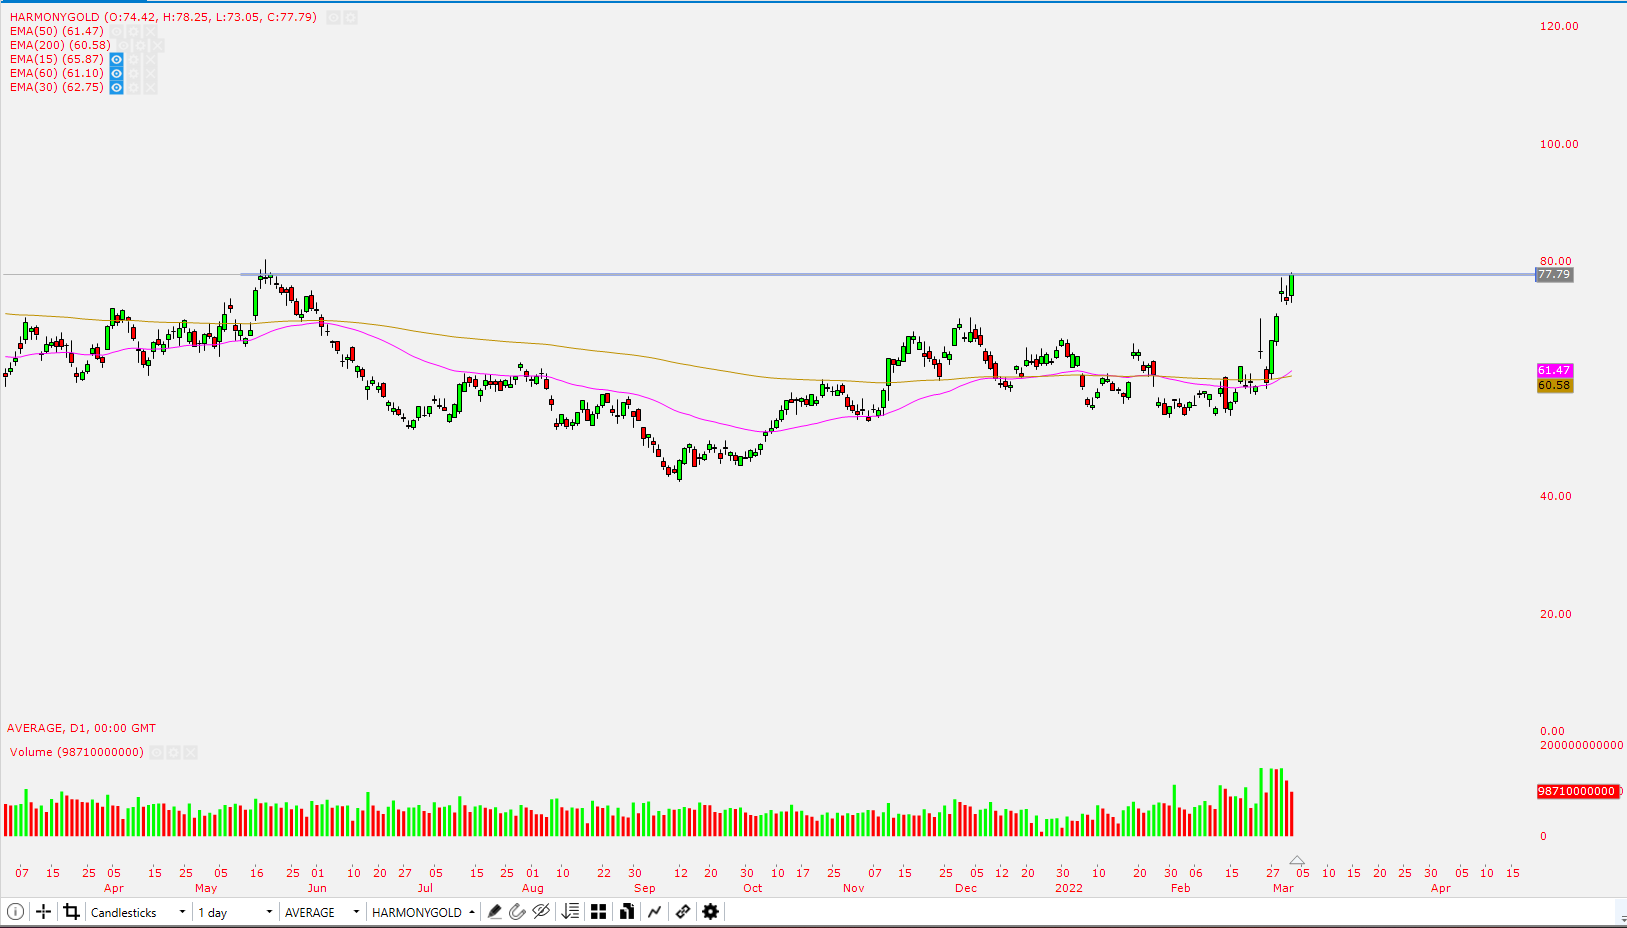
Harmony Gold
We have a golden cross on the stock. It close bang on the resistance on Friday. Perhaps it was genuine resistance or sellers were saved by the bell. I’m waiting to see how the market reacts this week. If it continues to break. I will start building a position on the stock
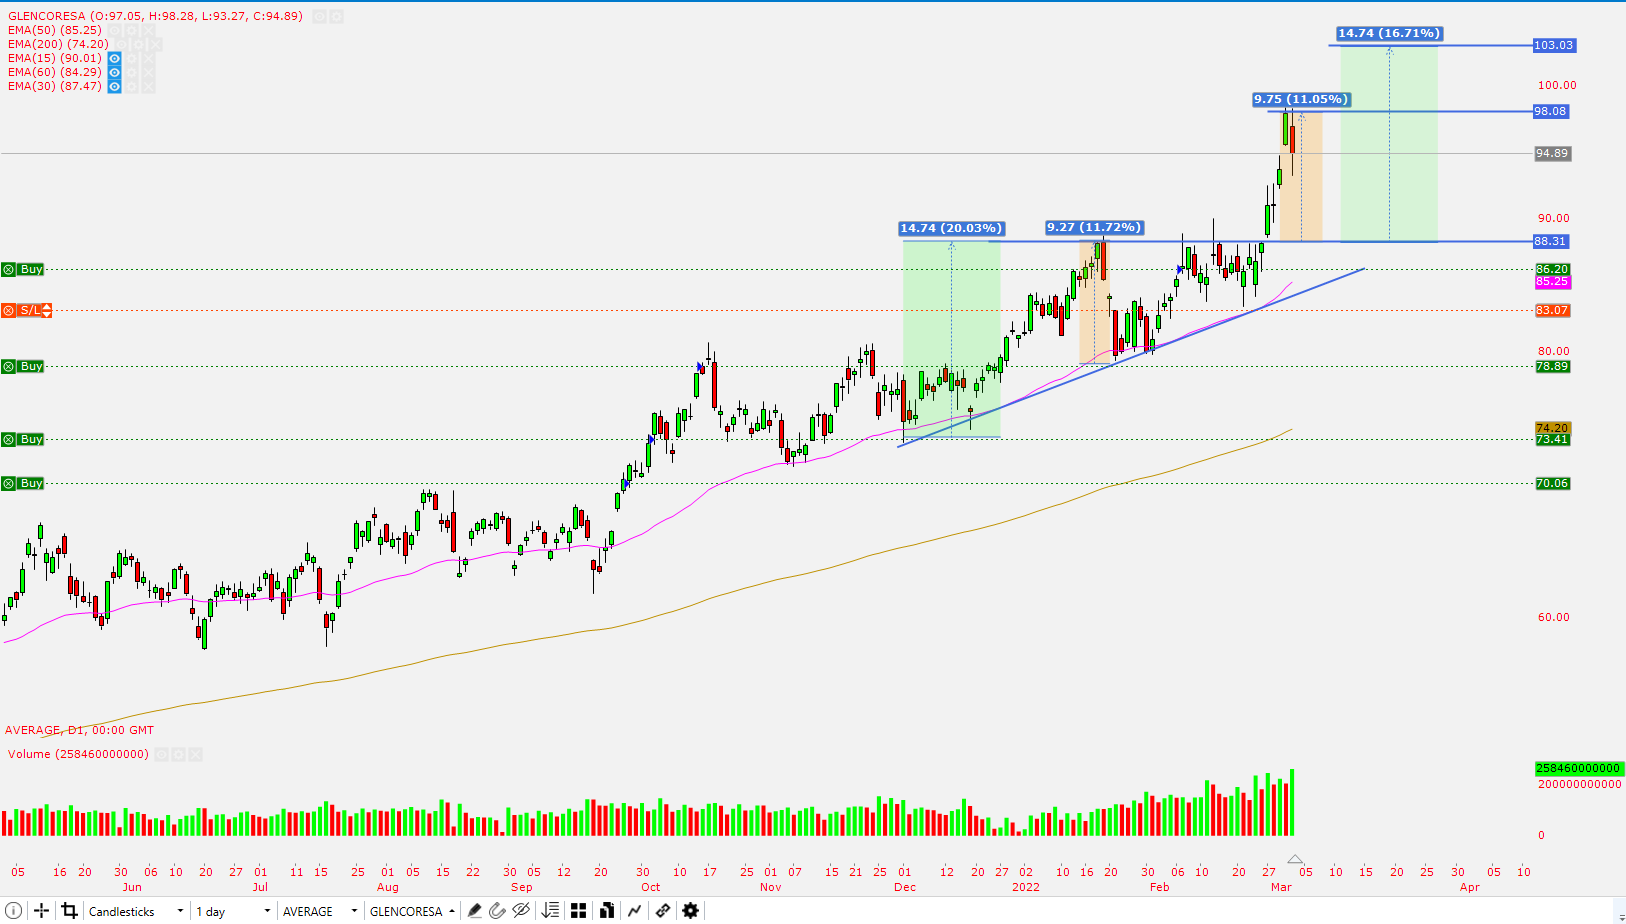
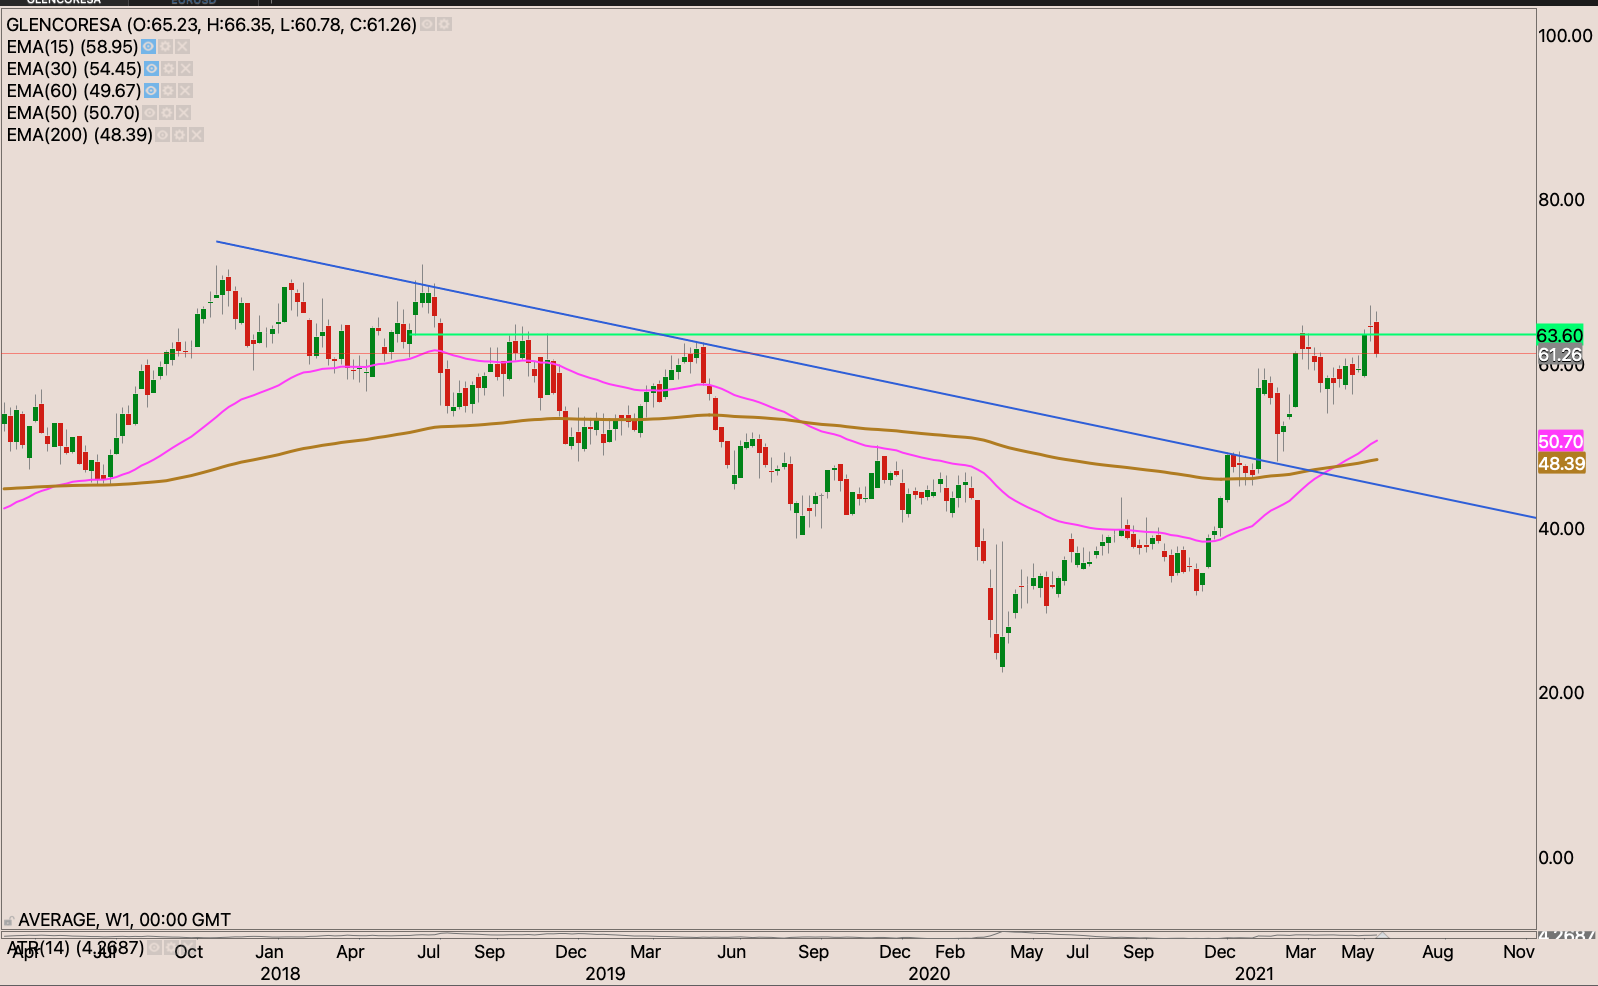
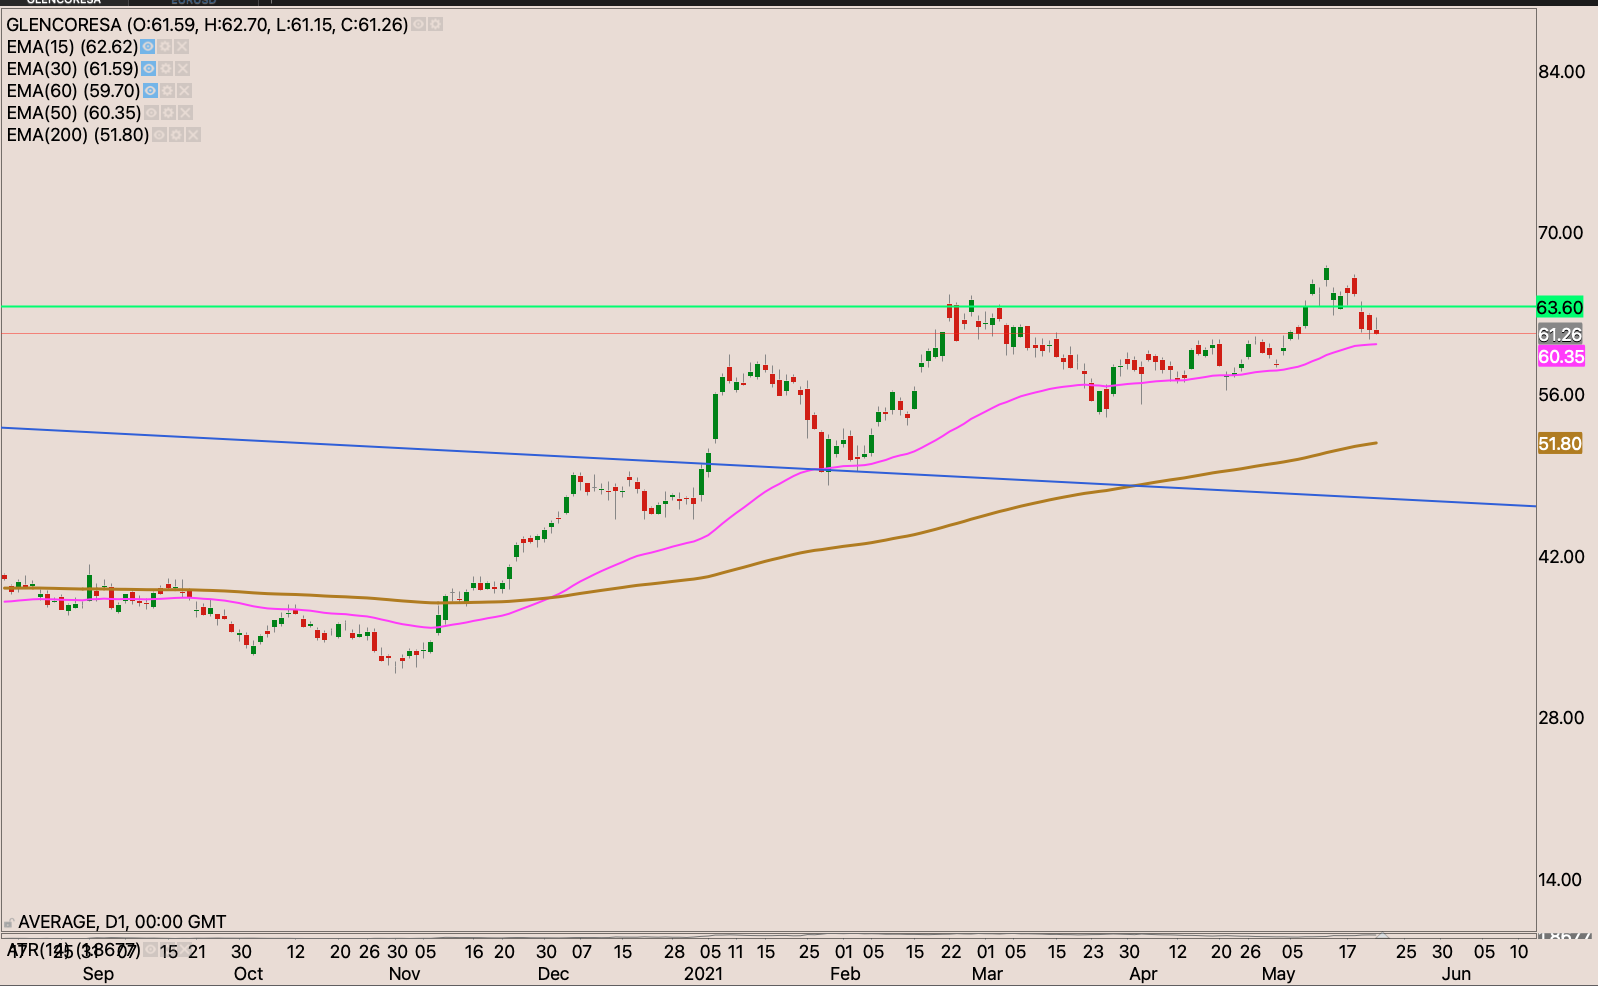
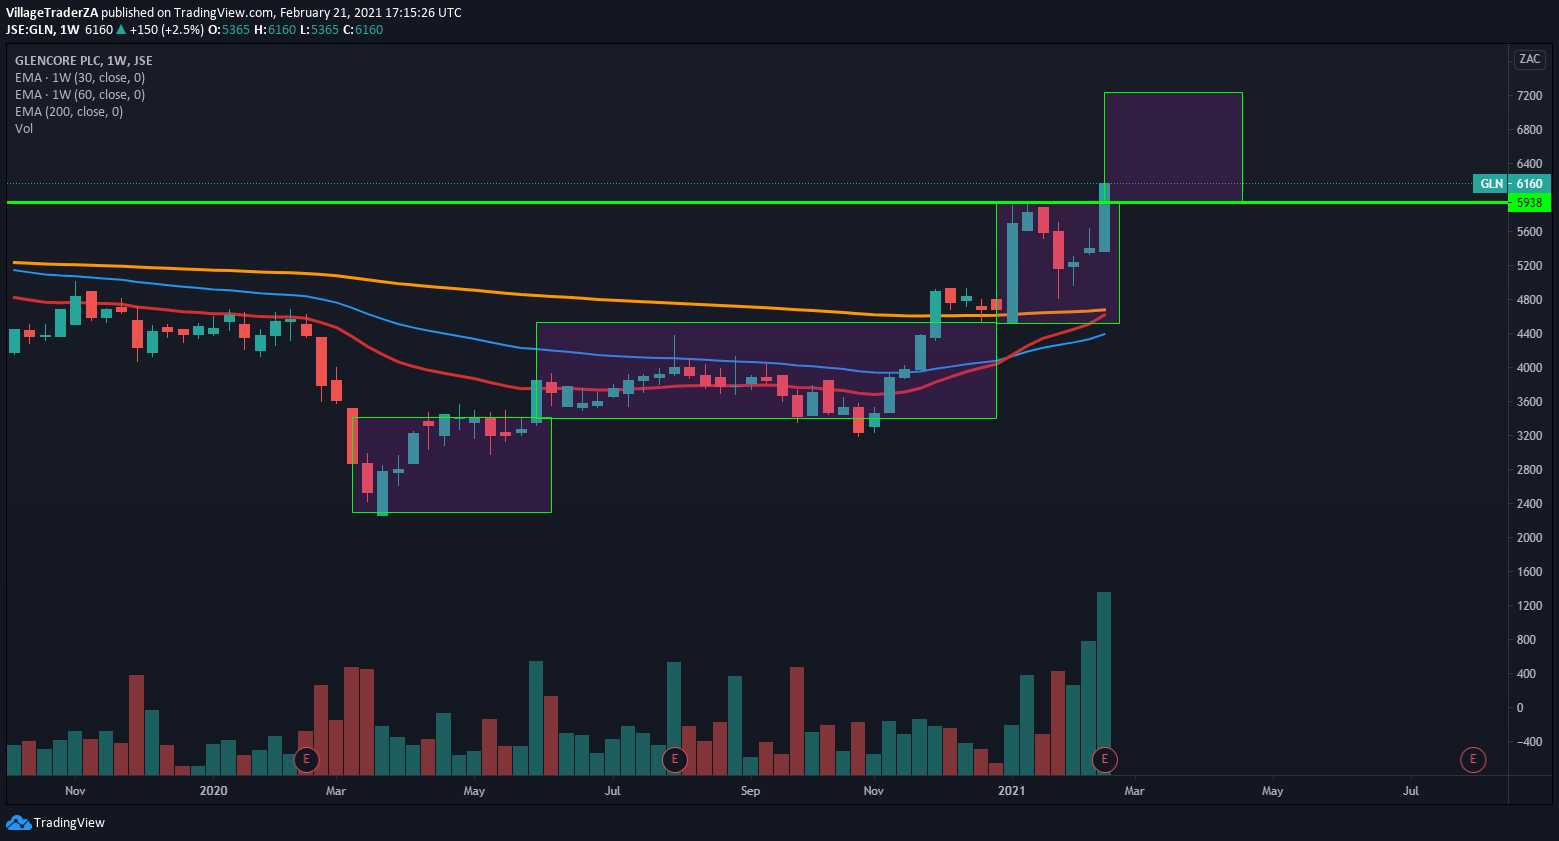
Glencore
The reached it ascending triangle short term target with no surprise found some selling at the target level. I except the R98 level to hold up a bit as it become the new area of memory for the market. When the market breaks this level I will look for another place to hide my stop loss. And possibly add to my position
Retail
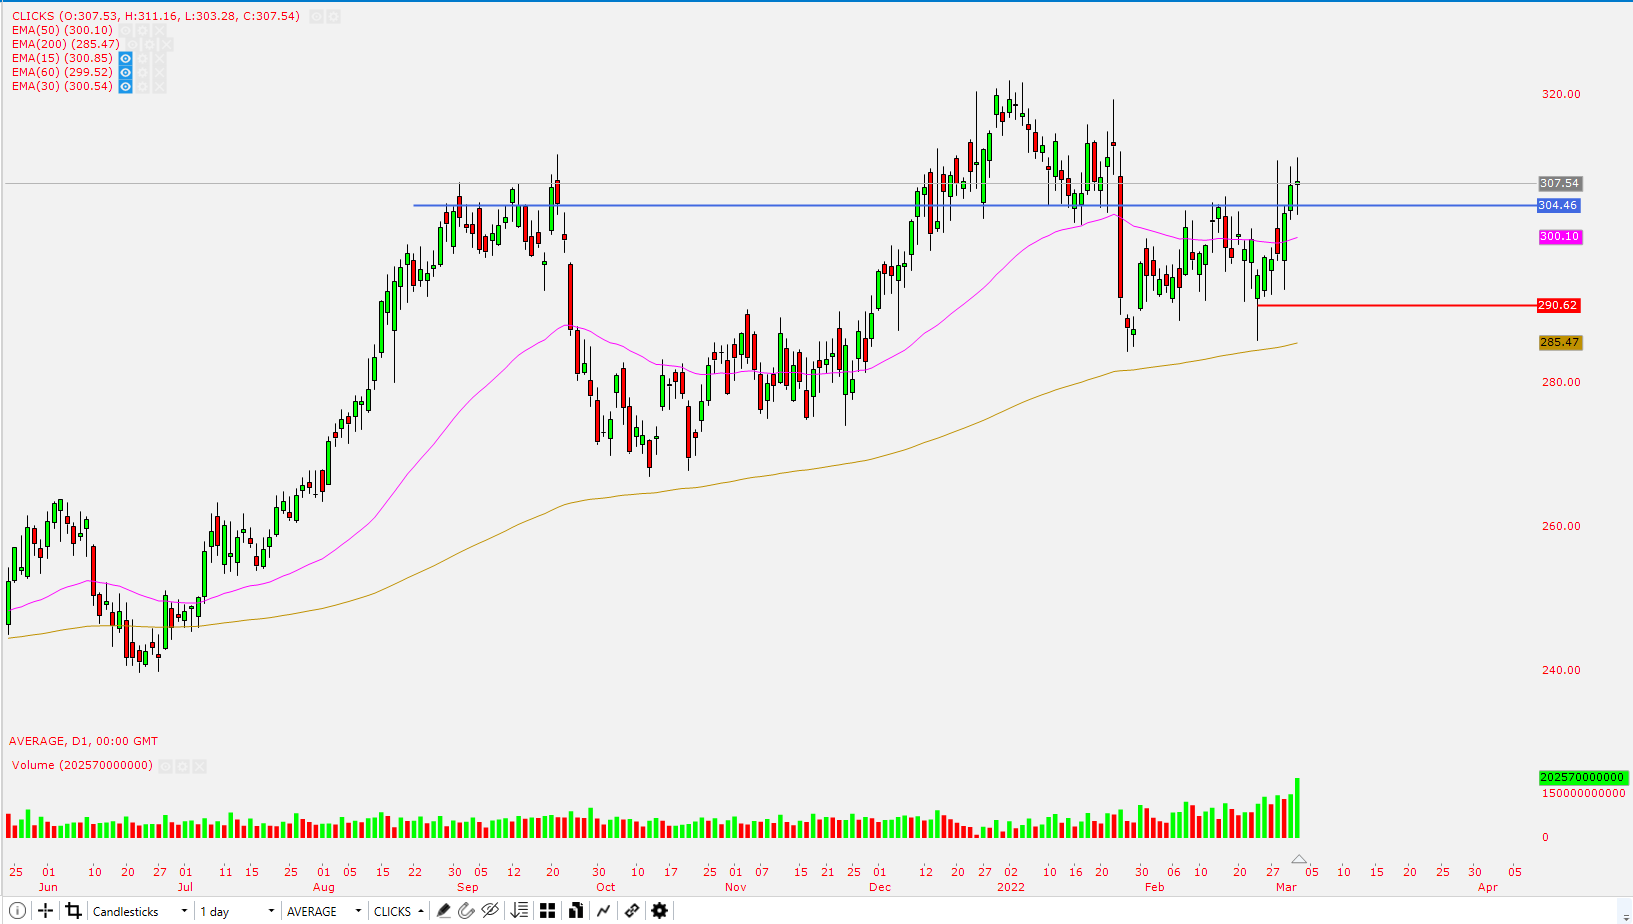
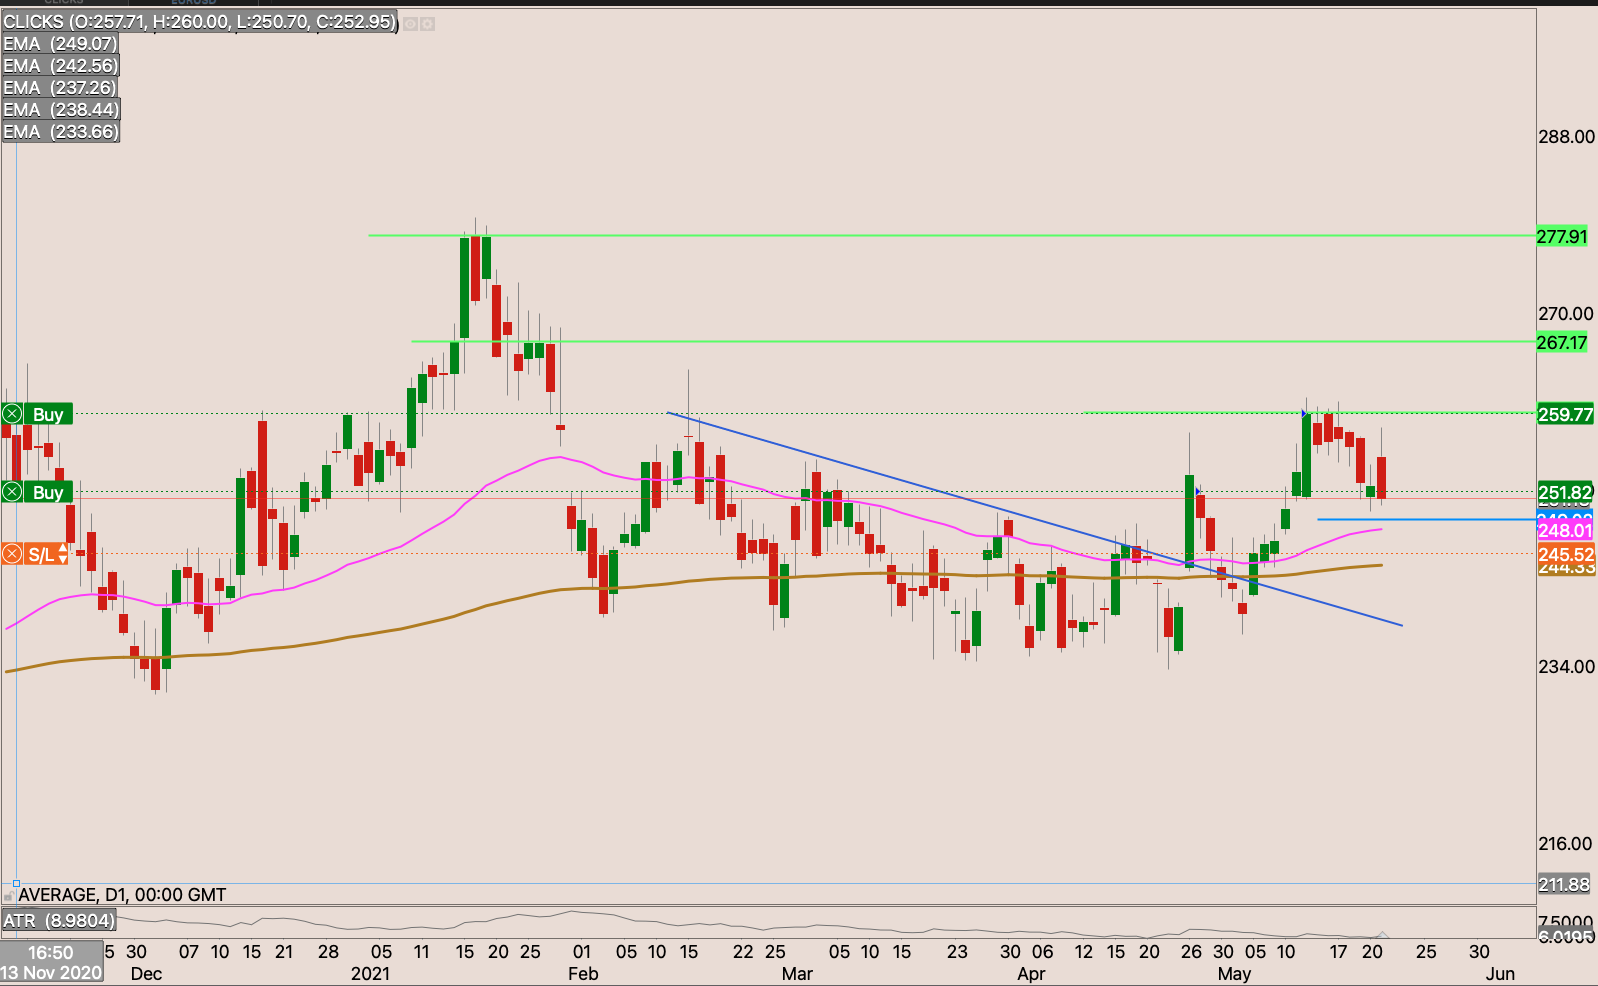
Clicks
The stock came back above the 50-day EMA breaking the R304 resistance. I will build a position on the stock, with an initial stop loss at R290.60. Putting 1% risk with 5.6 shares.
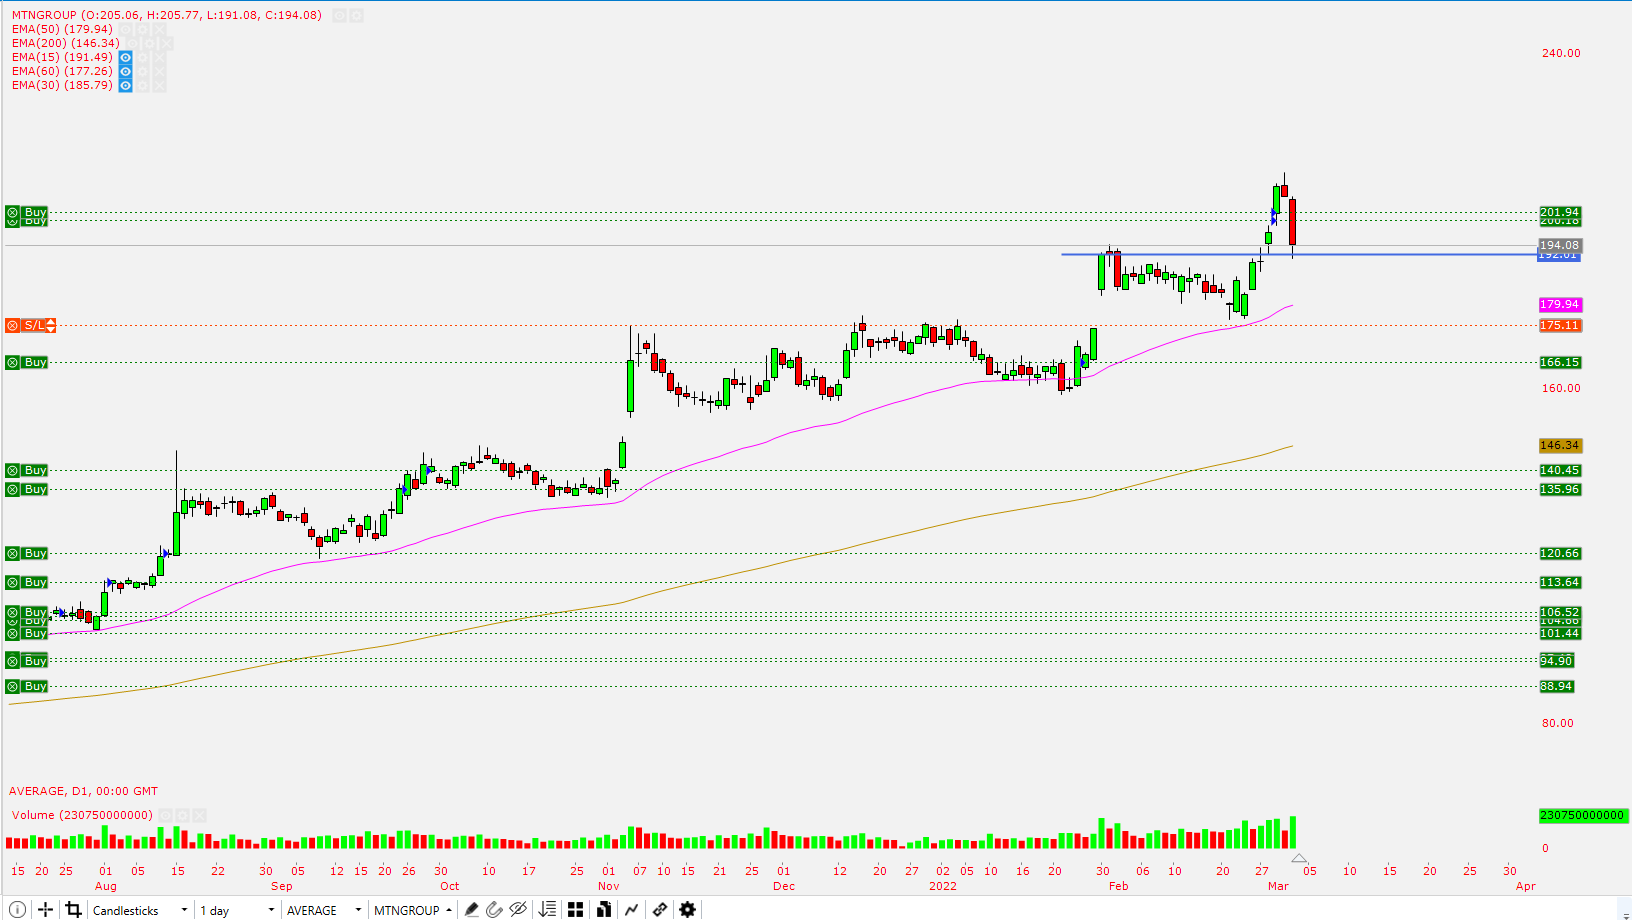
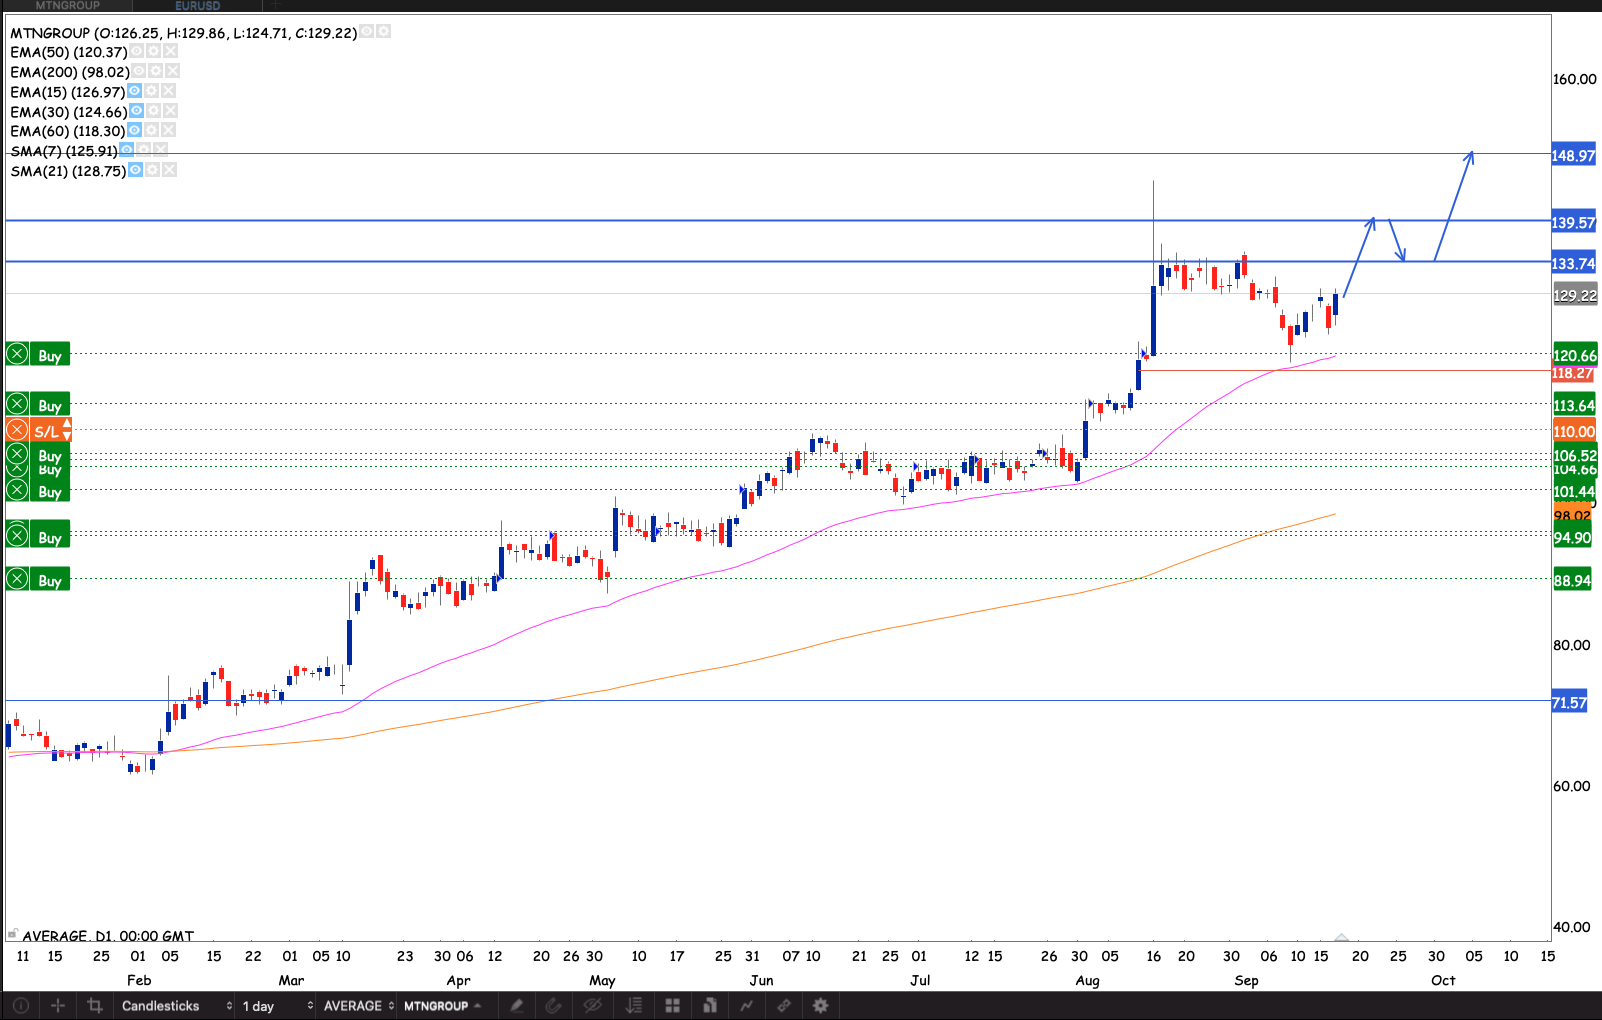
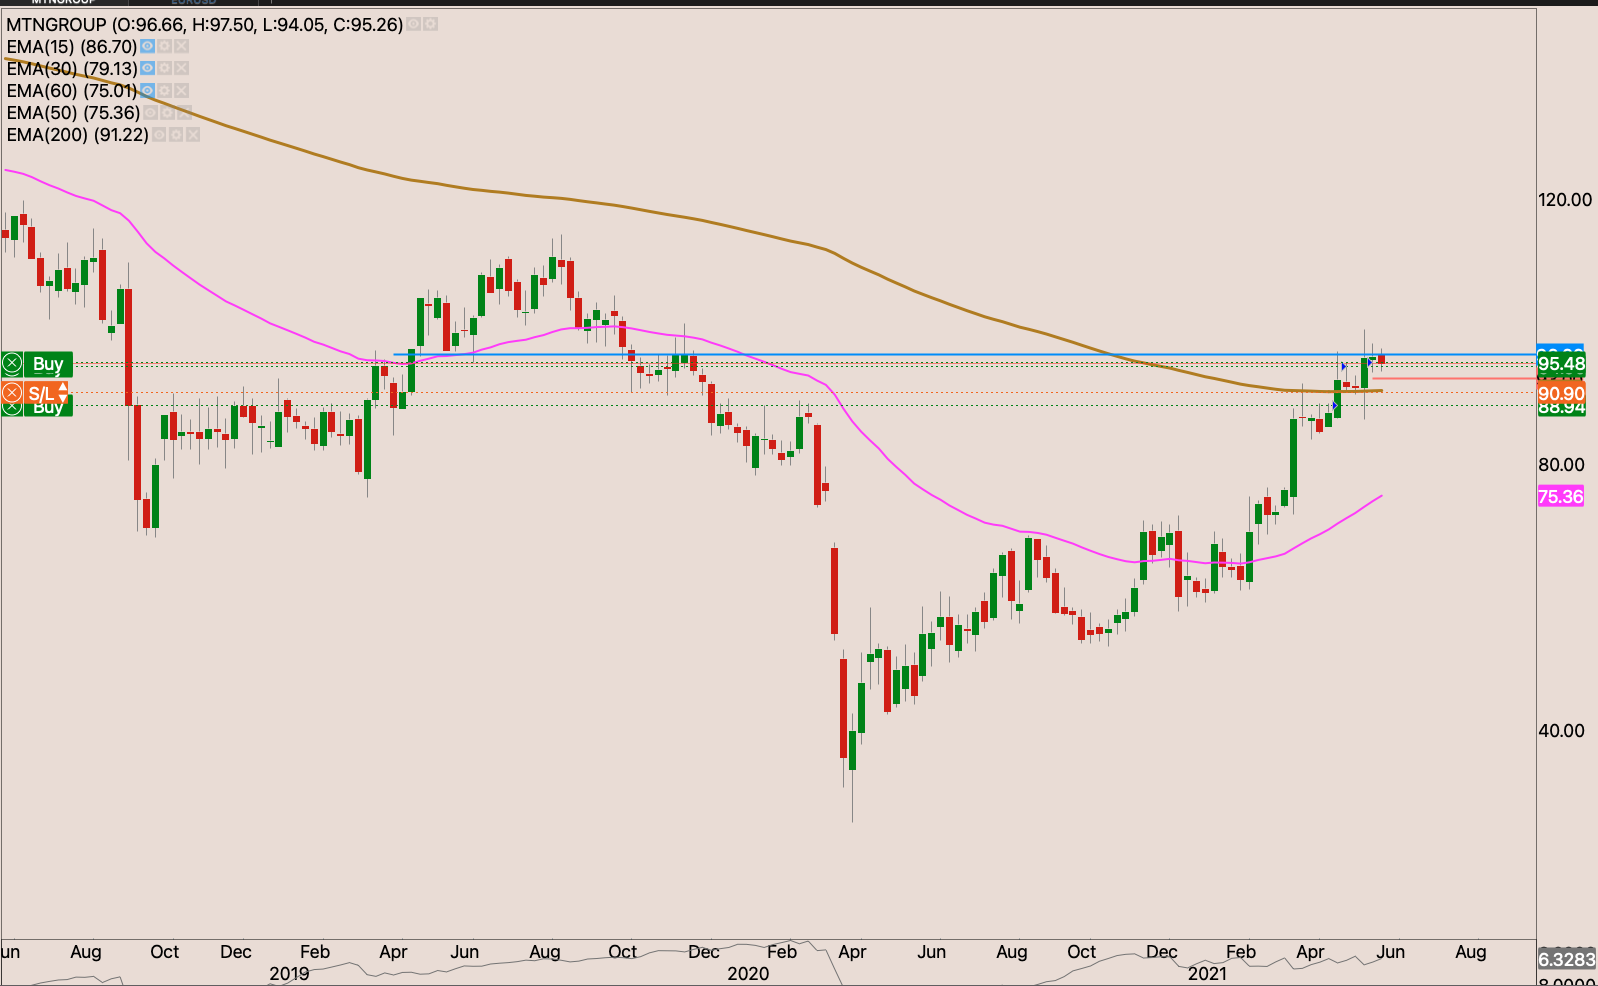
MTN
MTN perhaps provides a much better risk reward play on the Russian Vs Ukraine. As it is not a direct play on oil prices but merely an indirect play through its exposure to Nigeria (their biggest market). The stock broke the R192 short term resistance. Only to find some selling at the long term R200 resistance to re-test old resistance. It held on Friday. Not sure if it was saved by the bell or buyers came in to buy the retest.
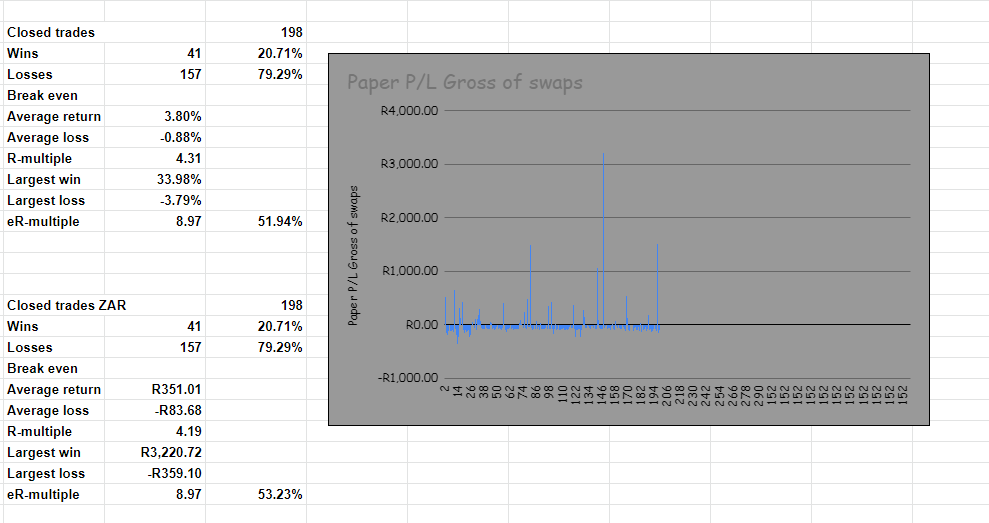
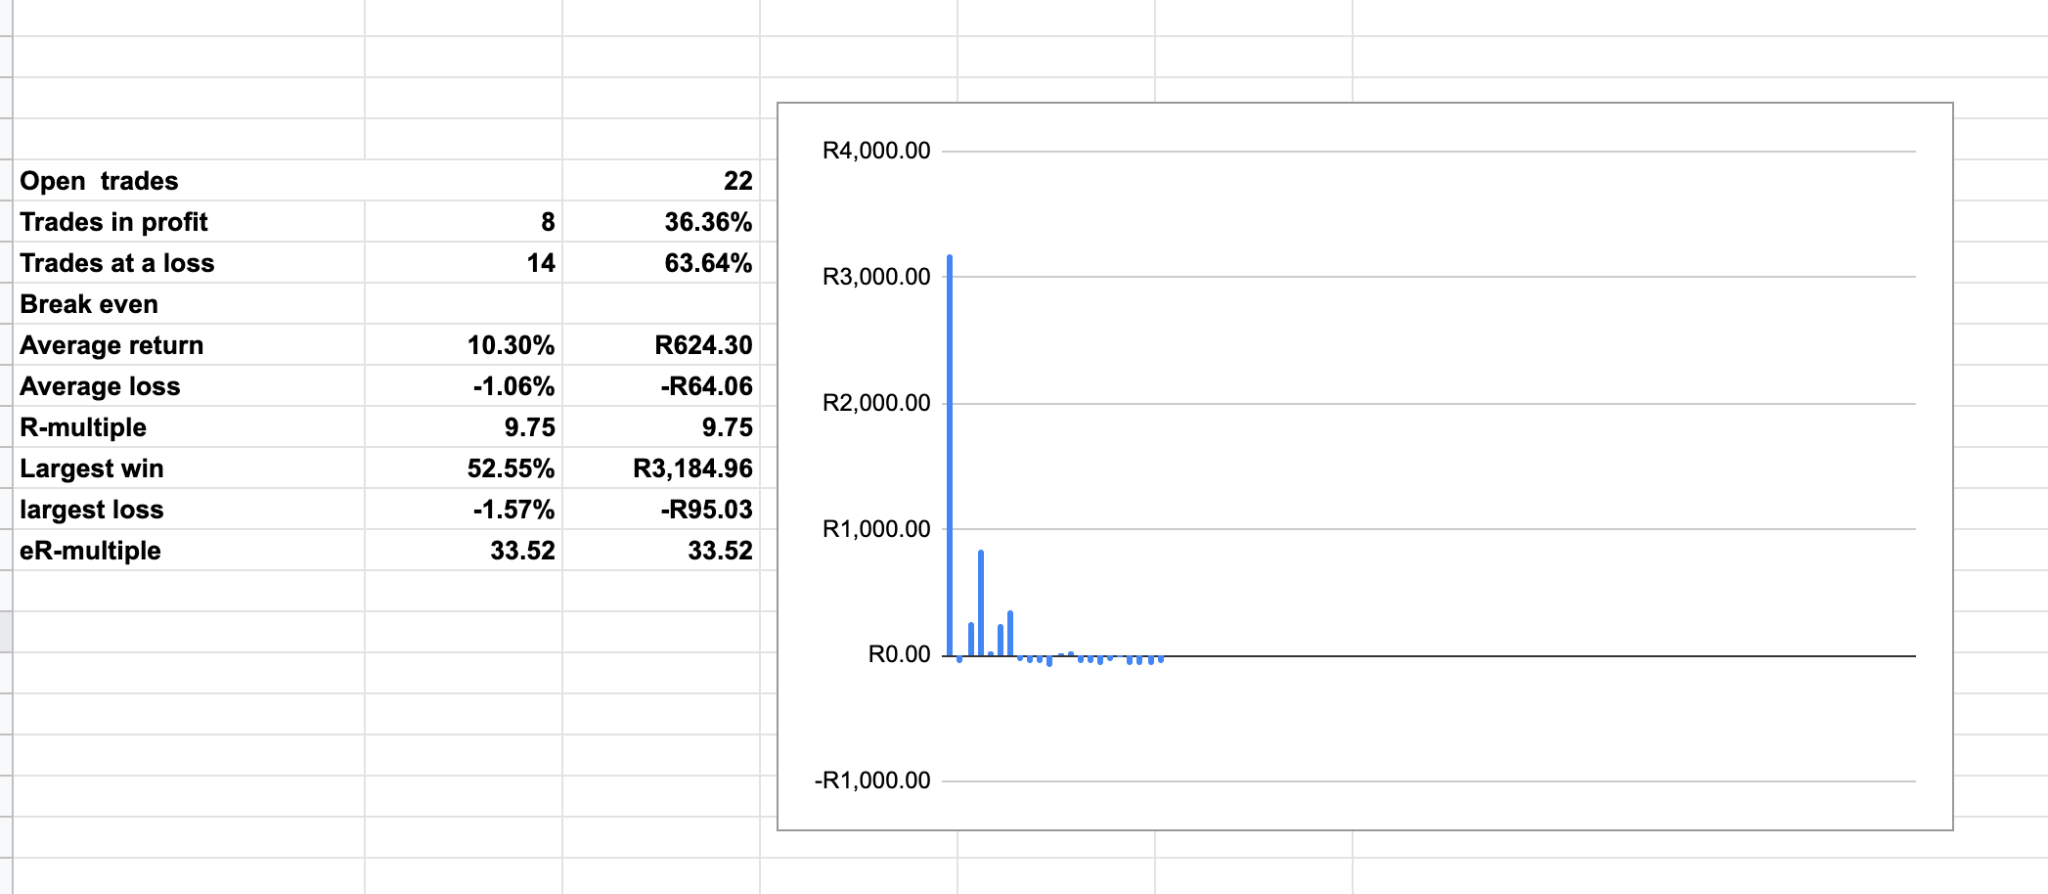
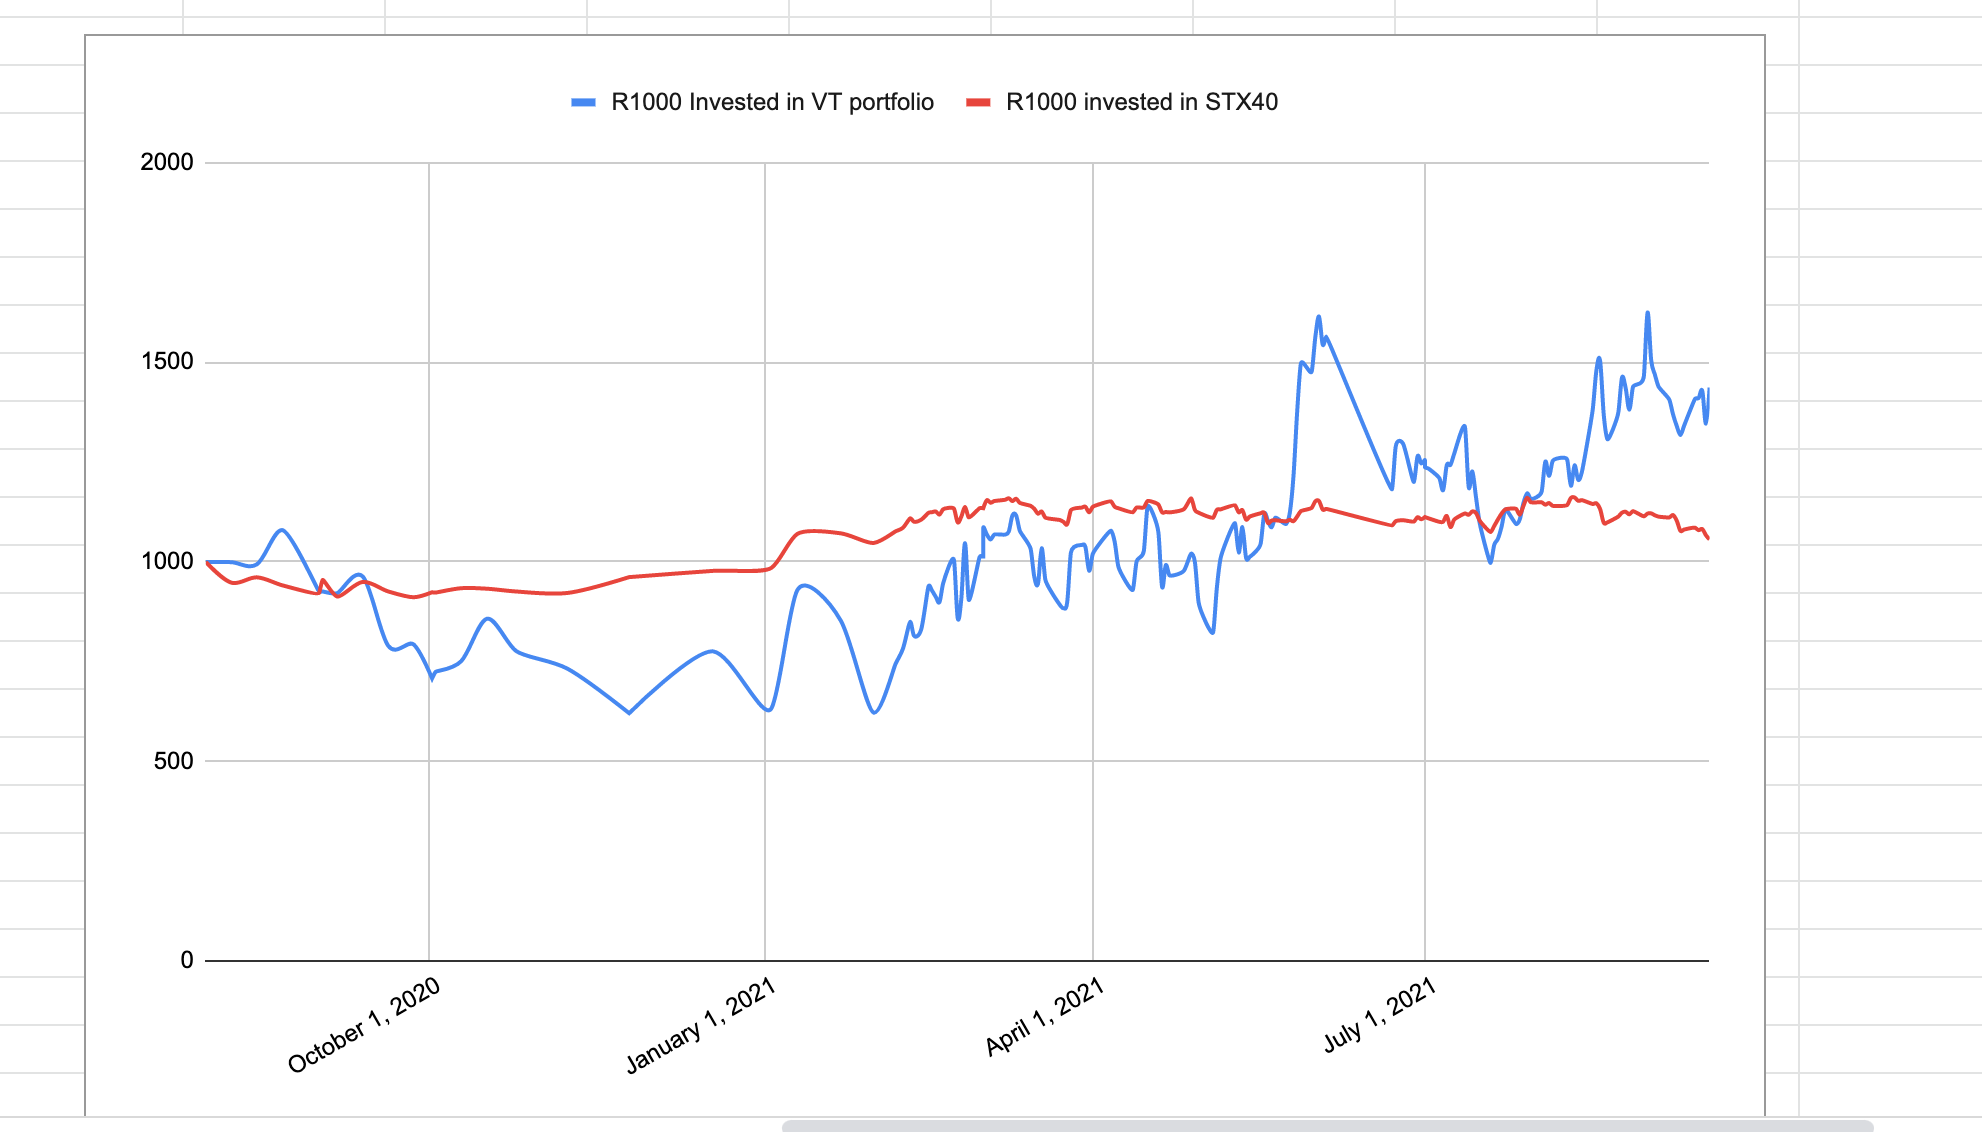
Portfolio Summary on 6 March 2022
Capital invested: R10 303.77
Current Balance: R9 477.36 -8.02%
Current Equity (Balance including paper P&L): R24 223.38 135.09%
Current P&L : R14 746.02
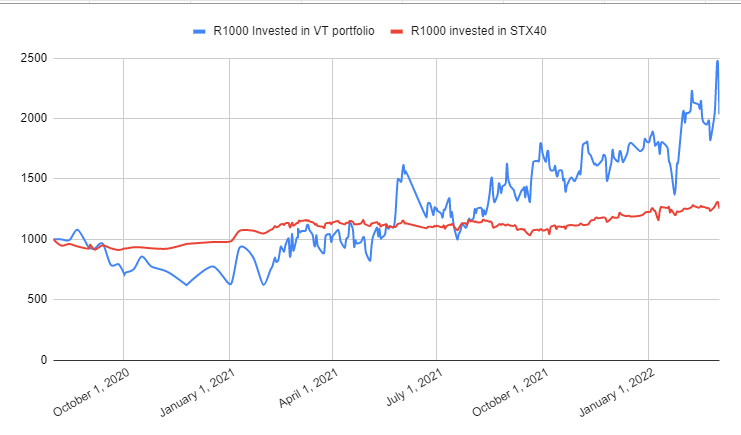
Village Trader Equity curve Vs Benchmark STX40
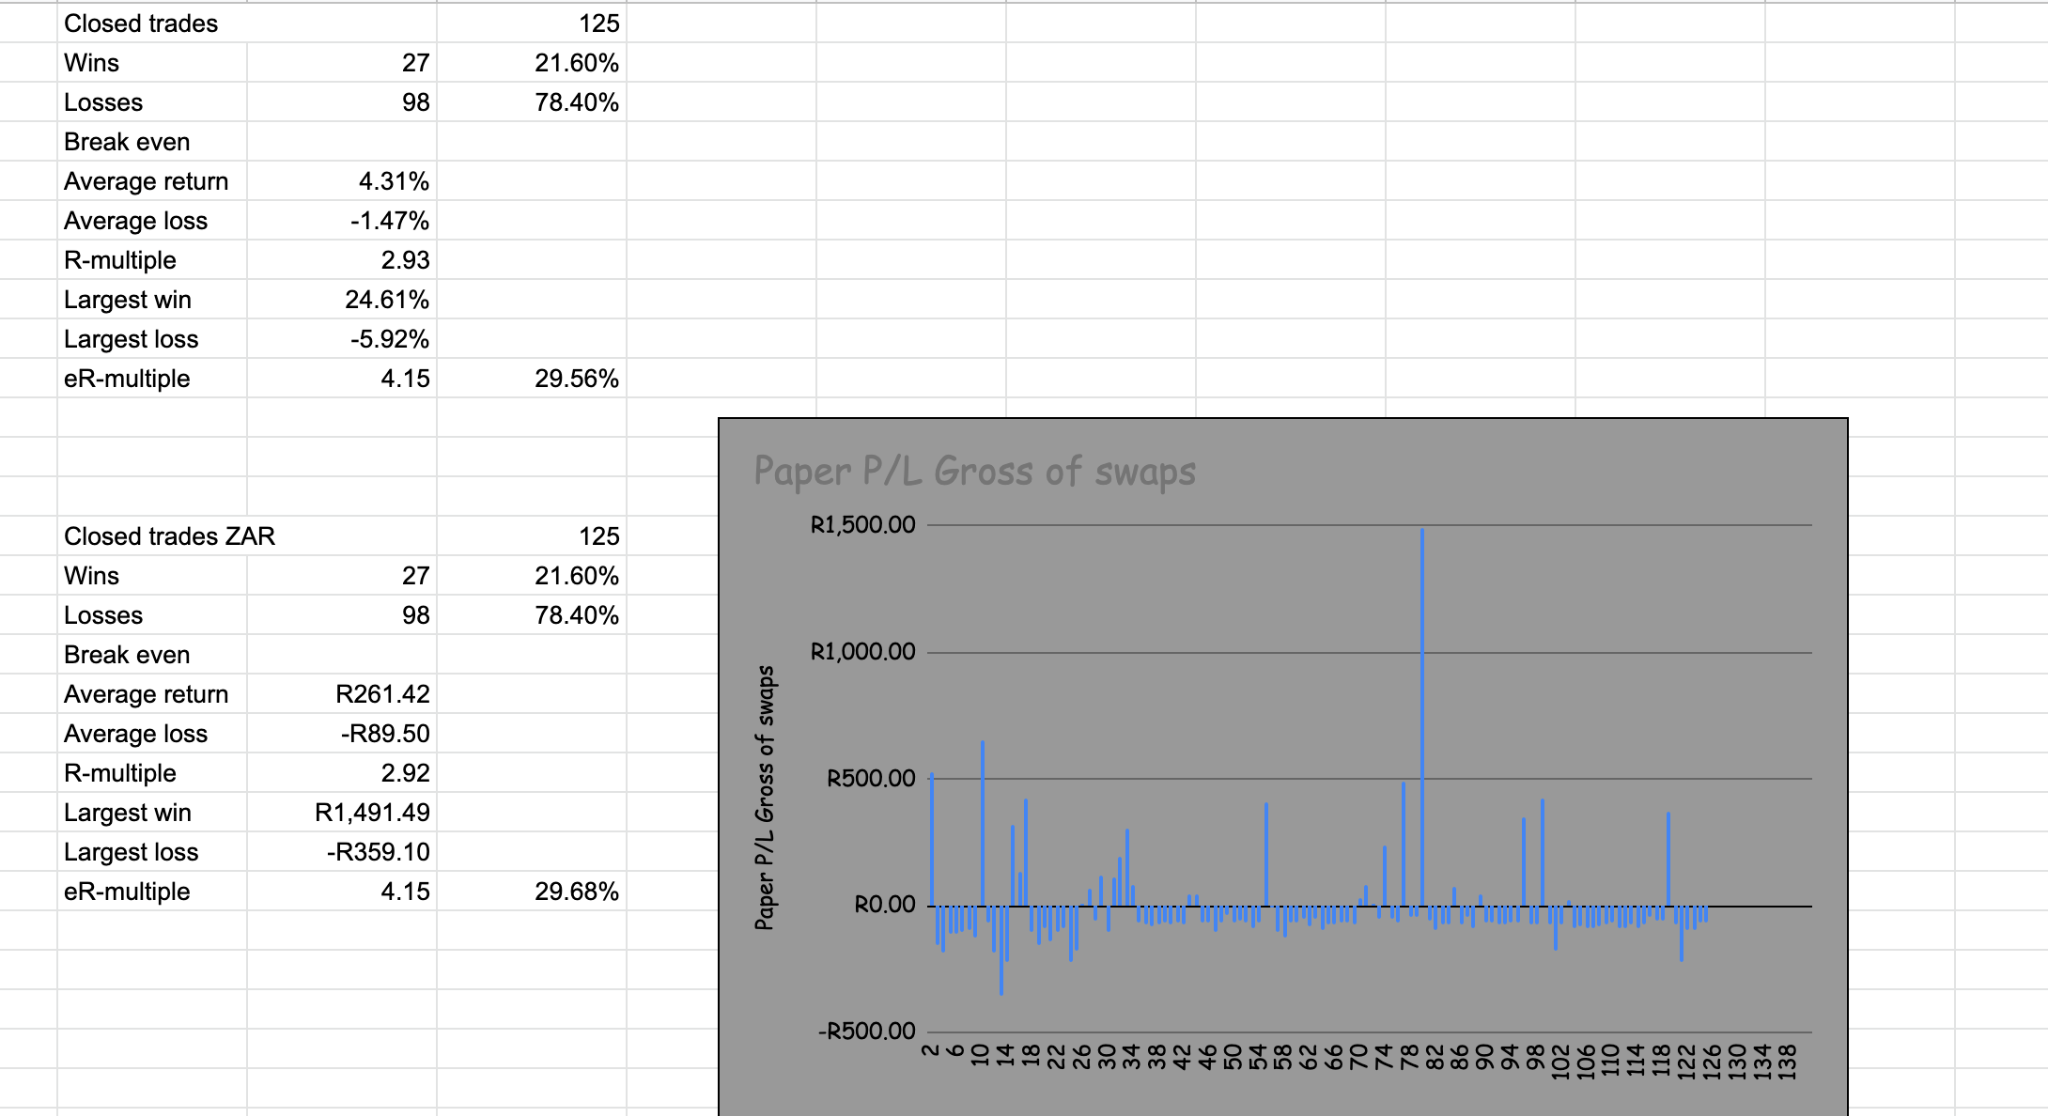
Closed trades statistics and distribution
Open positions statistics

Thank you for reaching far. For any questions feel free to email me at njabulo@villagetrader.co.za
]]>MTN
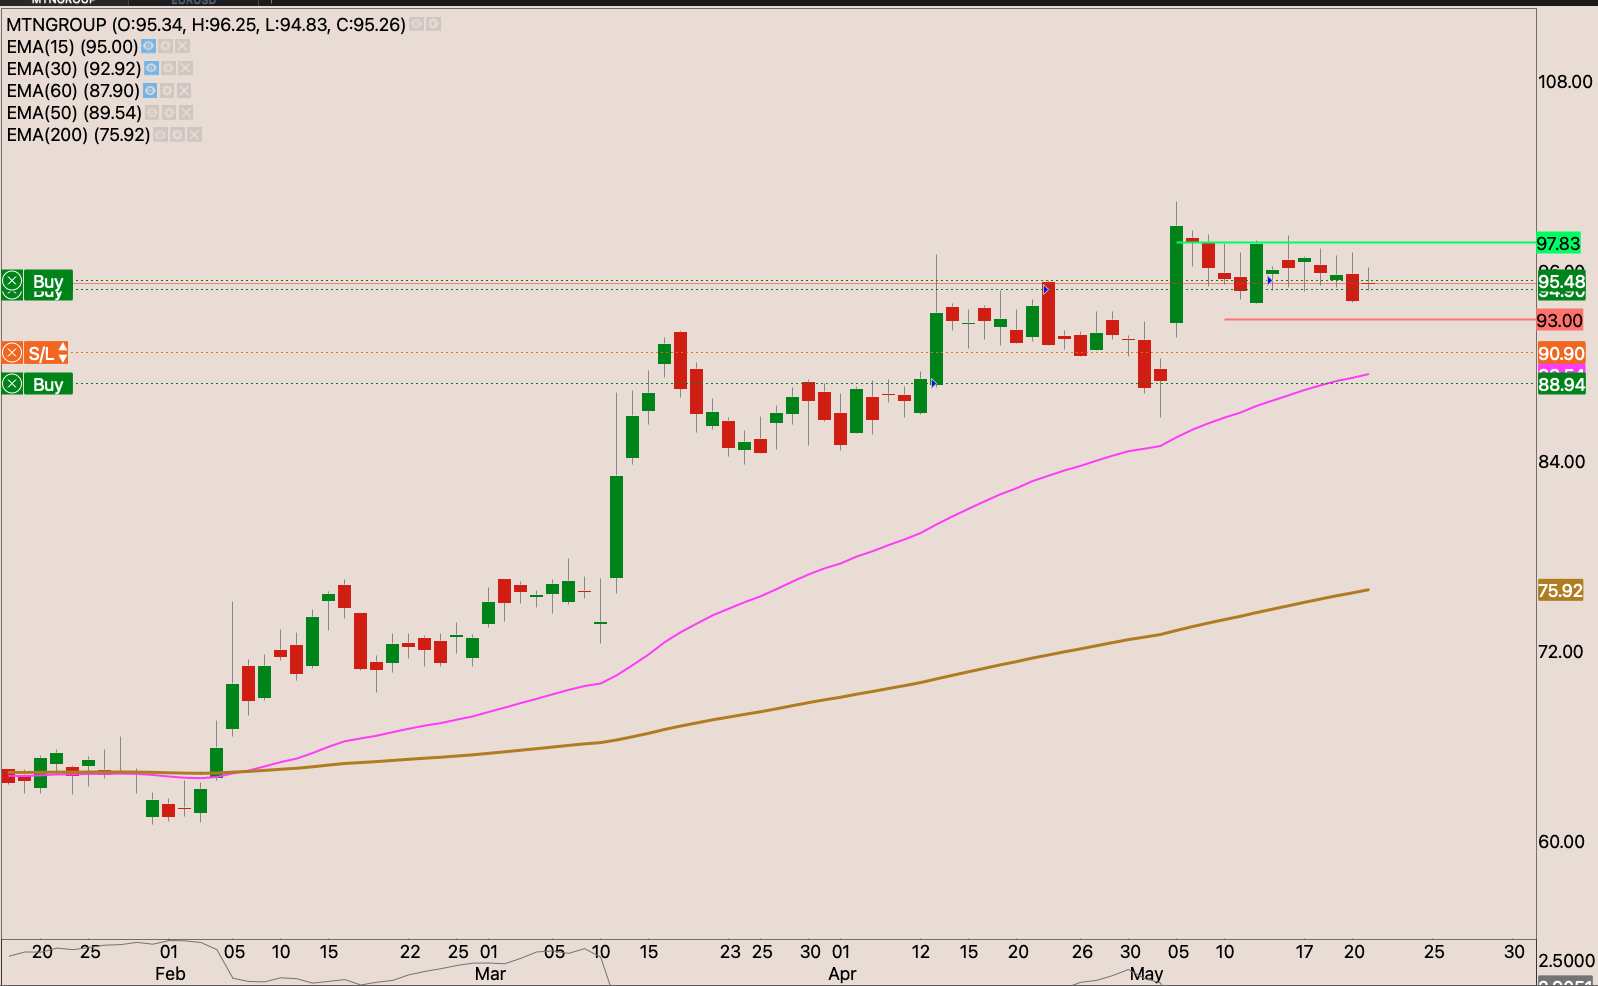
The MTN stock has had a strong run up post the COVID-19 crash in 2020. Smoothly making higher highs and higher lows. The MTN March 2020 lows can’t only be put on the heels of the COVID-19 crash. They had other issues they were battling with, particularly with the Nigerian government. That relationship seems to be behind them now, the listing of MTN nigeria seems to have certainly been helpful.
MTN in my portfolio
I have been holding MTN in my portfolio for just under a year now. Benefiting from the base breakout rally. The stock is currently 25% of my portfolio at the moment, contributing more than half of my profits. I picked up the stock at R88. Here was my view on MTN then.
Looking at the long term technical picture
Markets and memory
Markets have memory, they turn to remember prices they rejected before. Old resistance levels turn to hold up especially in the longer time frames. MTN in its rally showed no respect for market memory, at least not in any significant manner. R178 had been that the market respected fairly regularly before the stock went for a nose dive.
Market remembered this level and held the stock off for 2 months. It took MTN Nigeria results to break this level. Market has tested R178 from the other since the breakout. Held it nice with a combination of a doji reversal candle and a bullish engulfing candle as it was approaching the 50 day EMA.
I’m currently waiting for the stock to take the current relative 52 week high.. The company has results coming in 3 weeks, perhaps there lies in a catalyst that will propel the stock higher. If we get a new high close on the daily chart above R192. I will increase my holding in the position.

Wind at the back
Tensions between Russia and Ukraine have escalated to military war. Commodity prices rallied as the tension heightened. Brent crude made all high hitting $102.09. MTN’s largest market is Nigeria which also happens to be a large supply of oil and gas. Largest in our continent & ranks 11th in the world on oil production. As NIgeria benefits from high commodity prices amid the war, so does MTN, through it’s Nigerian exposure.
Because MTN is an indirect play in the war story, as it’s neither a supplier nor consumer of oil. It’s a much better risk reward opportunity. As it stands to have much less volatility compared to the more direct plays like commodity stocks such as miners & petroleum stocks.
It’s currently in a nice strong up trend, came close to the 50 day EMA and repelled as Russia invaded Ukraine with military action. Now I have to wait for confirmation of this “dip” & close through R191.80, a relative new high close. With a stop loss at R173.40, raising it as it continues to run higher.
MTN has had quite a run in the past year, and may seem counterintuitive to buy a stock that ran hard. It’s usually a profitable strategy to buy at new highs, because as O’neil puts it quite correctly “ what seems high, usually goes higher”.
]]>Banks are looking quite strong, midcap and food retailers are also quite strong as well.
Let’s have a look at this week’s stocks in play
I got stopped last week on this trade as the stock violates the 50 day EMA. It did remember the R141 old support and it was a touching burning stove on Friday and that proved to be the low of the day. If the Friday low isn’t taken out with a new low this week, and the stock breaks back above the 50 day EMA. Signals the end of the -10% correction. I will however wait for a close above R148.10 to rebuild my position.
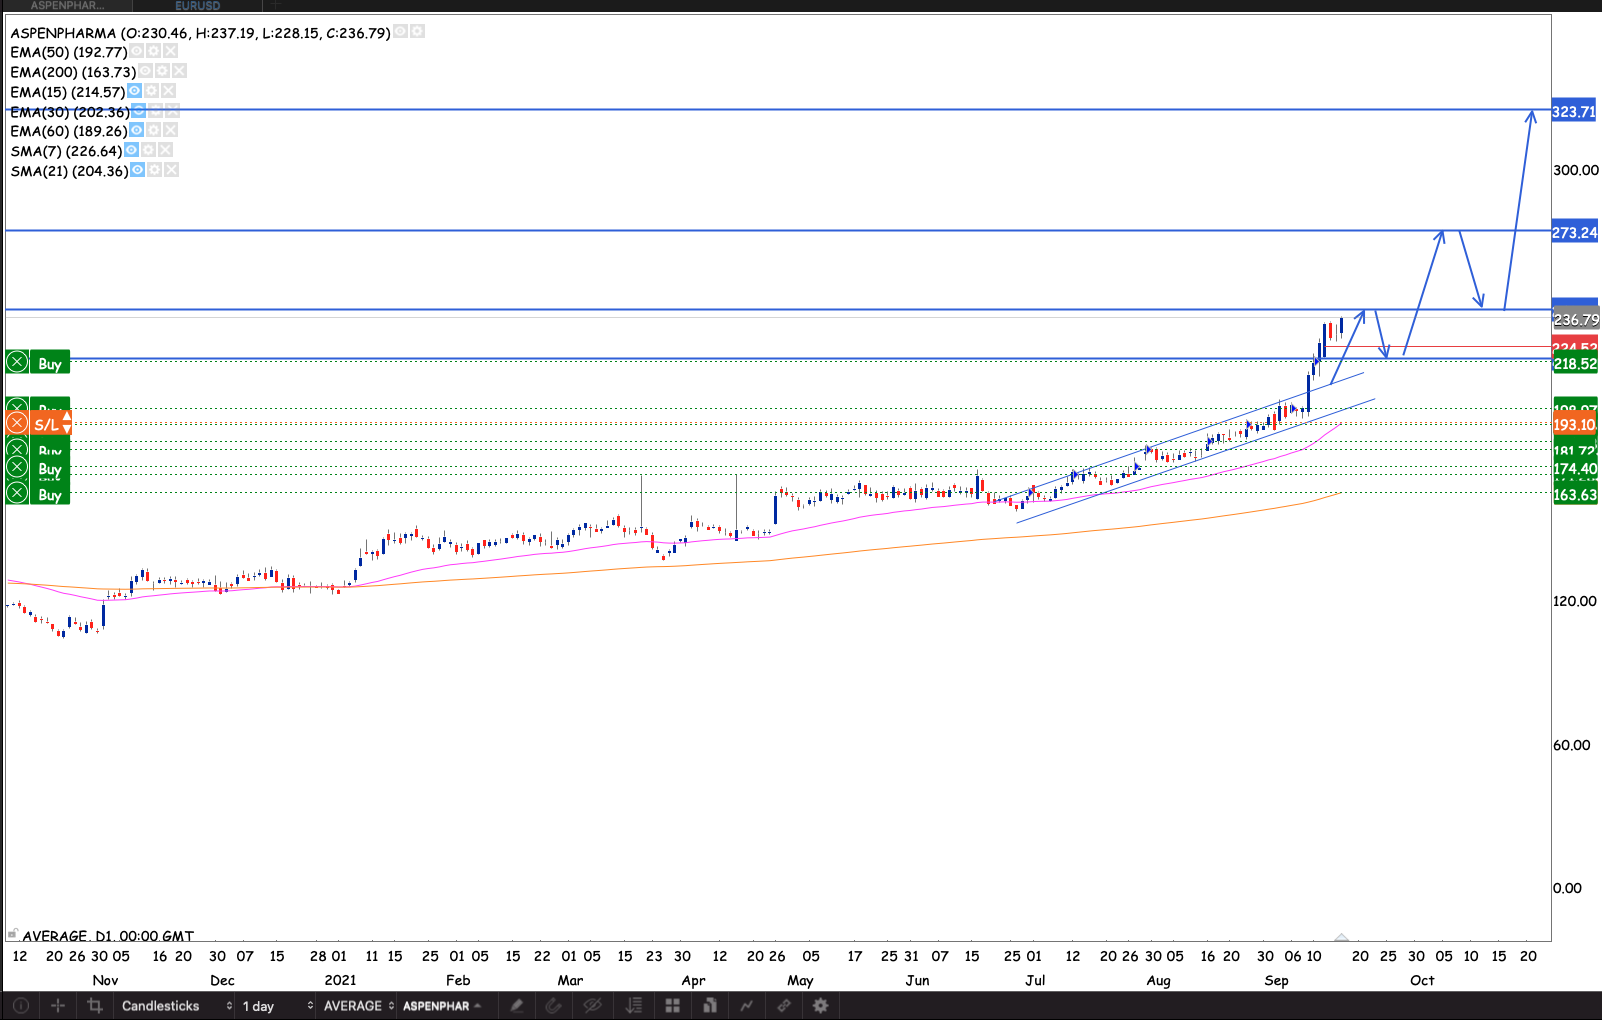
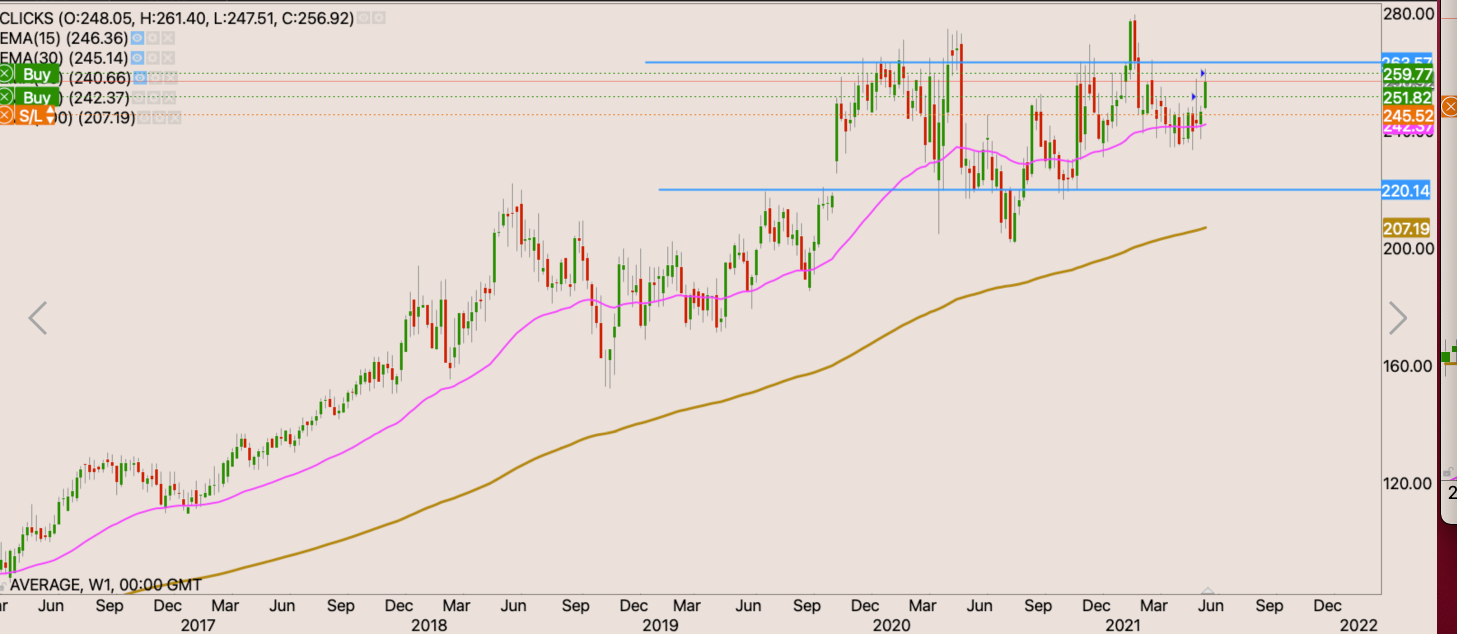
The stock has been rallying strongly recently. Picked up some pace after breaking above the up channel it has been since around June. The R240 level has been a very strong area of memory held quite strong historically as support. Defending the price for many years. If the momentum takes the stock right through the R240 level I will add to my position raising my stop to around R224.50. Once the stock closes through R240 the odds of going back to the R440 highs are improved significantly.
R273, R323, R384 & R440 are strong areas of memory historically. We will see some reaction around these prices as the trend continues.
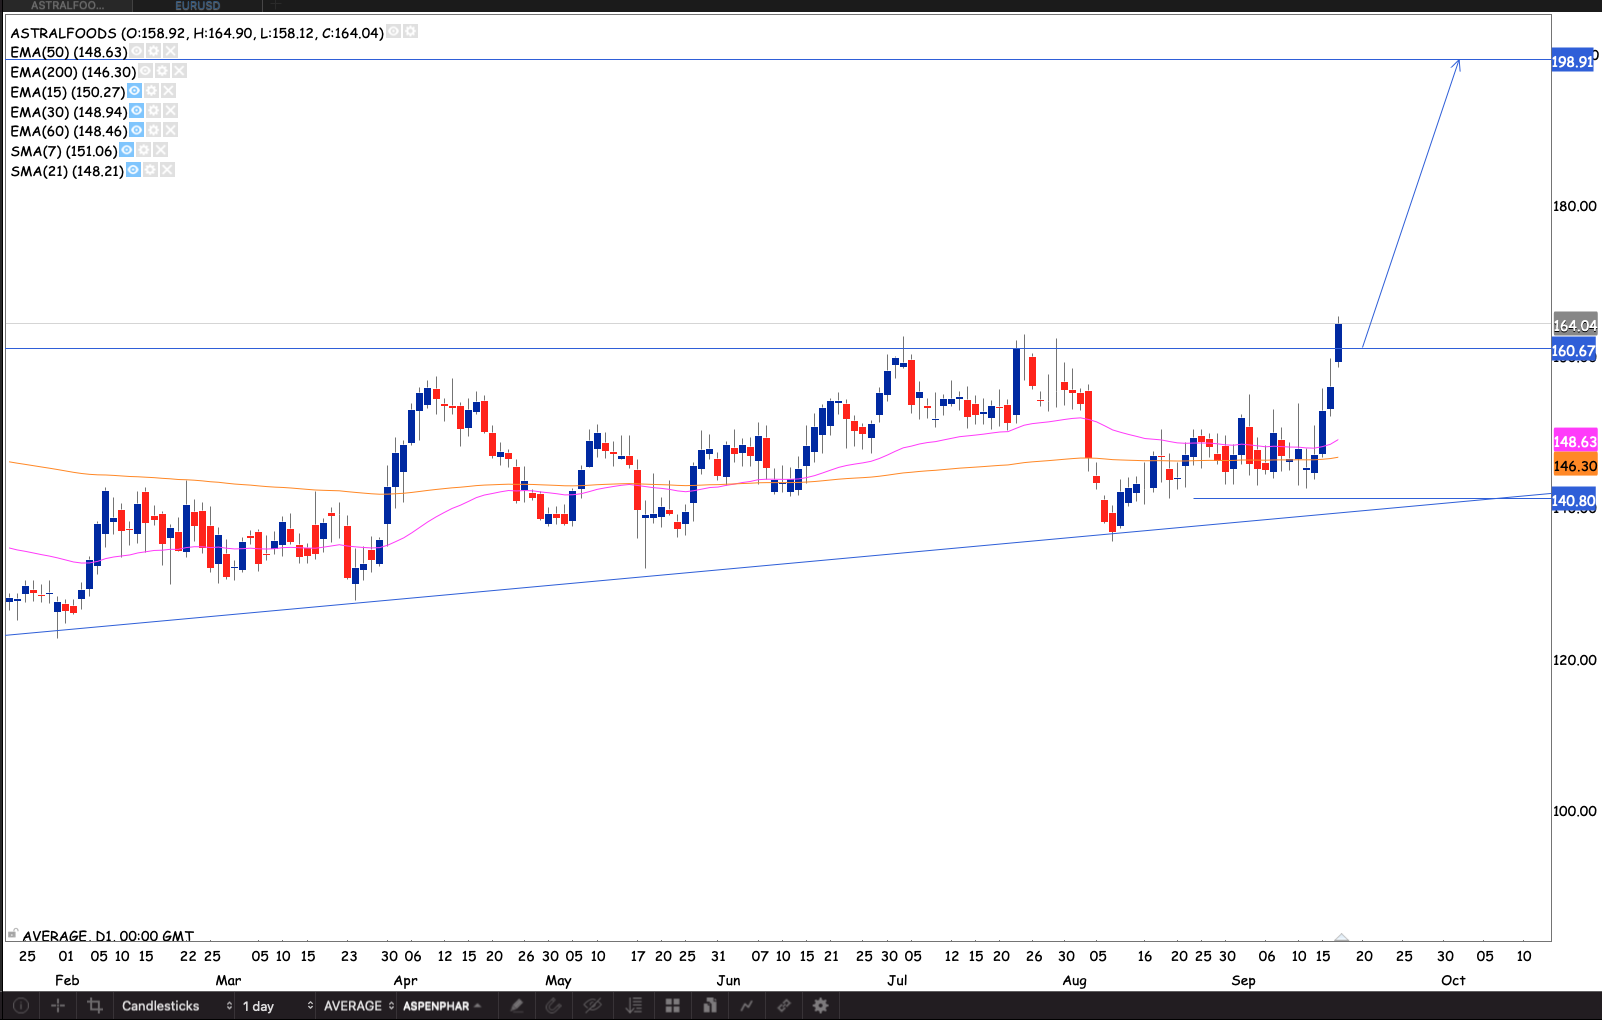
We recently had a golden cross showing that indeed buyers are a bit stronger than sellers albeit not by very much. The R160 level had been like a graveyard in the sky. Until Friday at the back of a trading update. The stock closed R164.04 on Friday. I will buy the stock with my initial stop loss just below the 200 day EMA at R140.80
AVI
We had a golden cross as the stock was not moving very much. It made a big move on Friday at the back of a cautionary statement. about negotiations currently on going but said nothing further from that. My opinion is that there’s a possible buyer and a possible delisting in the horizon but will see in time.
I will start building my position nonetheless with an initial stop loss at R80. to give a bit of room for the market to digest and make sense of that trading update.

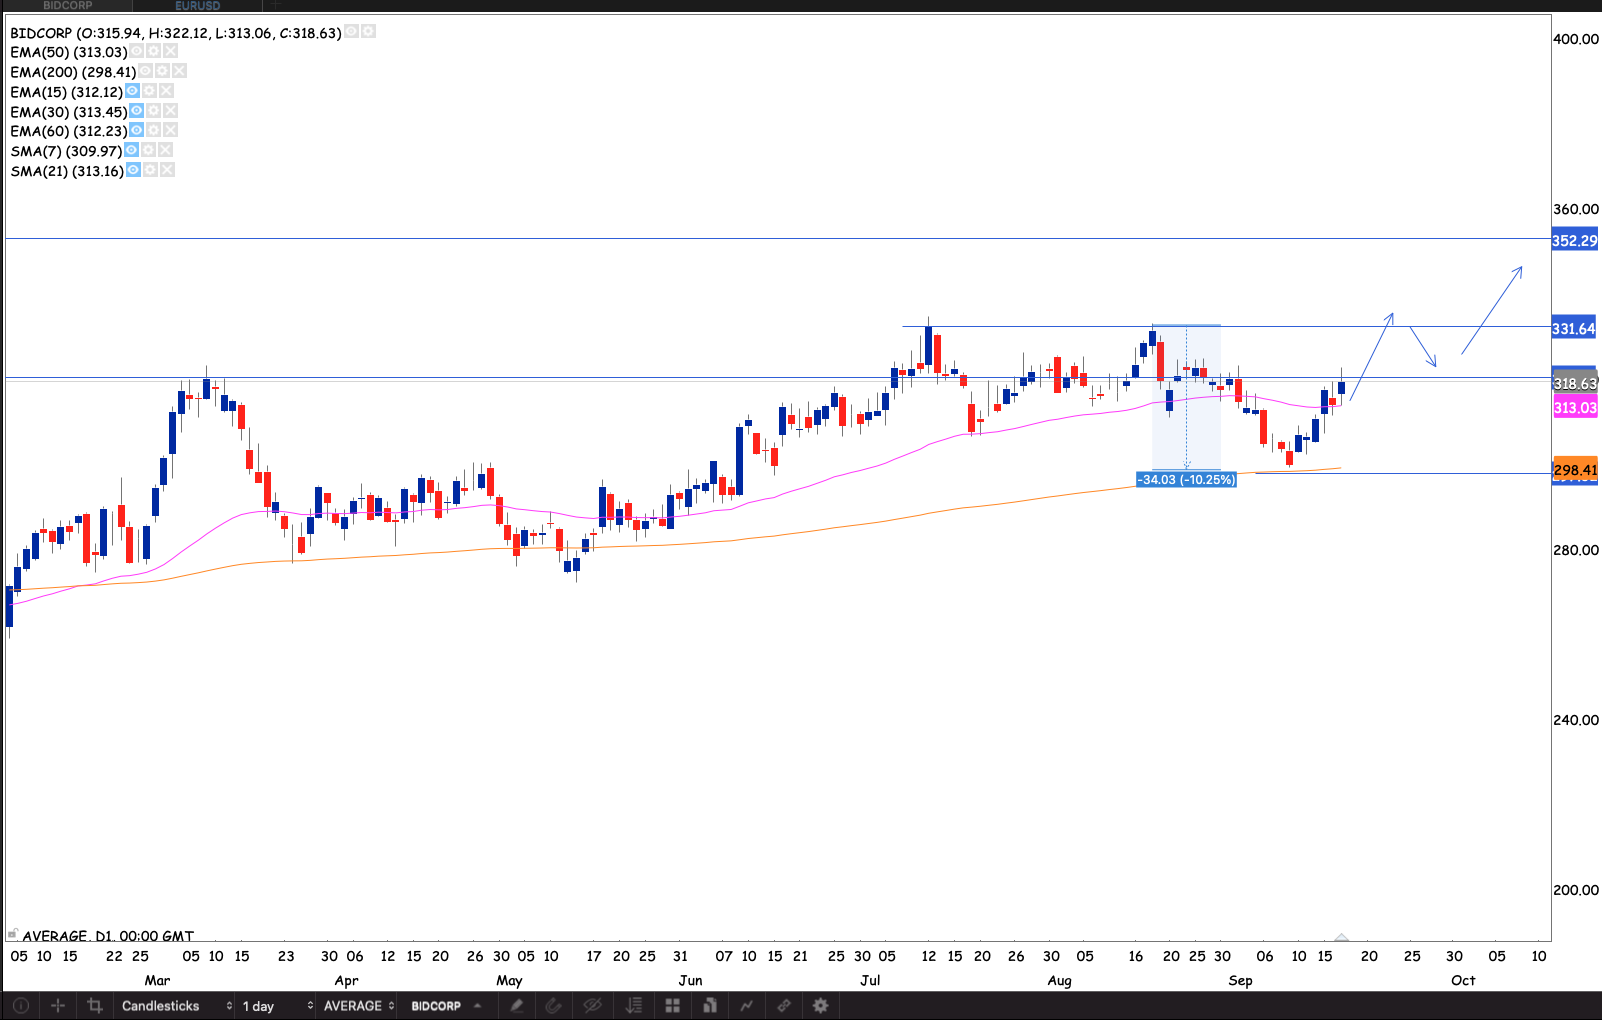
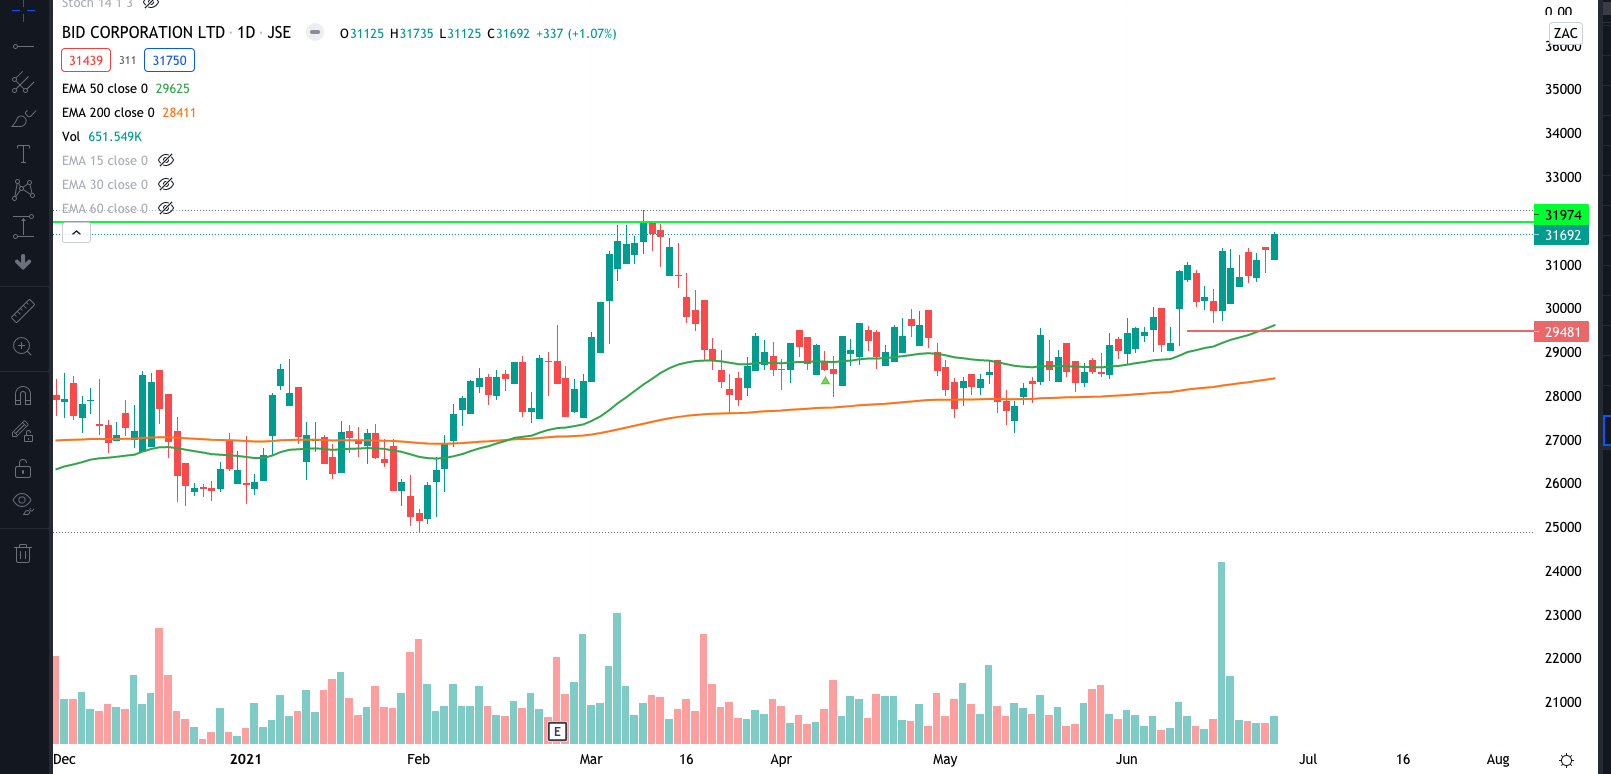
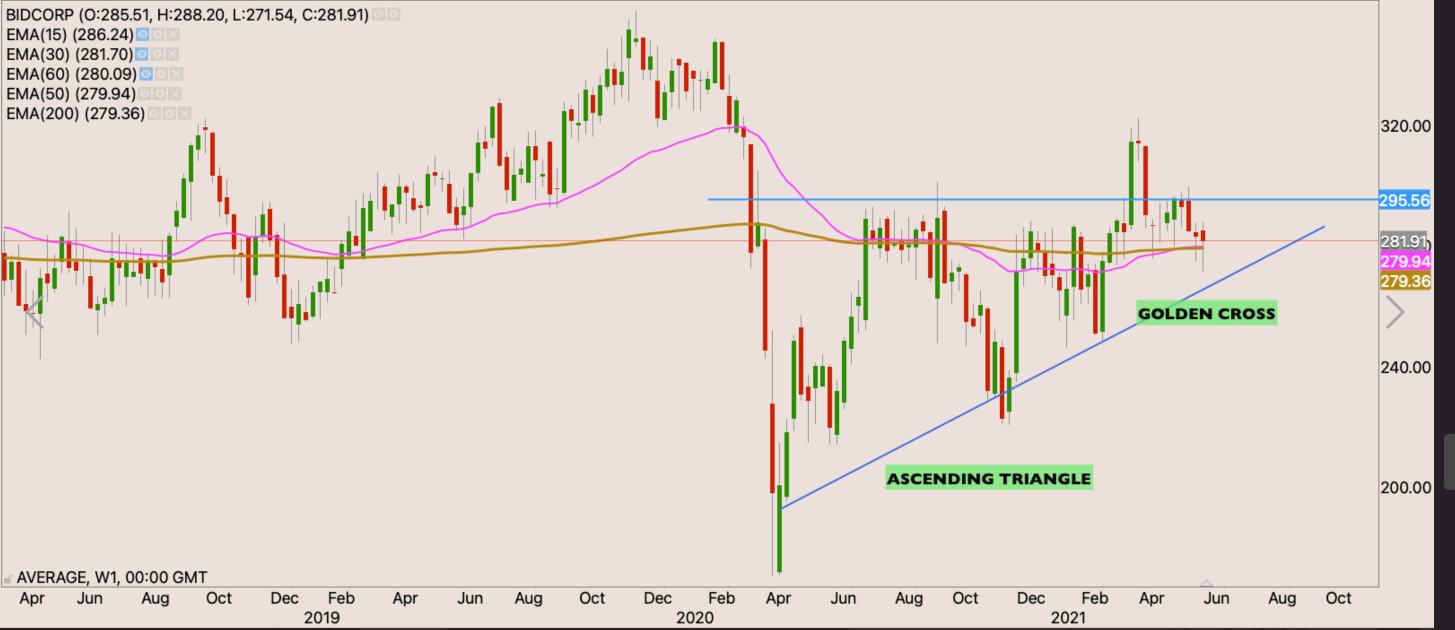
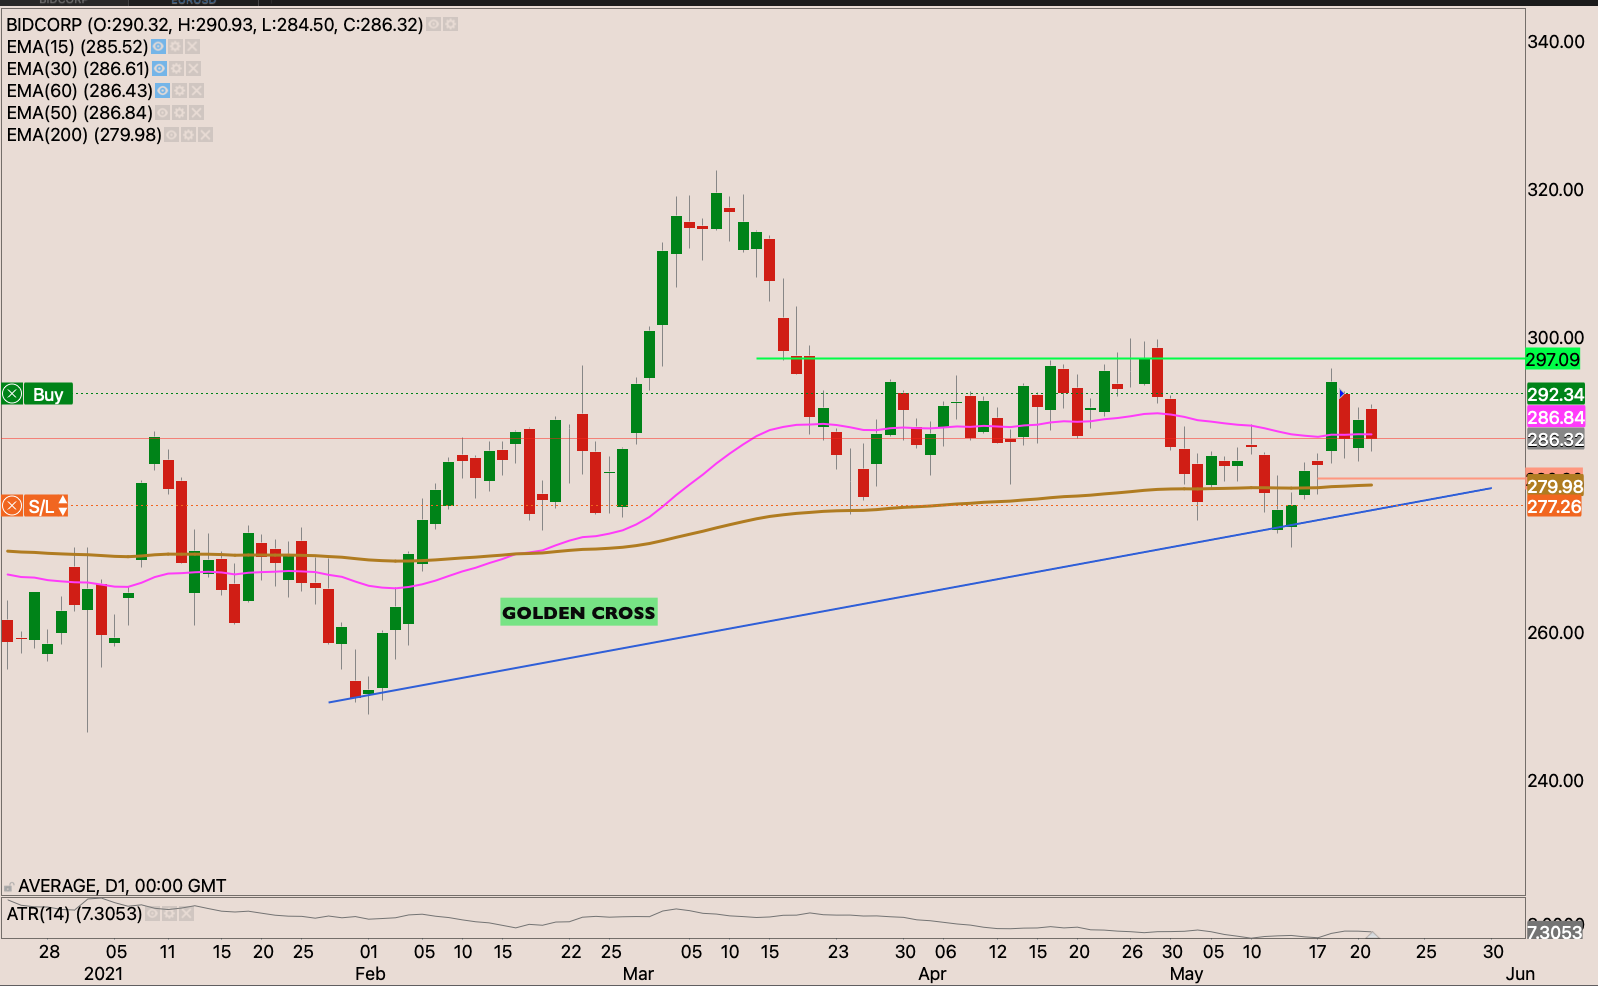
Bidcorp
I got stopped earlier this month on this trade as the stock violated the 50 day EMA. The stock found some support at the 200 day EMA after a -10% correction. The stock is now back above the 50 day EMA. I will however wait for a close above R319.50 the high close from March this year. To rebuild my position with an initial stop loss at R298.40 just below the 200 day EMA
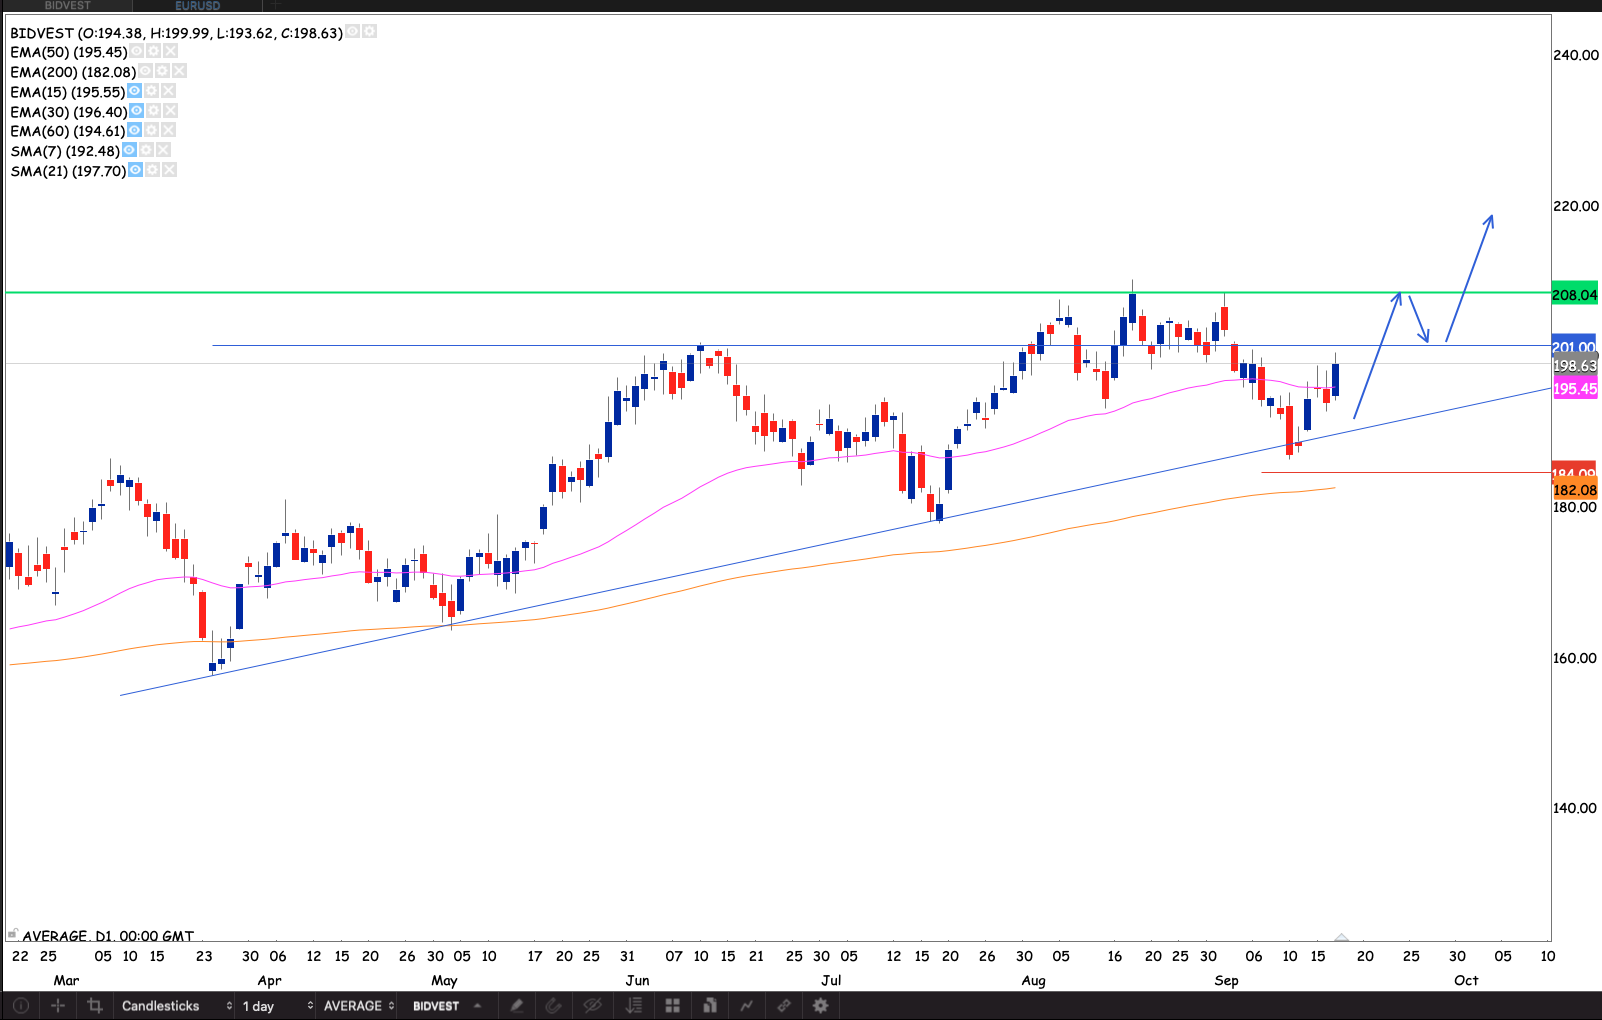
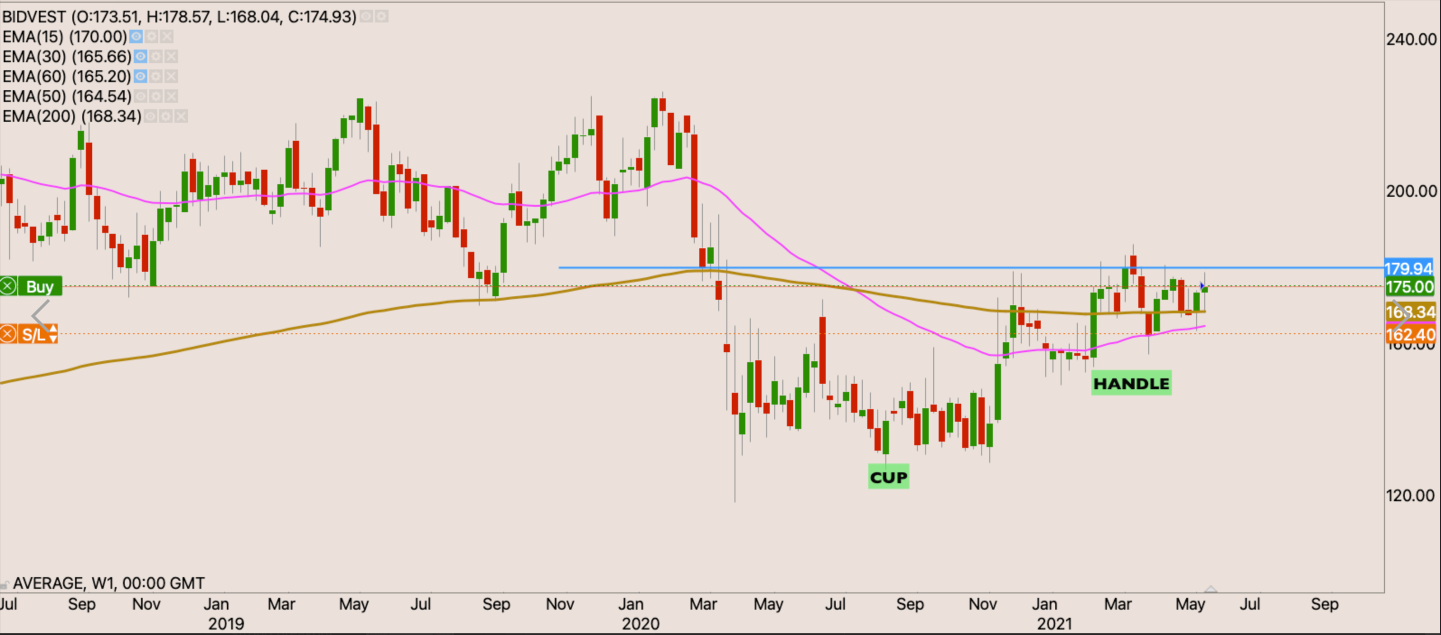
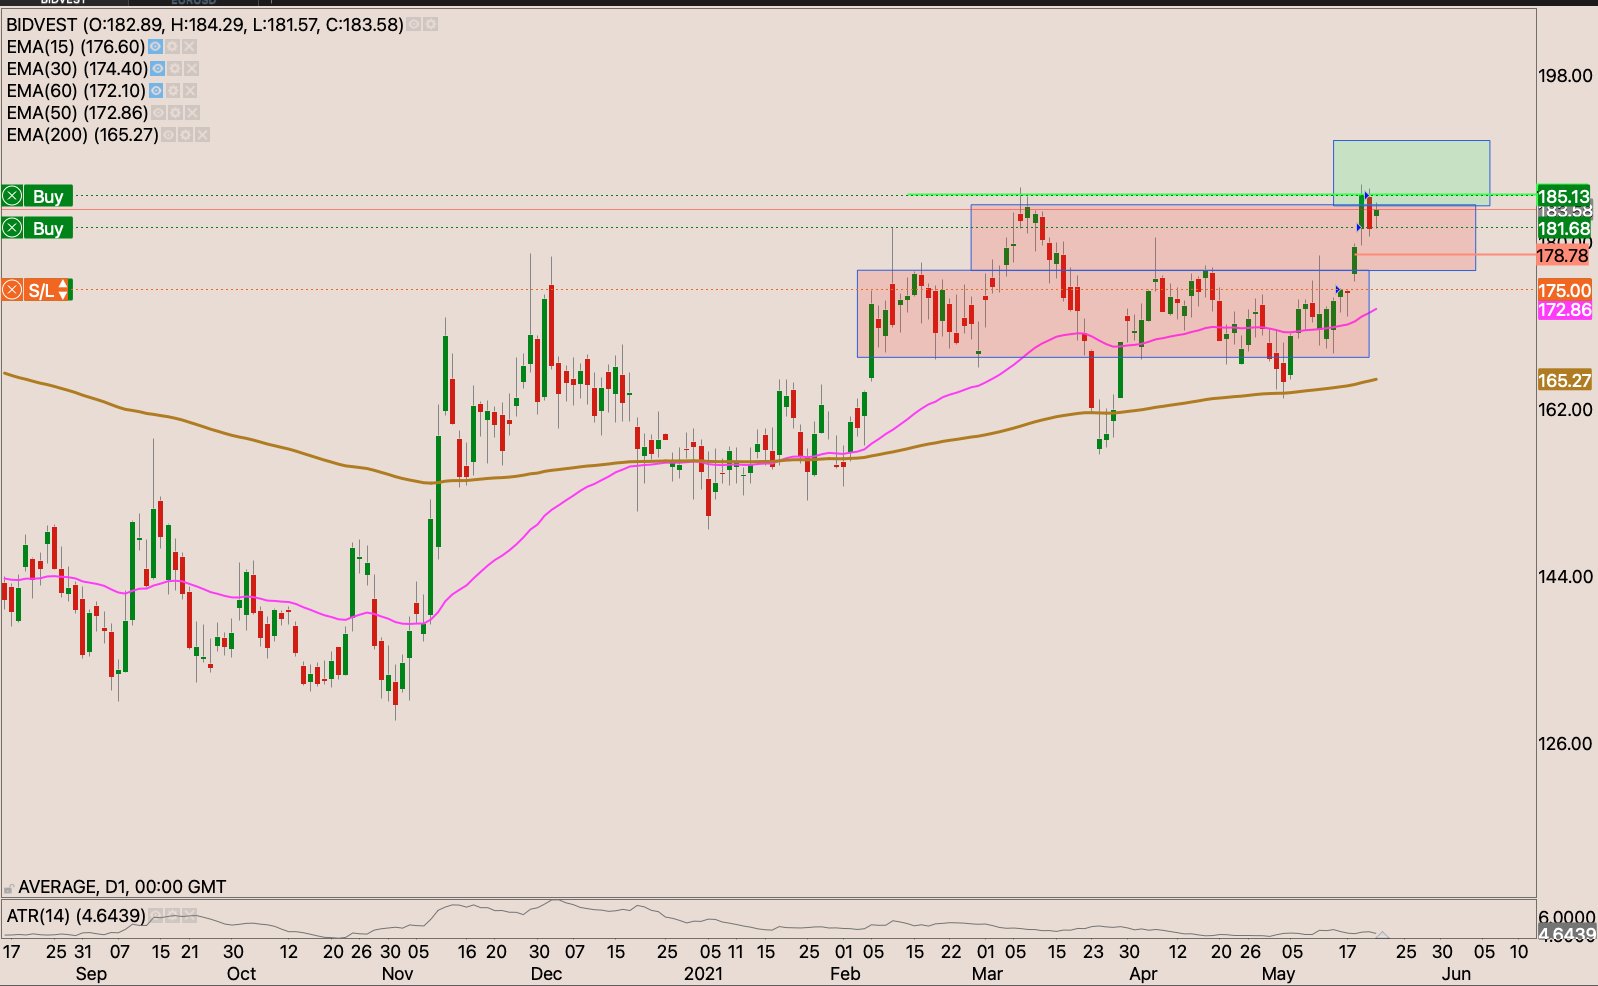
Bidvest
We have a nice ascending triangle pattern on the stock, the stock now back above the 50 day EMA. I will start building my position from above R20, however the level that will be of great significance will be the R208 level. We’ll see the stock really start to run if it can close through the R208 level.
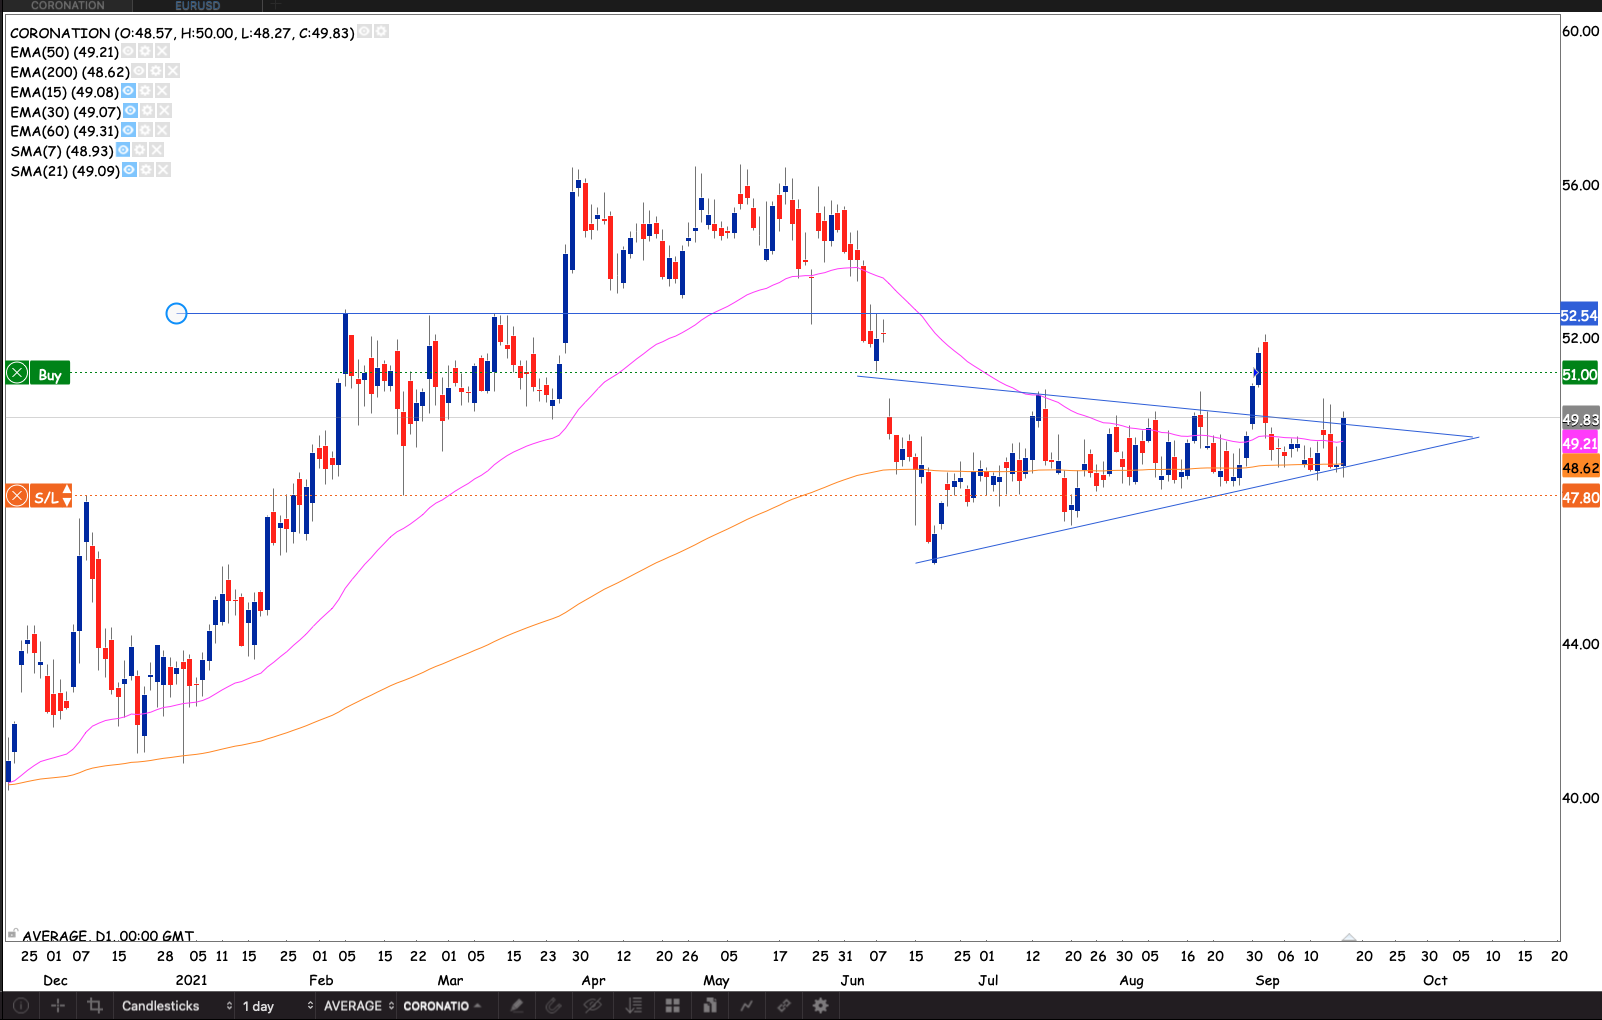
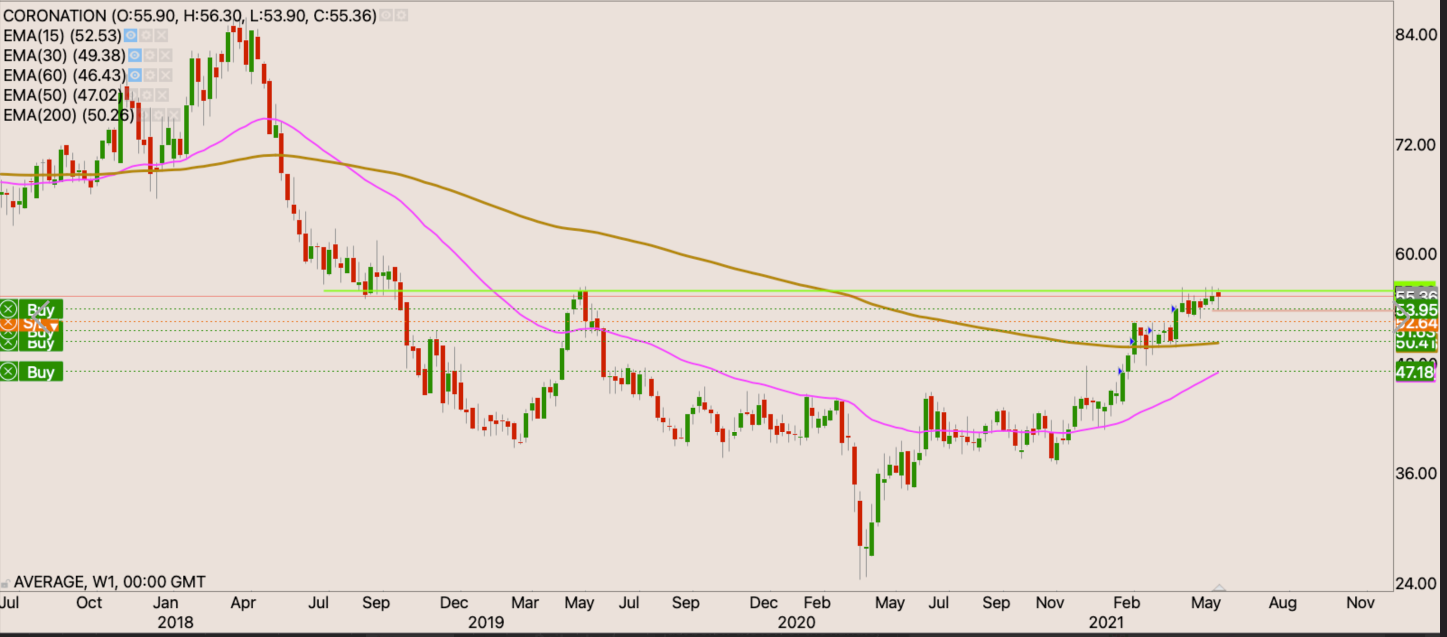
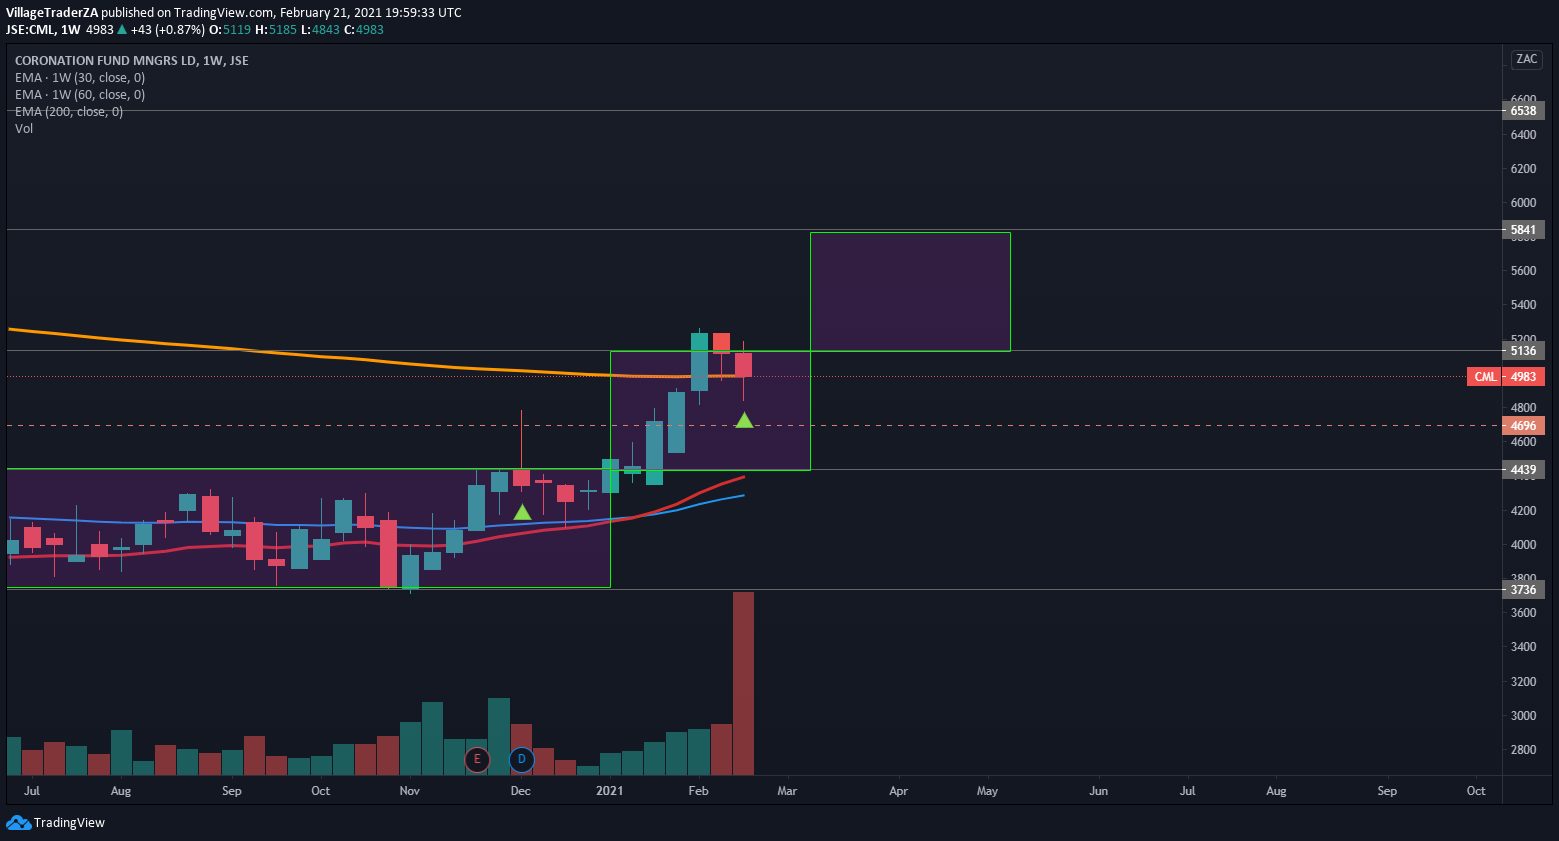
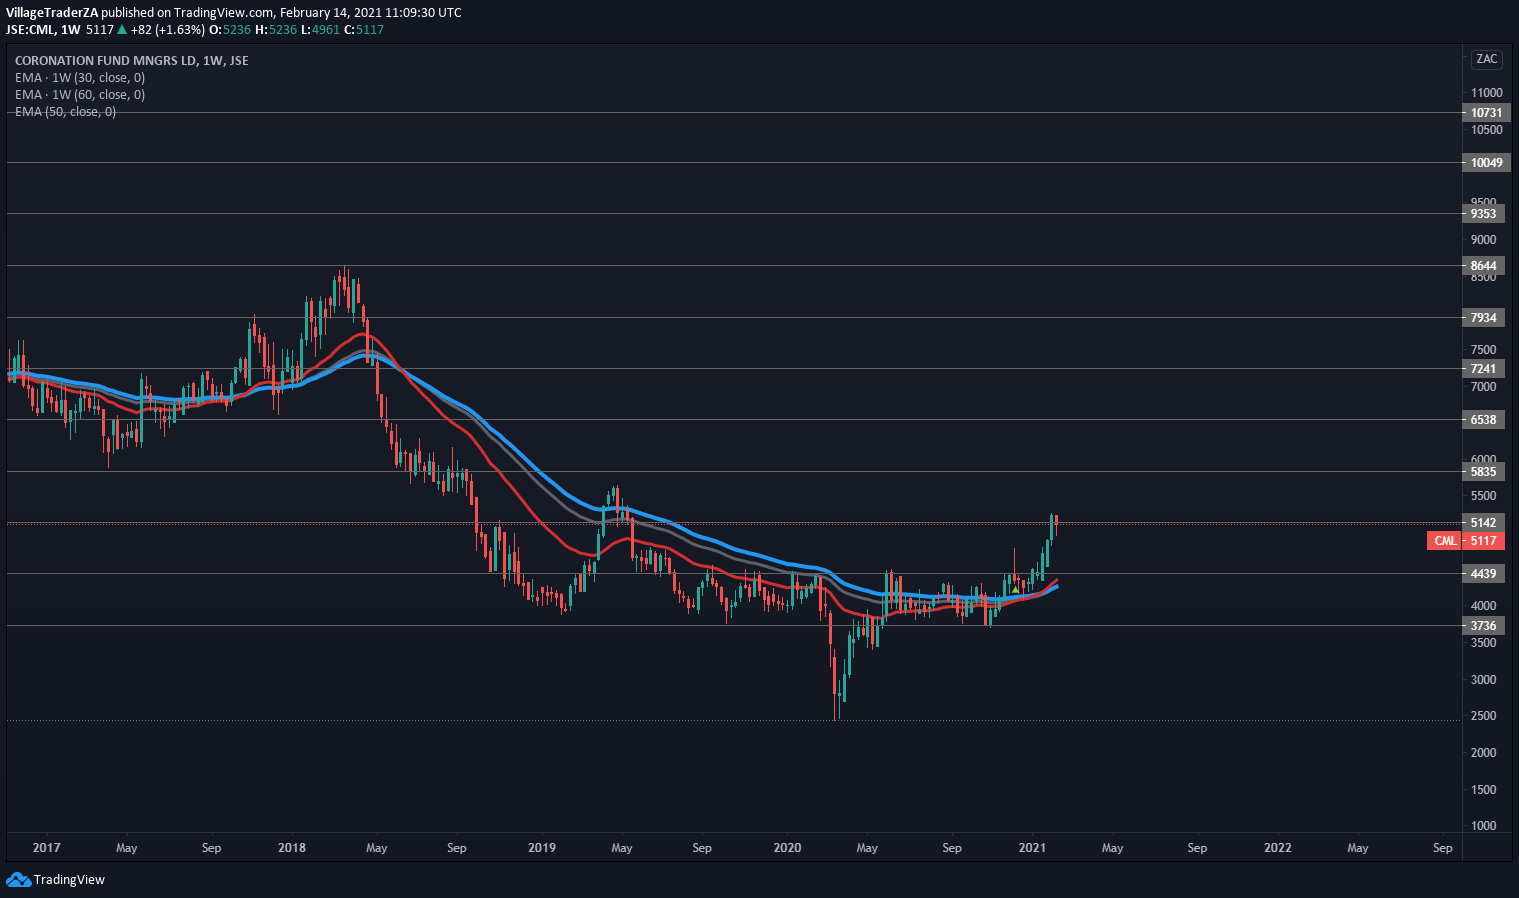
Coronation
The symmetrical triangle pattern that fails 2/3rds in turns to fail as a continuation breakout. It usually signals a reversal. That happens to be bullish for the Coronation as the stock holds the 200 day EMA as support.
The stock broke from the triangle on the up side on Friday. I’m Still waiting for a close above R52.55 to add to my position.
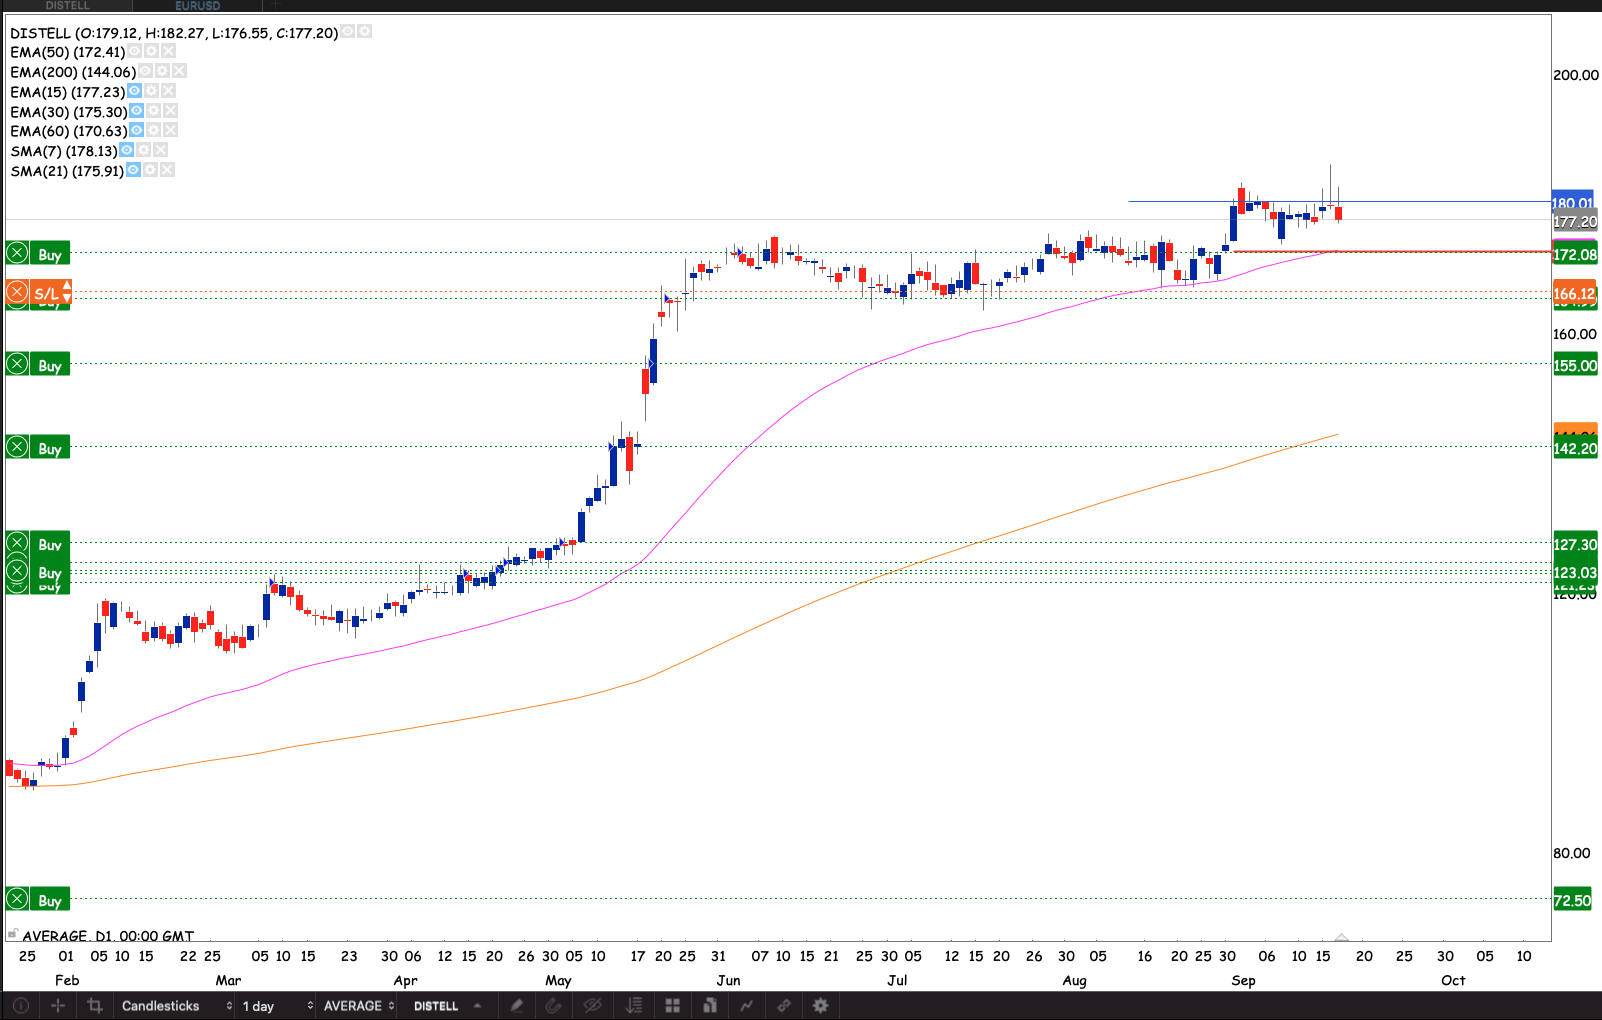
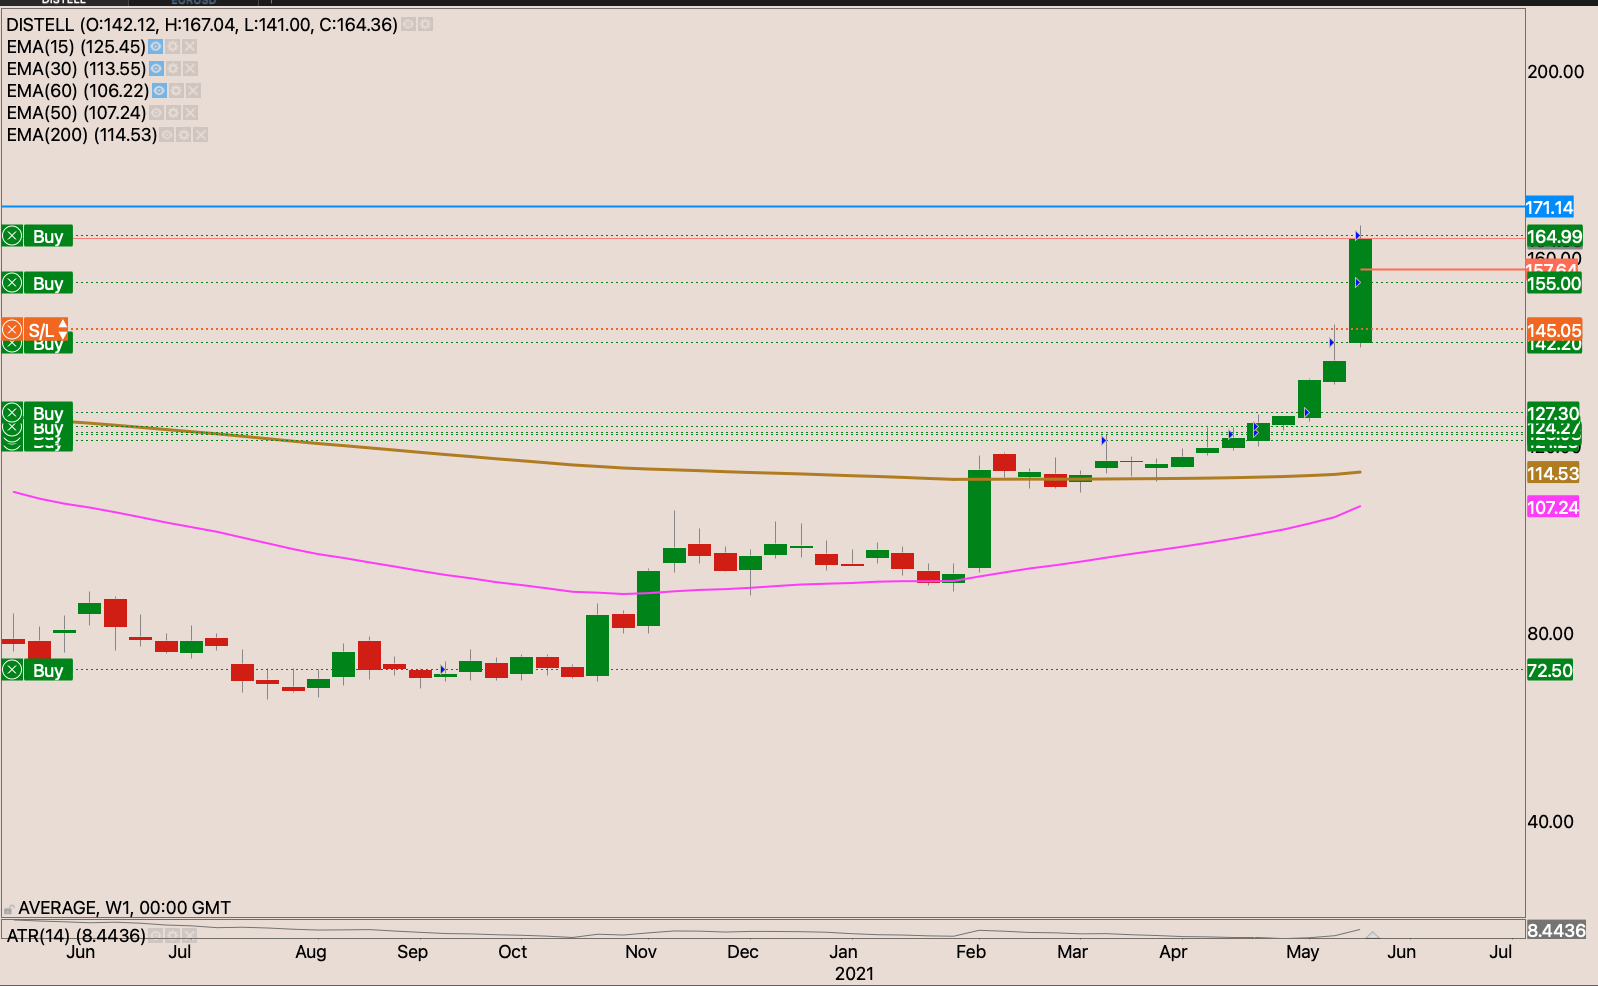
Distell
The stock ran into some selling and started consolidating but still making a higher low. The stock test made 52 week highs but failed to follow through. Thursday the stock really looked it was starting to run at point during the day but continued to close below R180 and forming a kangaroo tail which then confirmed on Friday with a close below the doji. However the consolidation range is so narrow it doesn’t worry me. If the stock can invalidate the doji candle with a new high close back above R180.05 I will raise my stop loss to R172.10 and add to my position
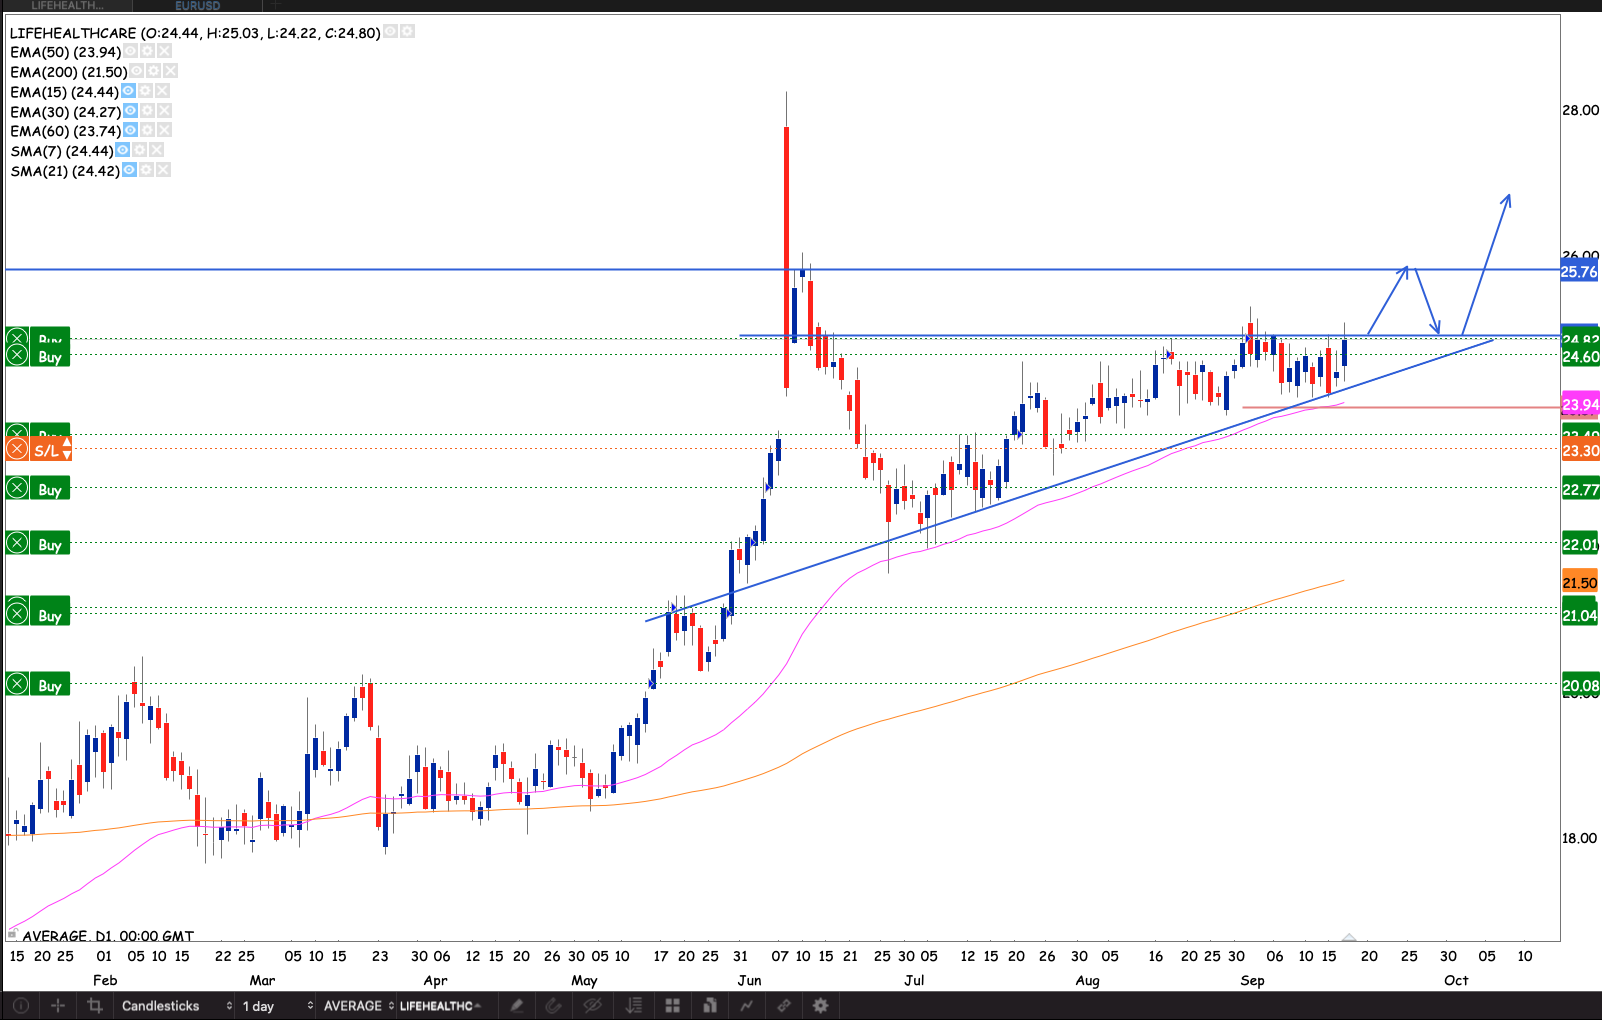
Life Health care
We have a beautiful and wide ascending triangle pattern on the stock. The stock continuously makes higher lows. The R25.80 level has been wall above. Market has been trying to pierce this level but it stood strong. If the stock finally closes through R24.82 I will raise my stop loss to R23.90 and add to my position.
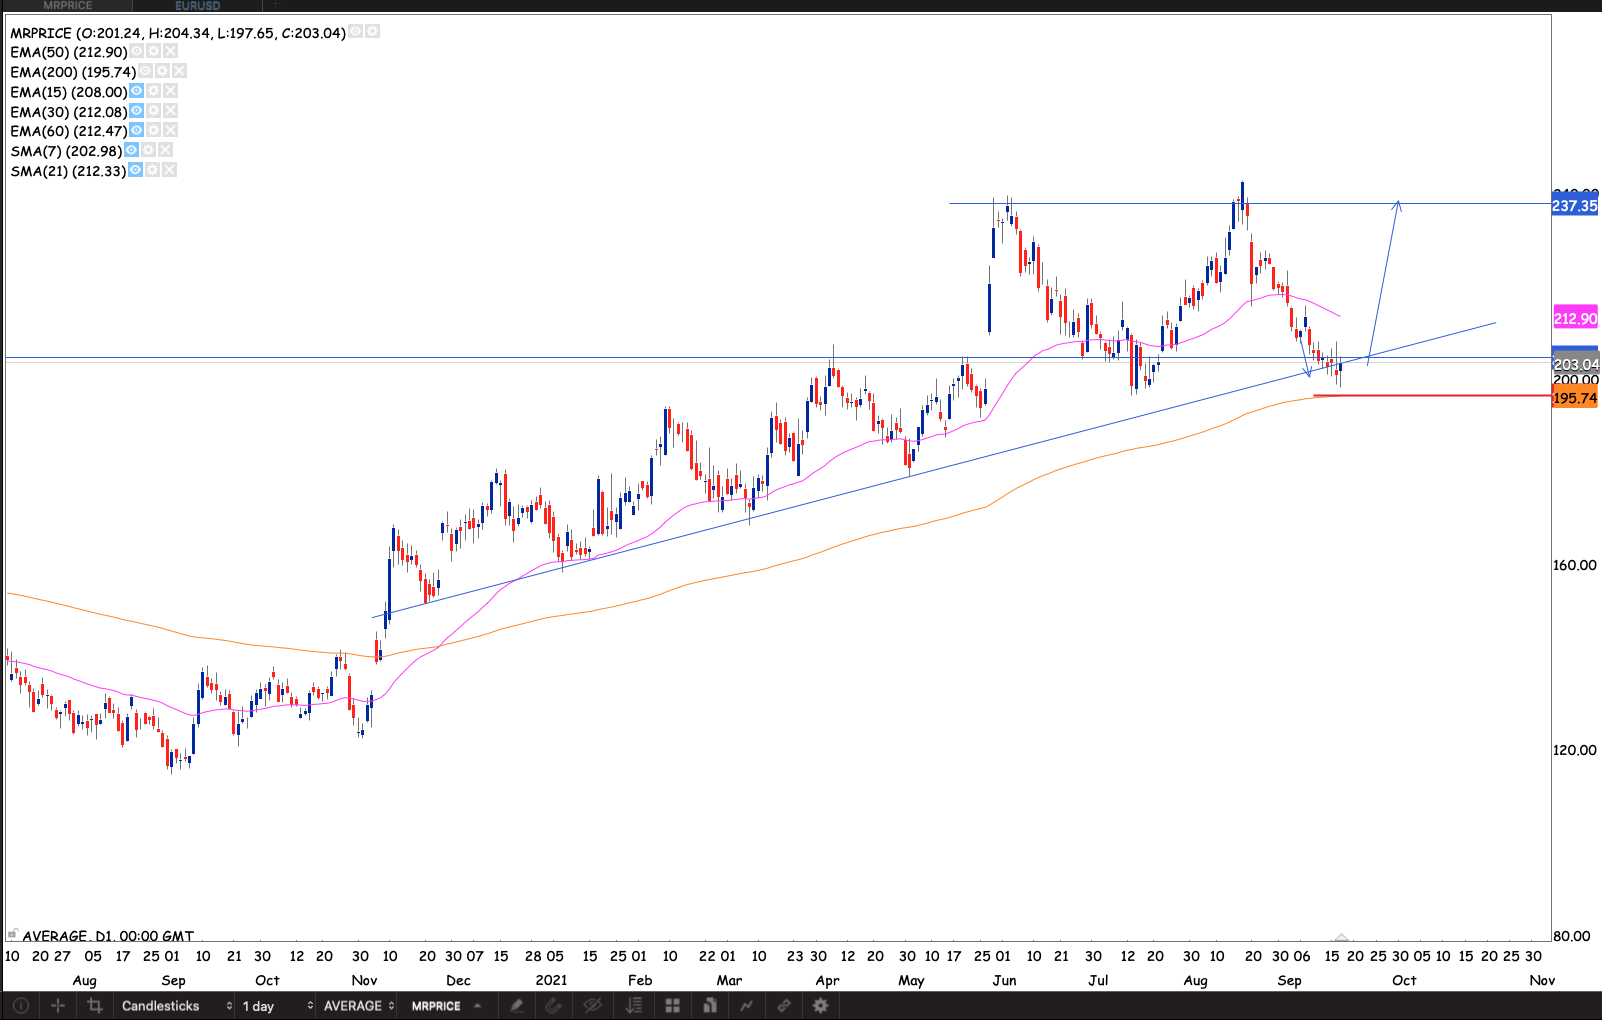
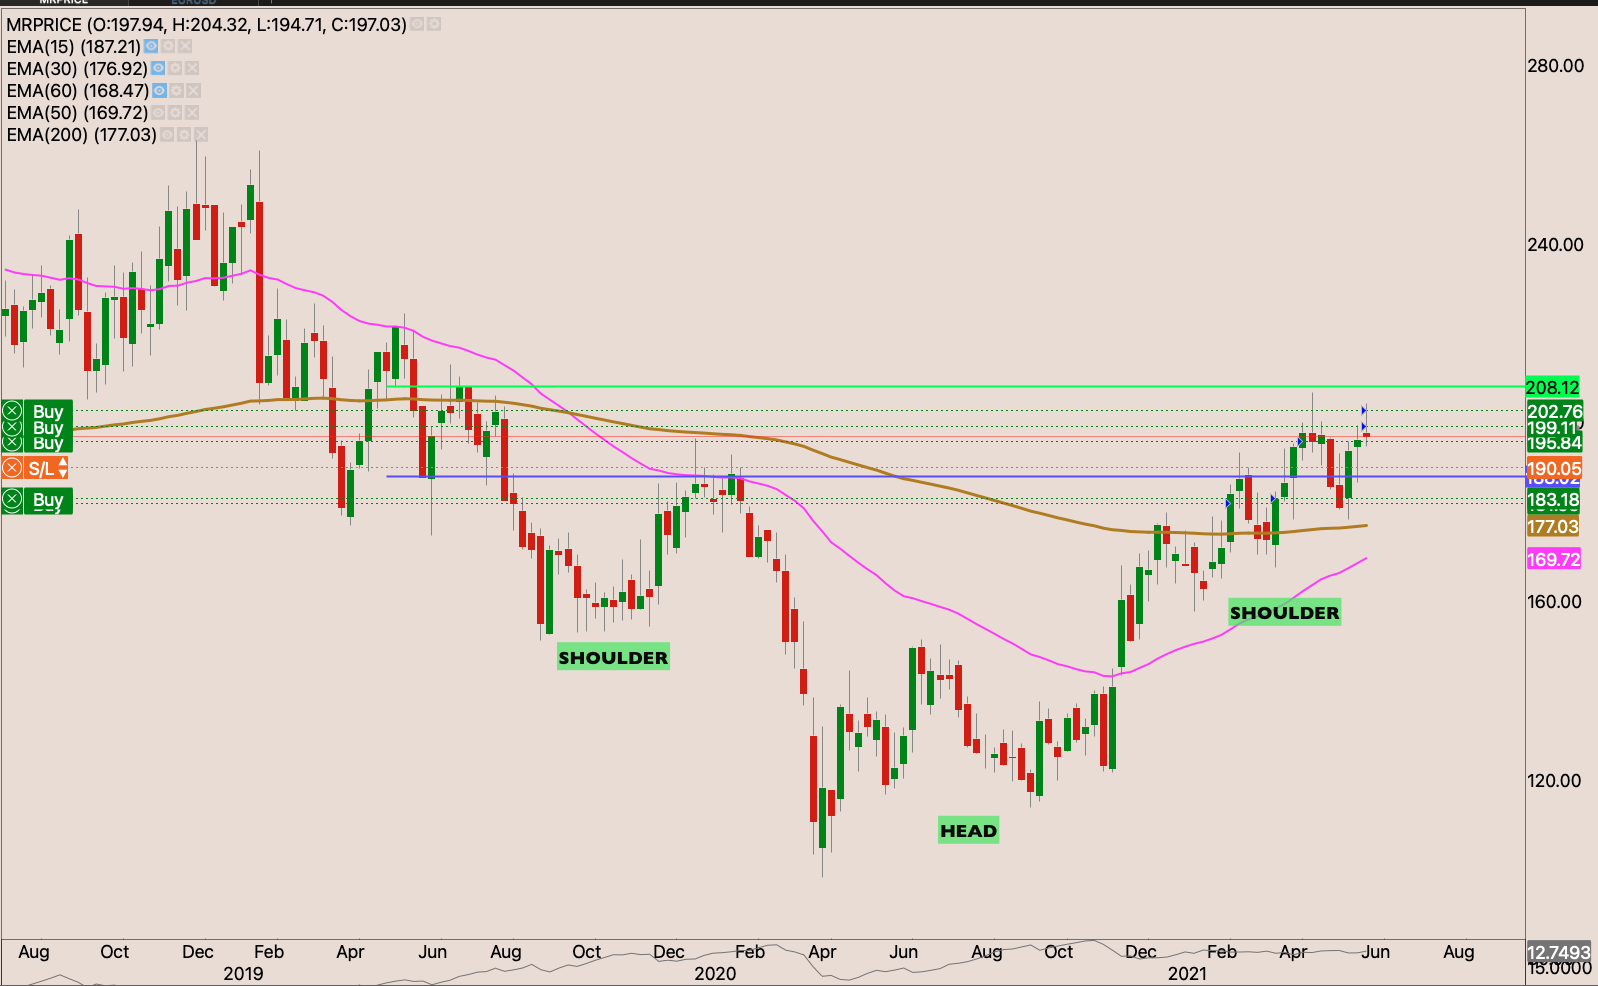
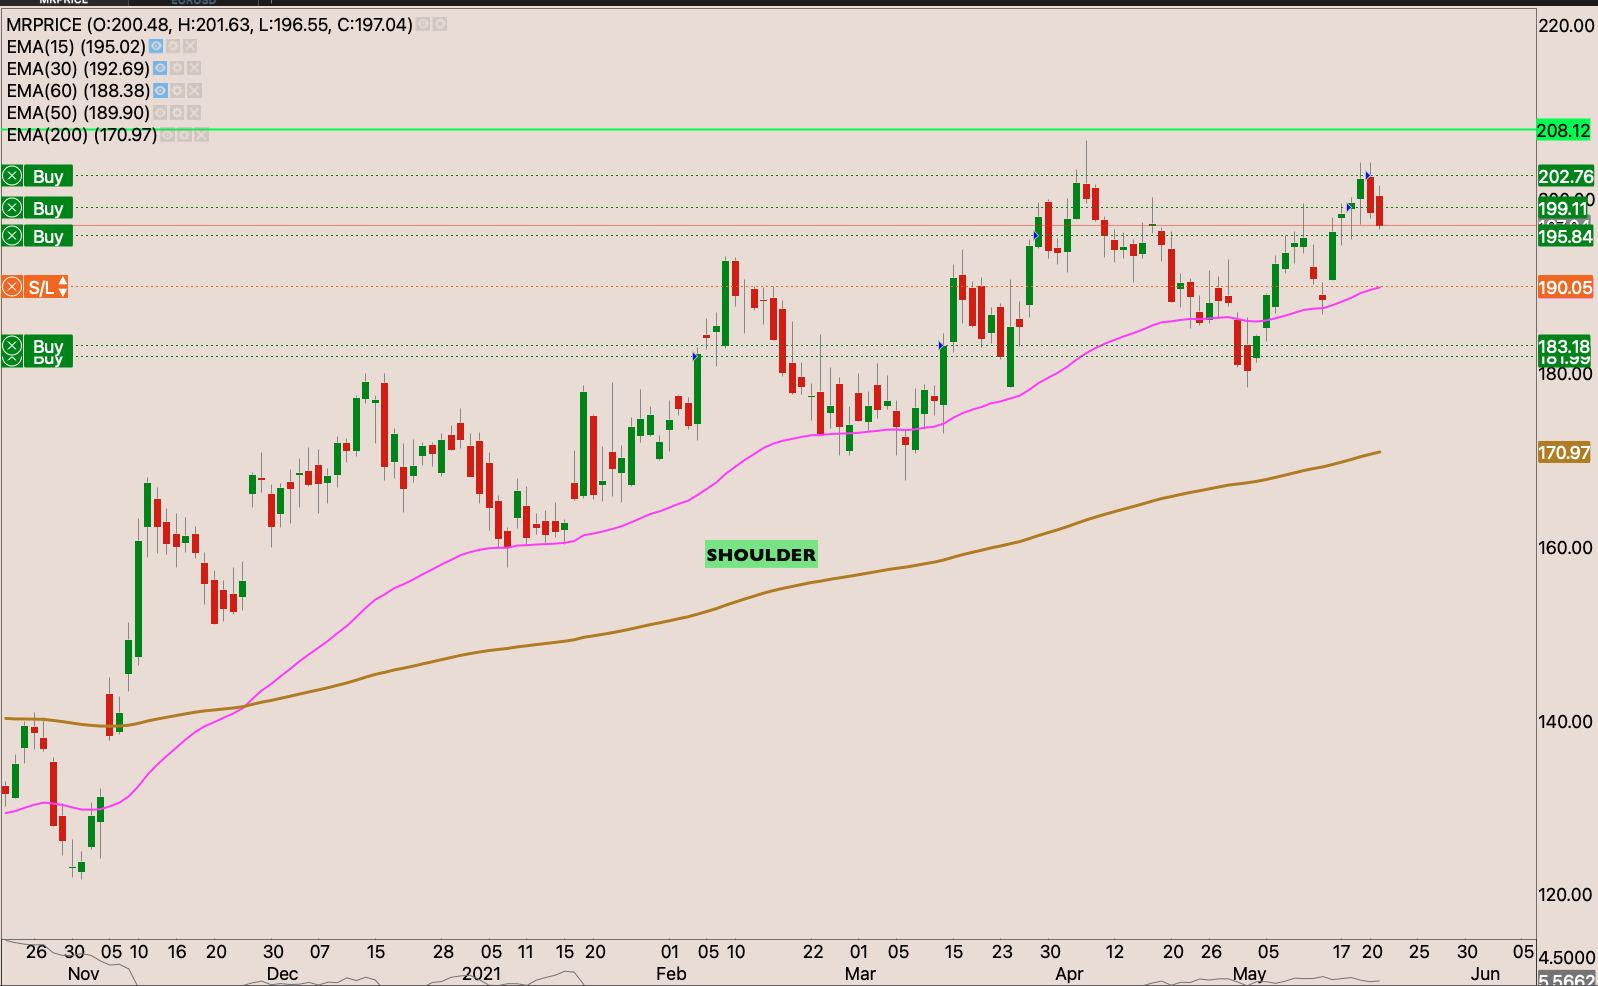
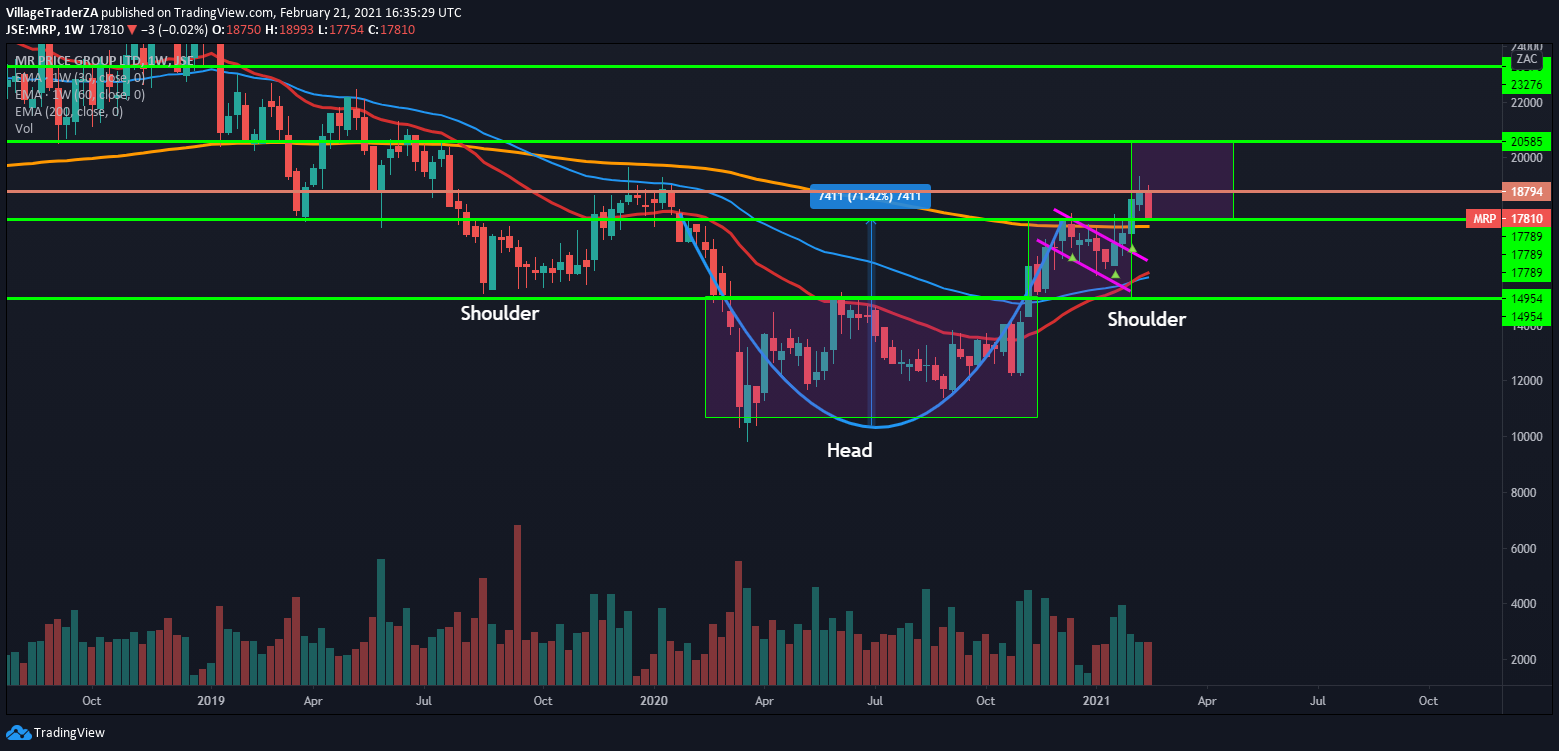
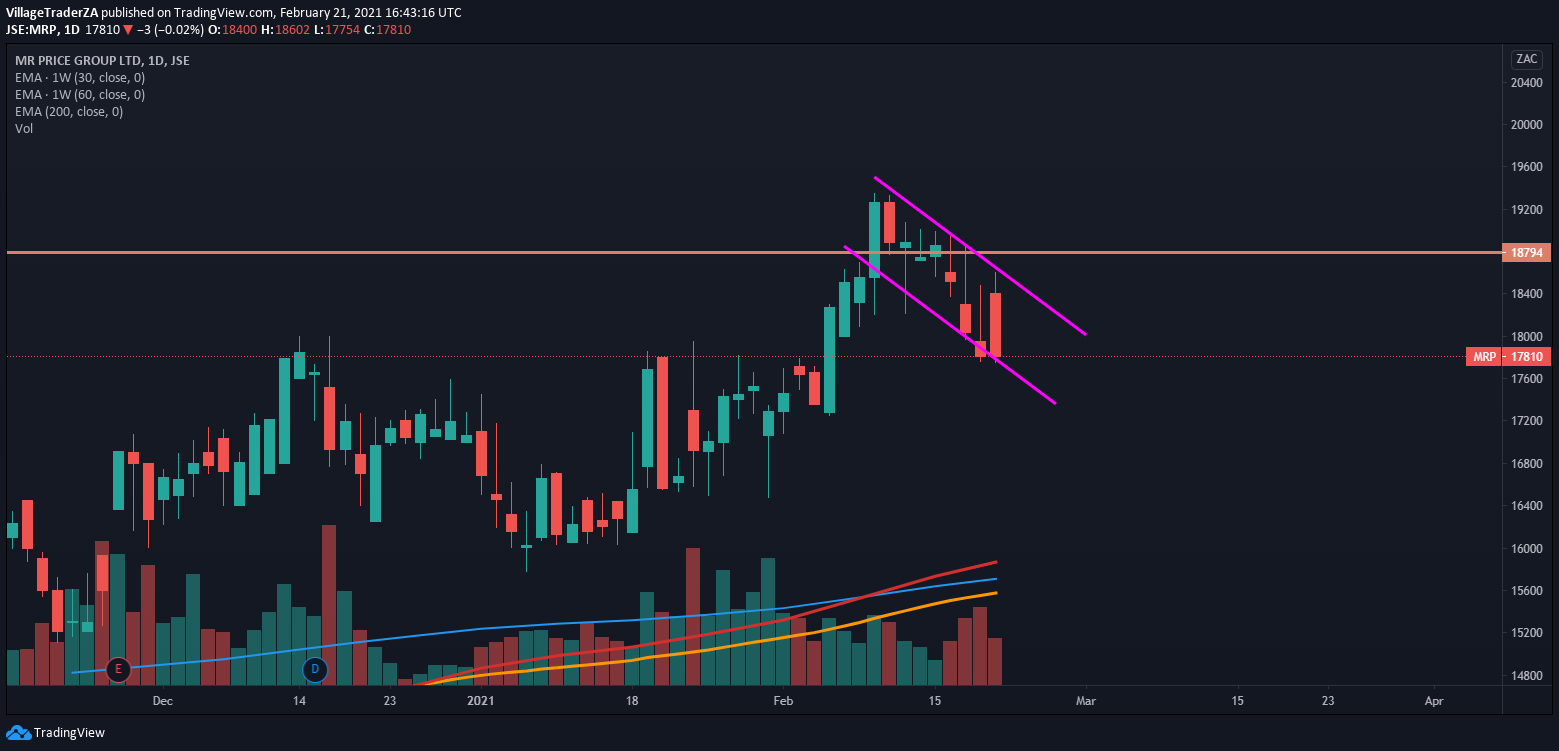
Mr Price
The stock fell short a couple of percent of being in a bear market (-20% decline). However the uptrend support held yet again quite close to the 200 day EMA. Providing an opportunity to start building up a position with a tight initial stop loss just below the Thursday & Friday lows, but for a bit of room just below the 200 day EMA around R195. Providing an excellent short term risk reward trade with a R240 target.
If the stock above R204 I will rebuild my position with an initial stop loss at R195.70
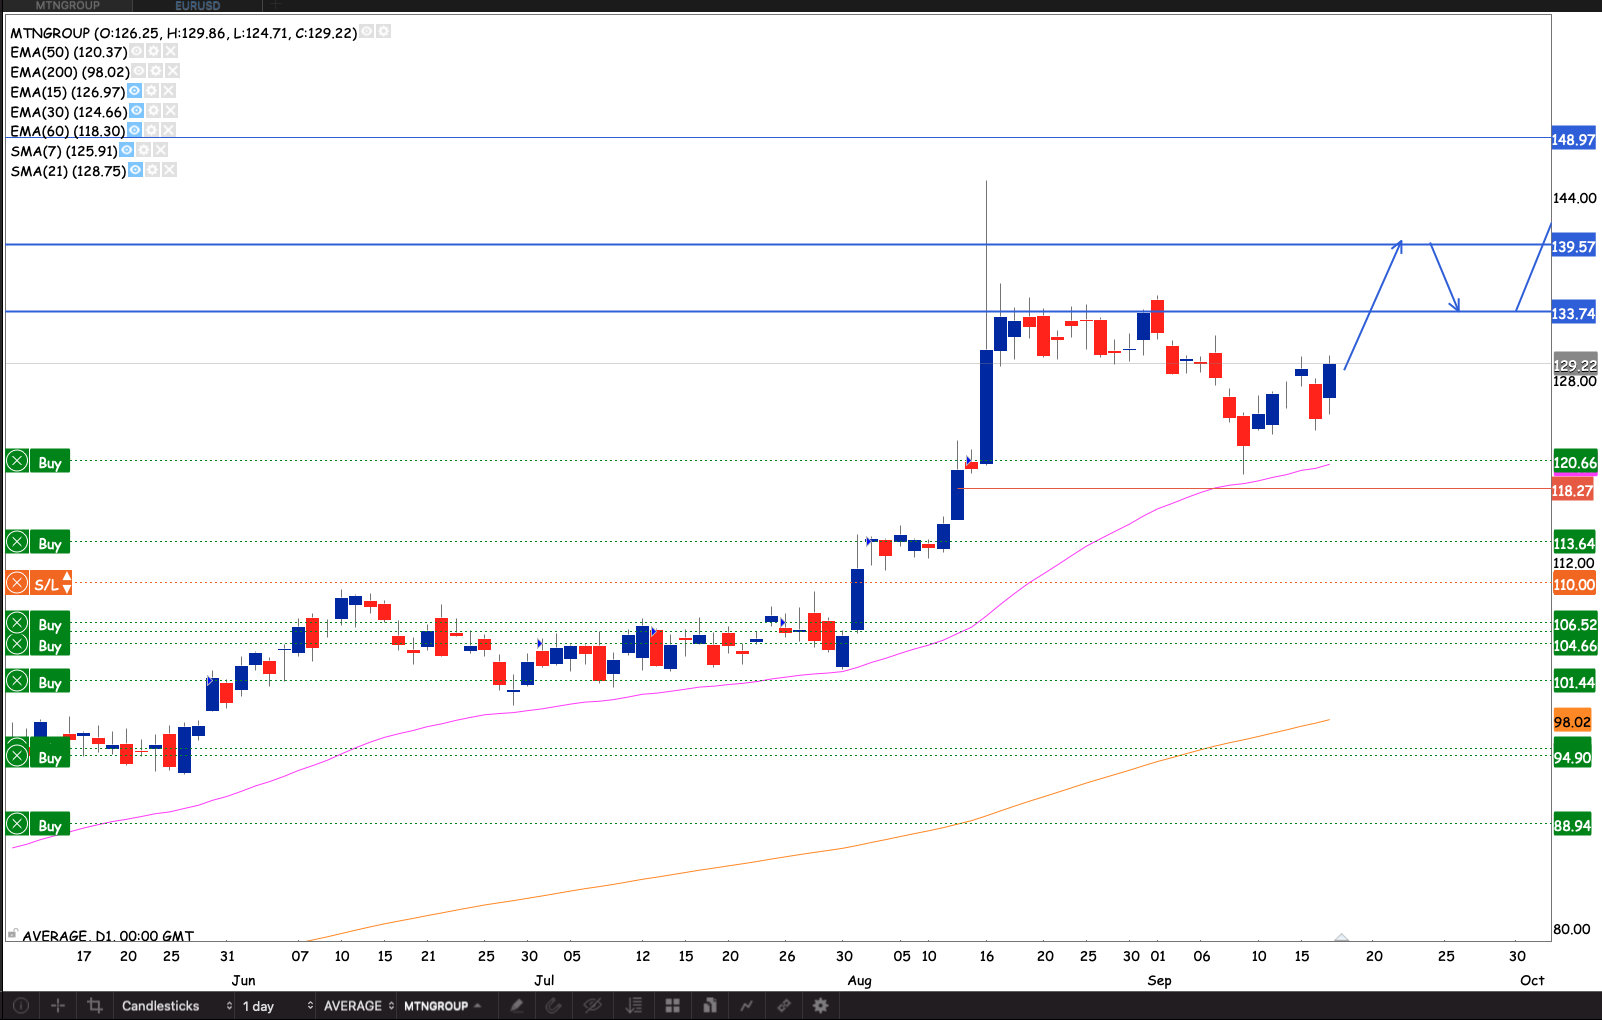
MTN
The stock had a -10% correction to the 50 day EMA repelling from it almost as if they were magnets both showing each other the same magnetic pole. If the stock breaks above R133.65 making a new 52 week high close. I will raise my stop loss to R118.20 and add to the position.
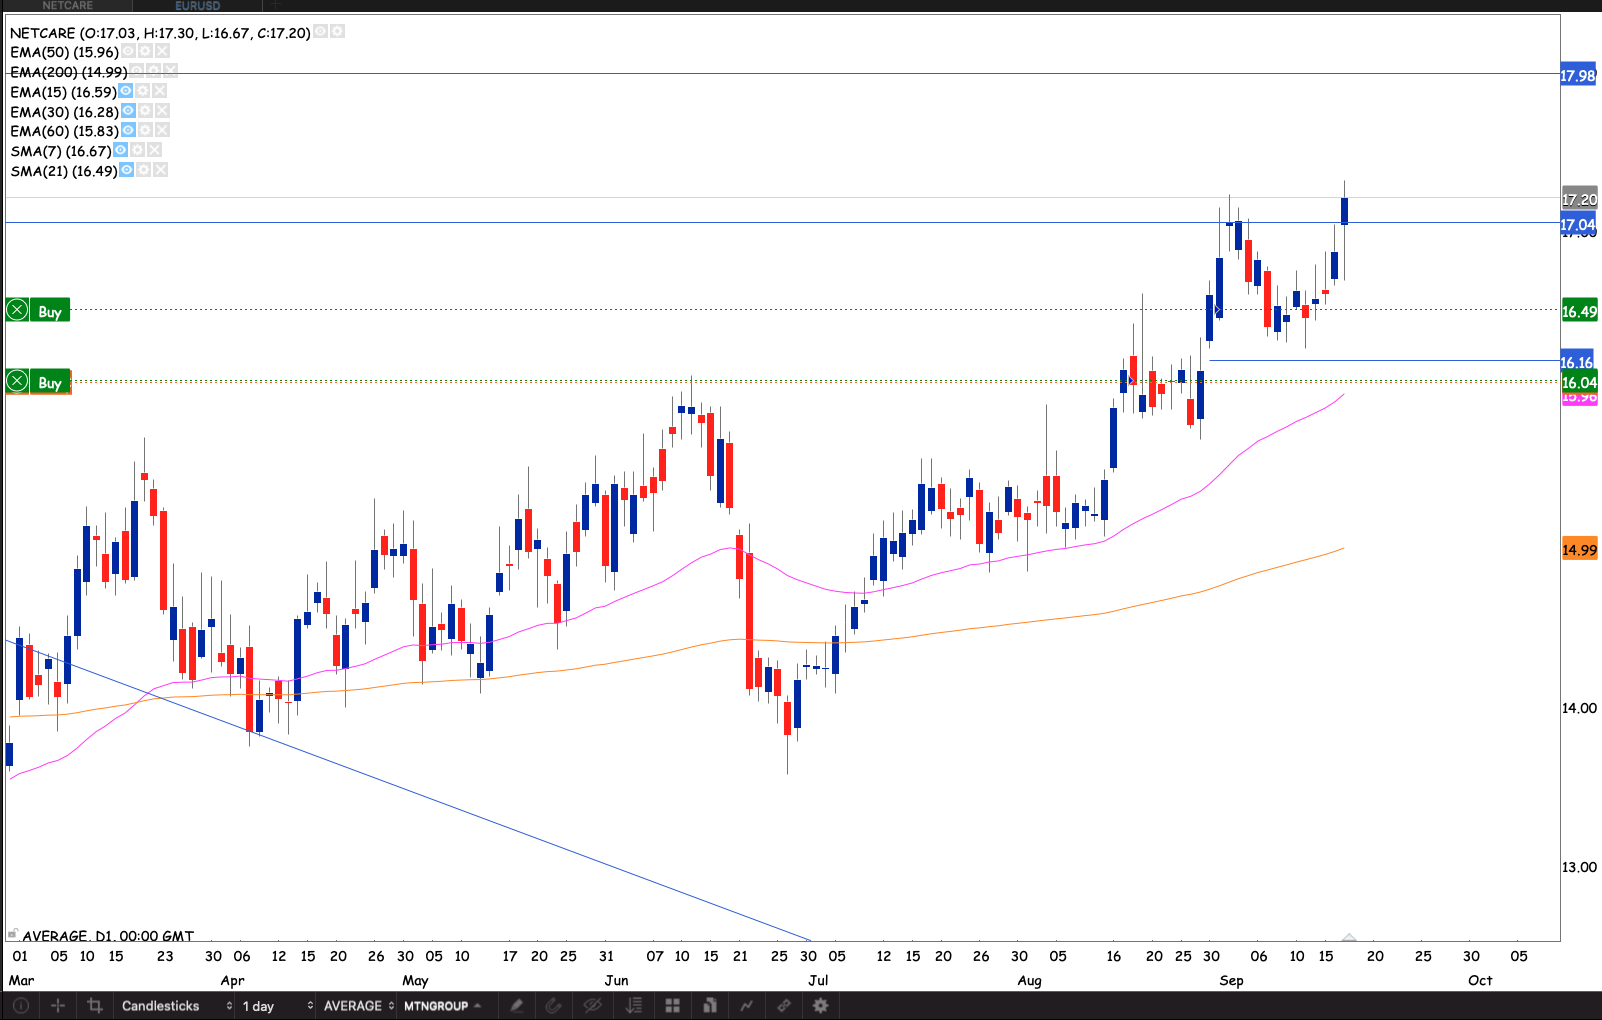
Netcare
The medical stocks have been on a quietly non-volatile uptrend recently. With Covid-19 regulation starting to ease off in time. We will likely see the rise in elective surgery, as pent up demand comes back to the market, post vaccination roll-outs . A big driver of revenue for medical stocks. Life Healthcare and Netcare leading the pack. Netcare stock broke out from a short term consolidation on Friday. I will add to my position at the open on Monday. I’ve raised my stop loss to R16.04
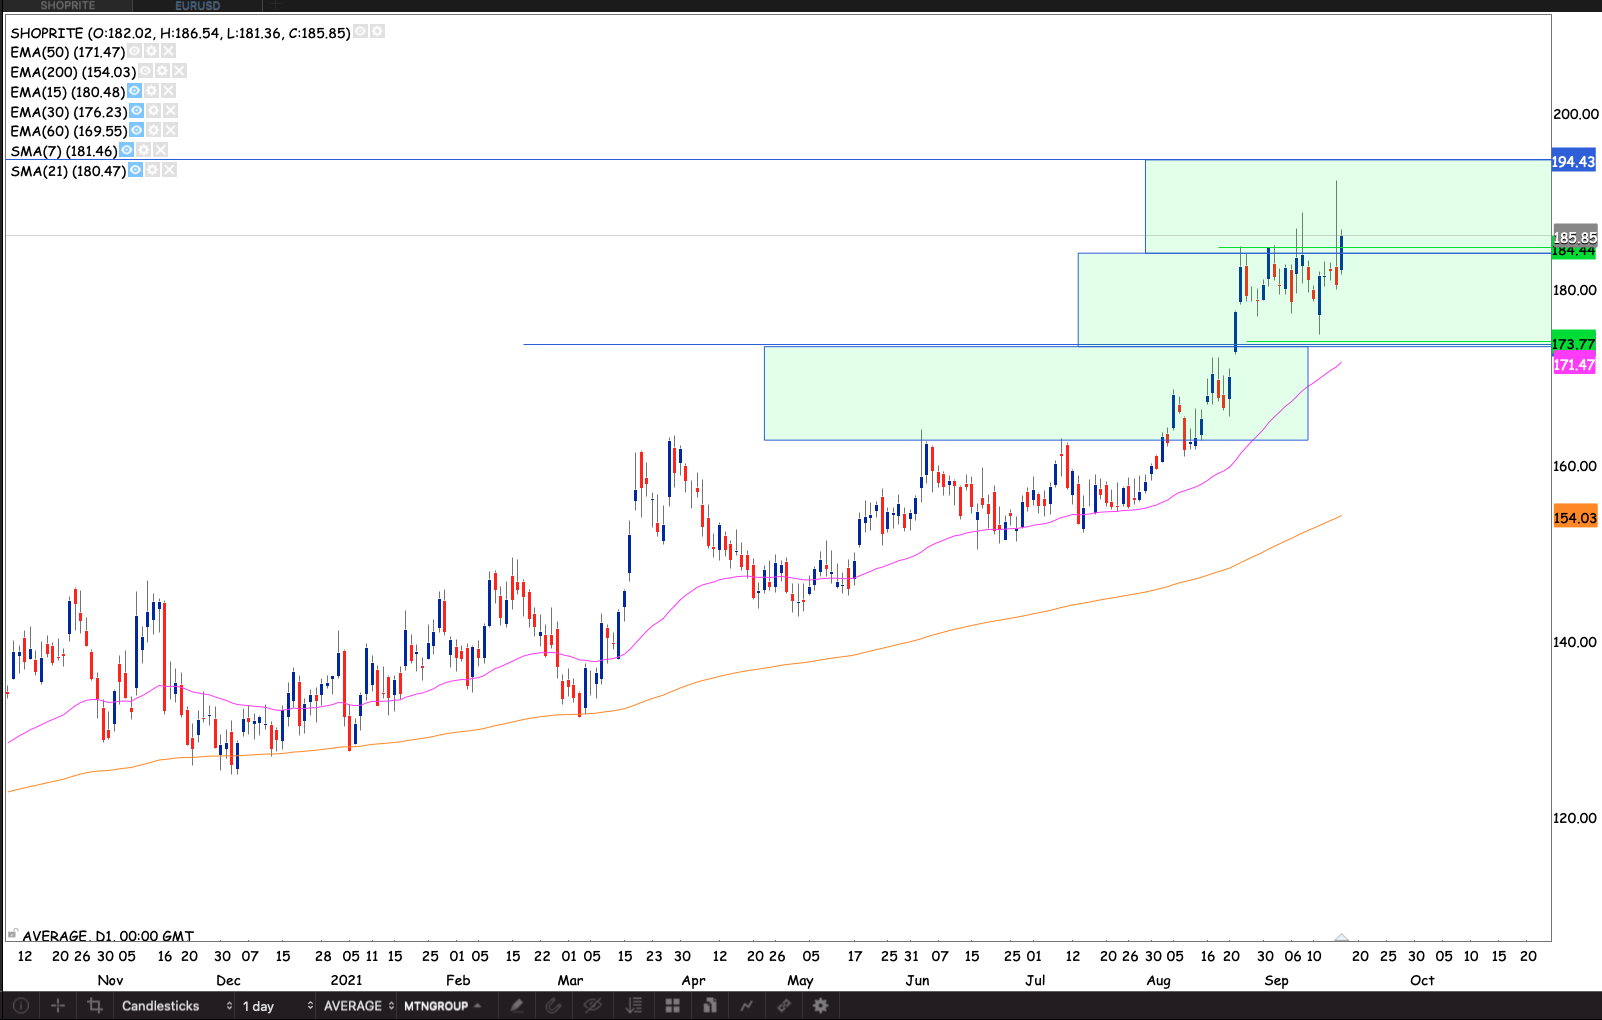
Shoprite
The stock reentered the R184 – R194 box on Friday. I will rebuild my position with an initial stop loss at 173.70
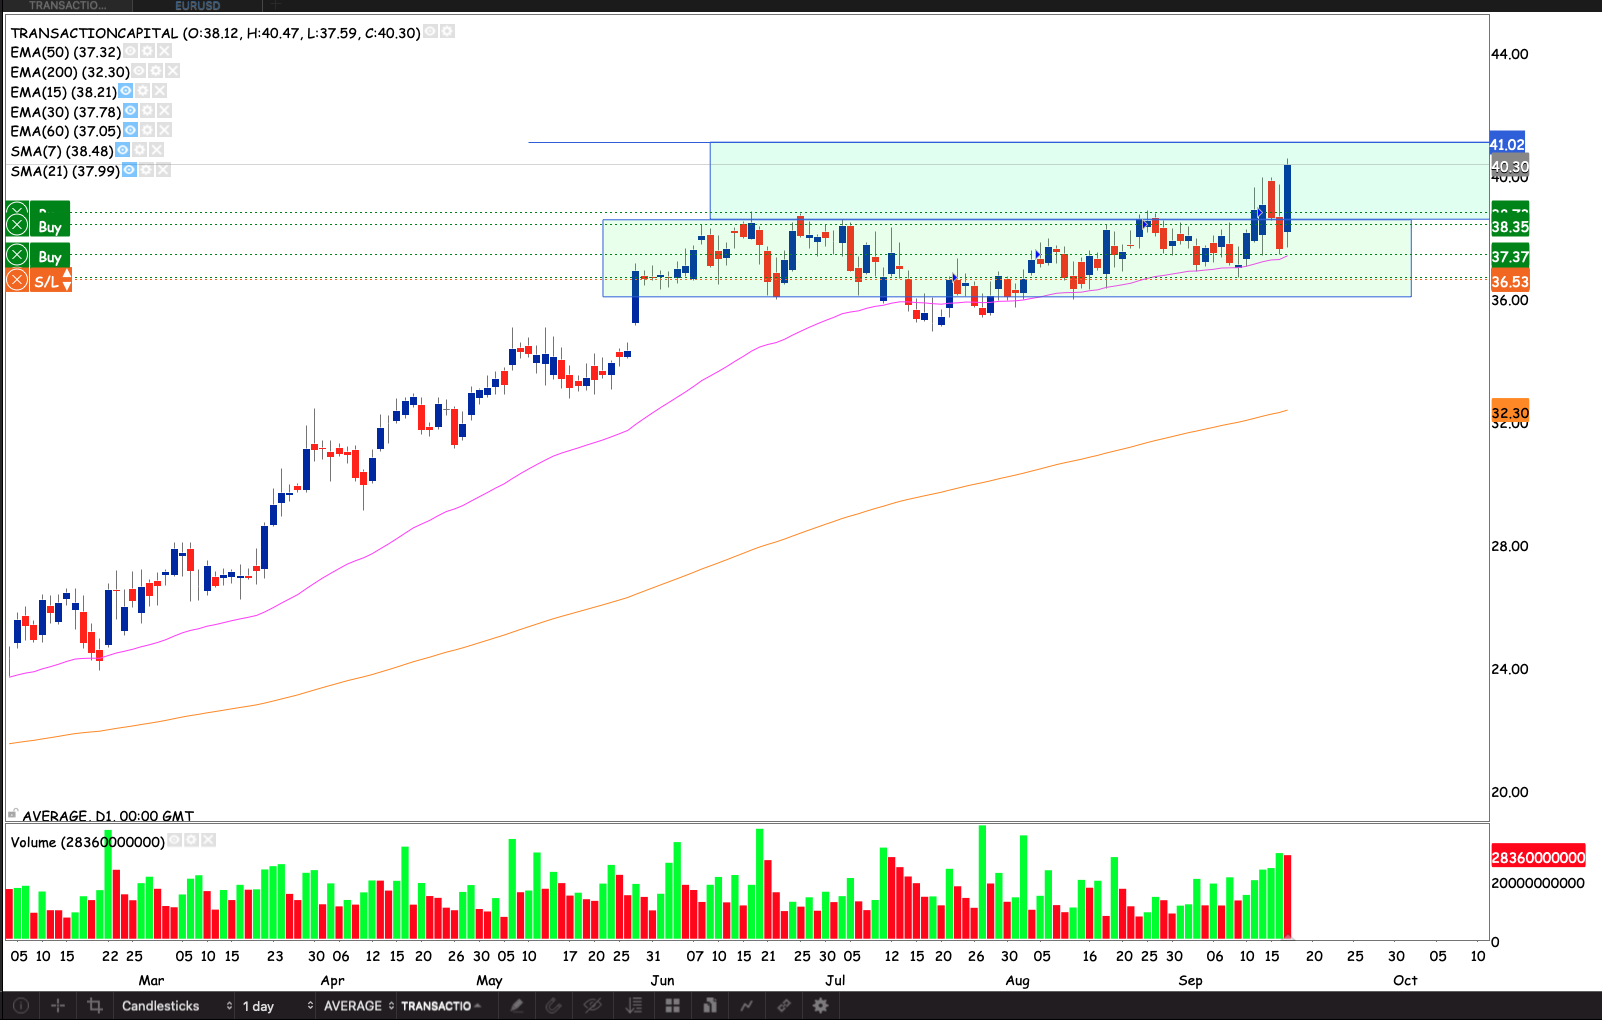
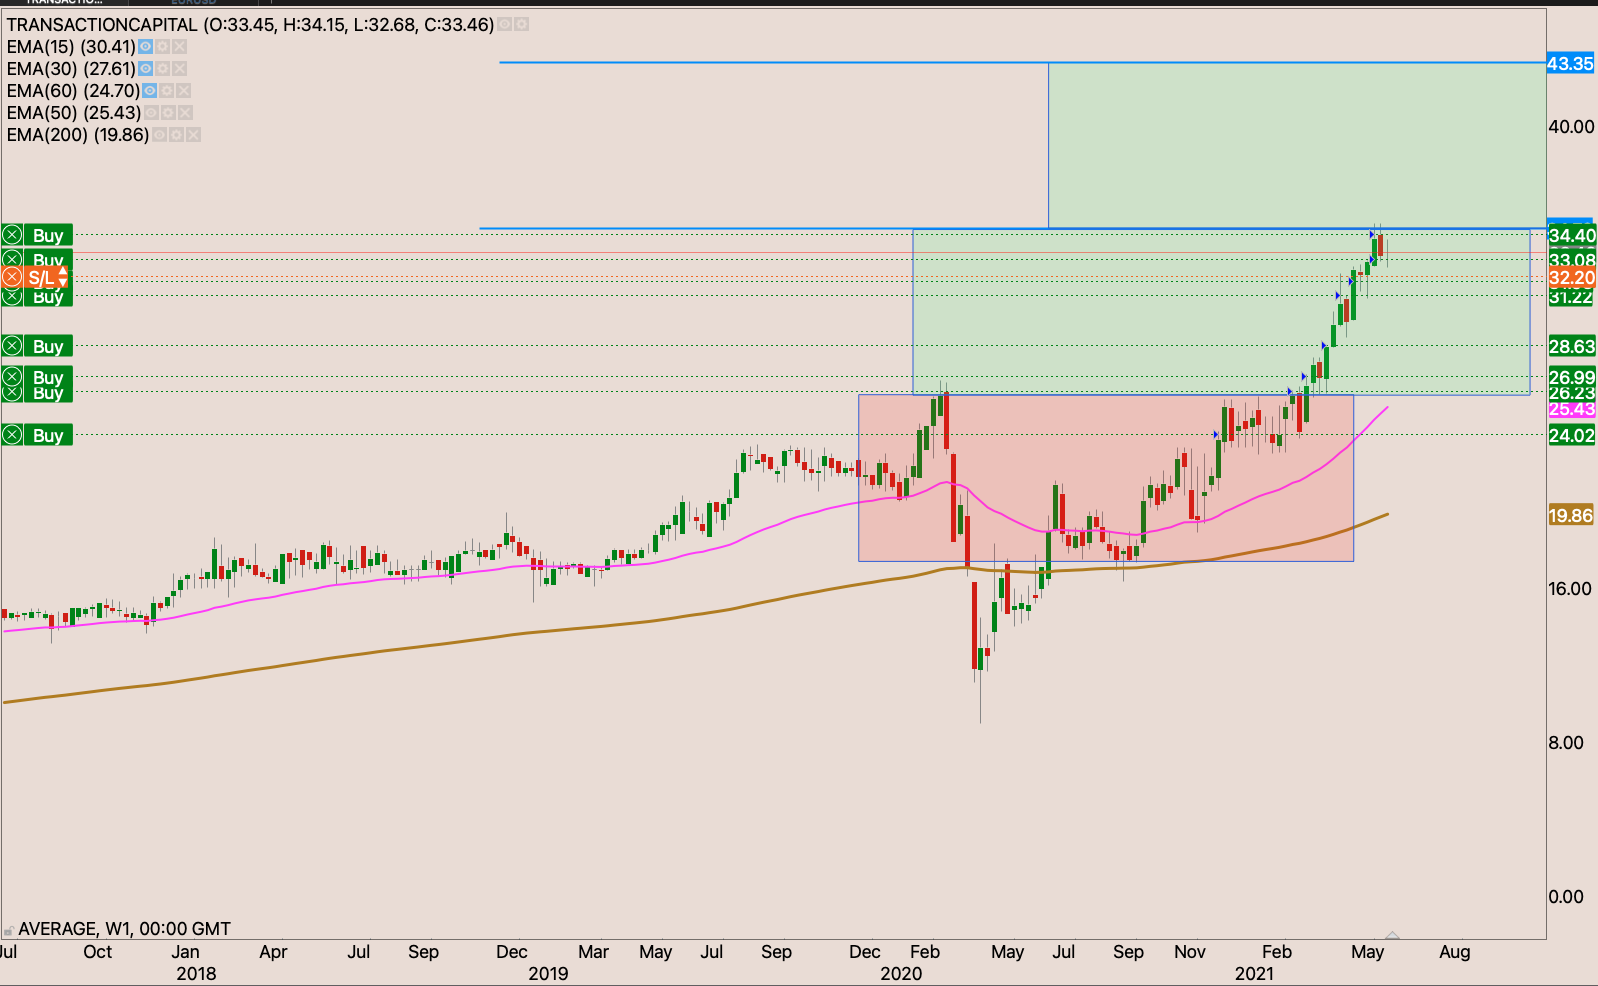
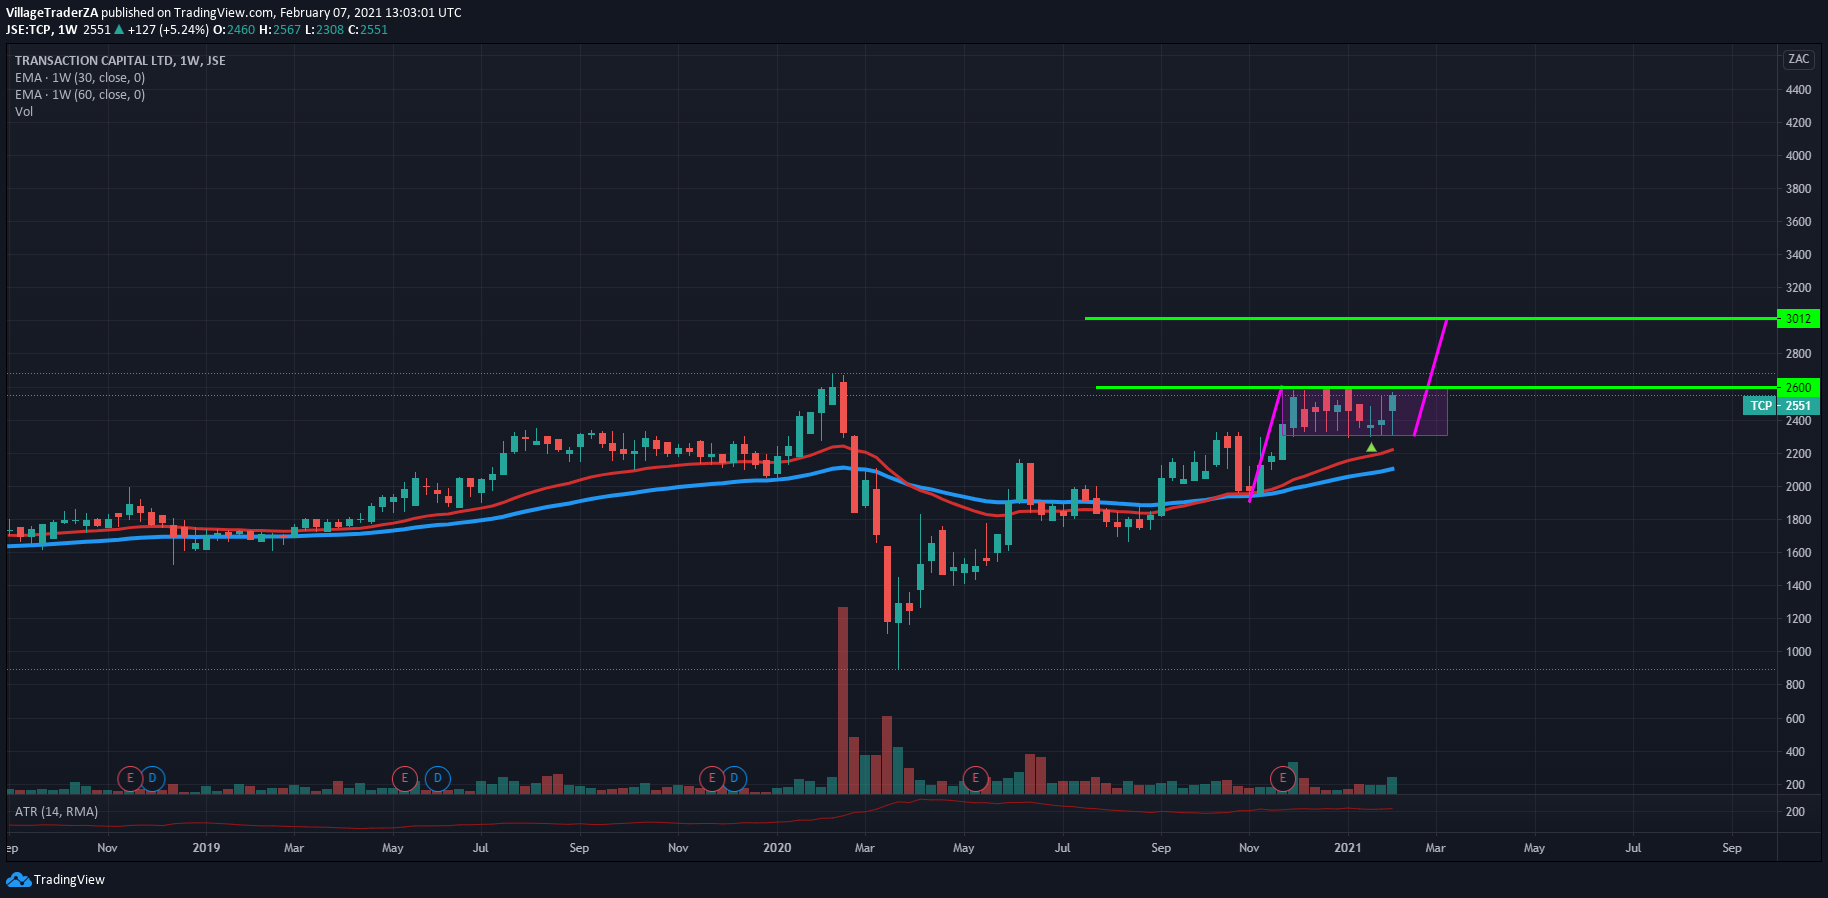
Transaction Capital
The stock got going again last week. The to entered the higher box on increased volume. Looking well poised for a short stay in the current R38 – R41 box. If the stock closes through R41 entering the higher box I will add to my position and raise my stop loss behind me
Account Summary on 20 September 2021
Capital invested: R10 303.77
Current Balance: R6 061.13 -41.18%
Current Equity (Balance including paper P&L): R17 130.45 +66.25%
Current P&L : +R11 069.32
Closed position stats.
Open position stats assuming all stops are hit
Performance against the benchmark (Satrix 40 ETF)
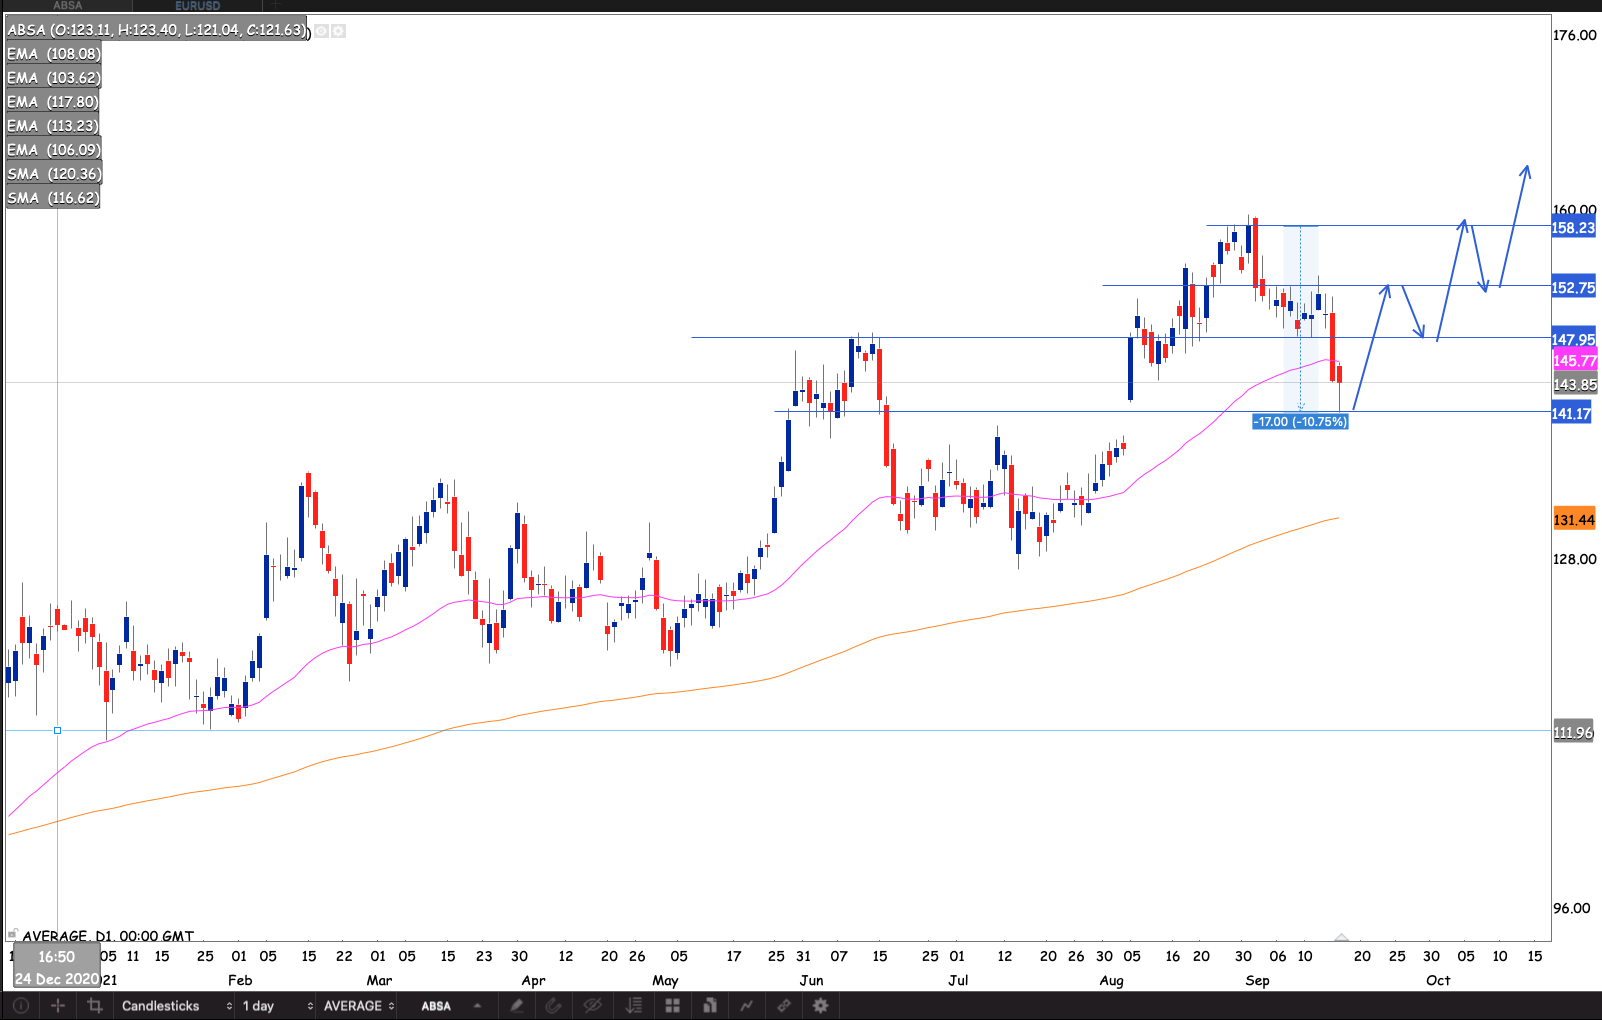
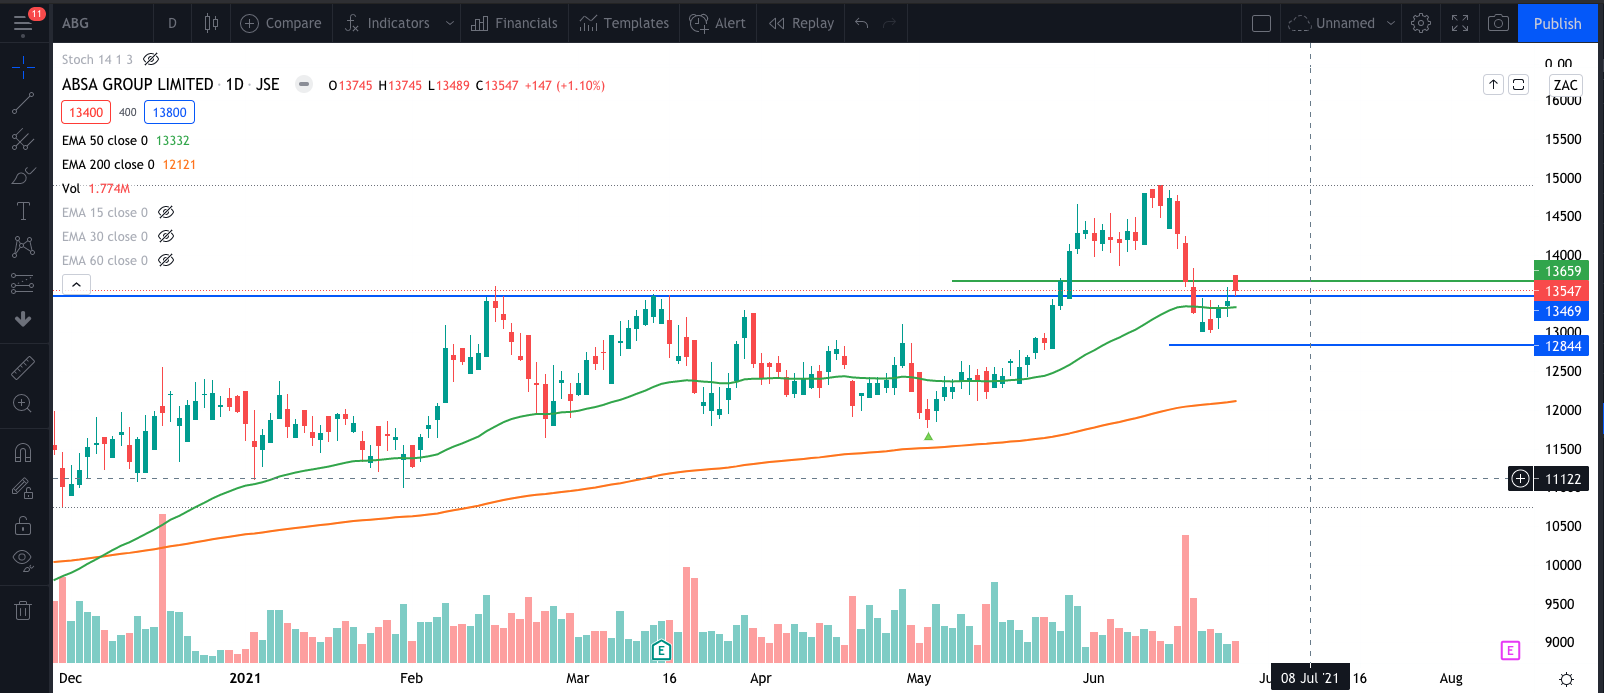
Absa (ABG)
The stock broke out from the cup and handle pattern. It did come back in the last couple of weeks, but it held what was resistance as support. Ending the week slightly above the 200 week EMA.
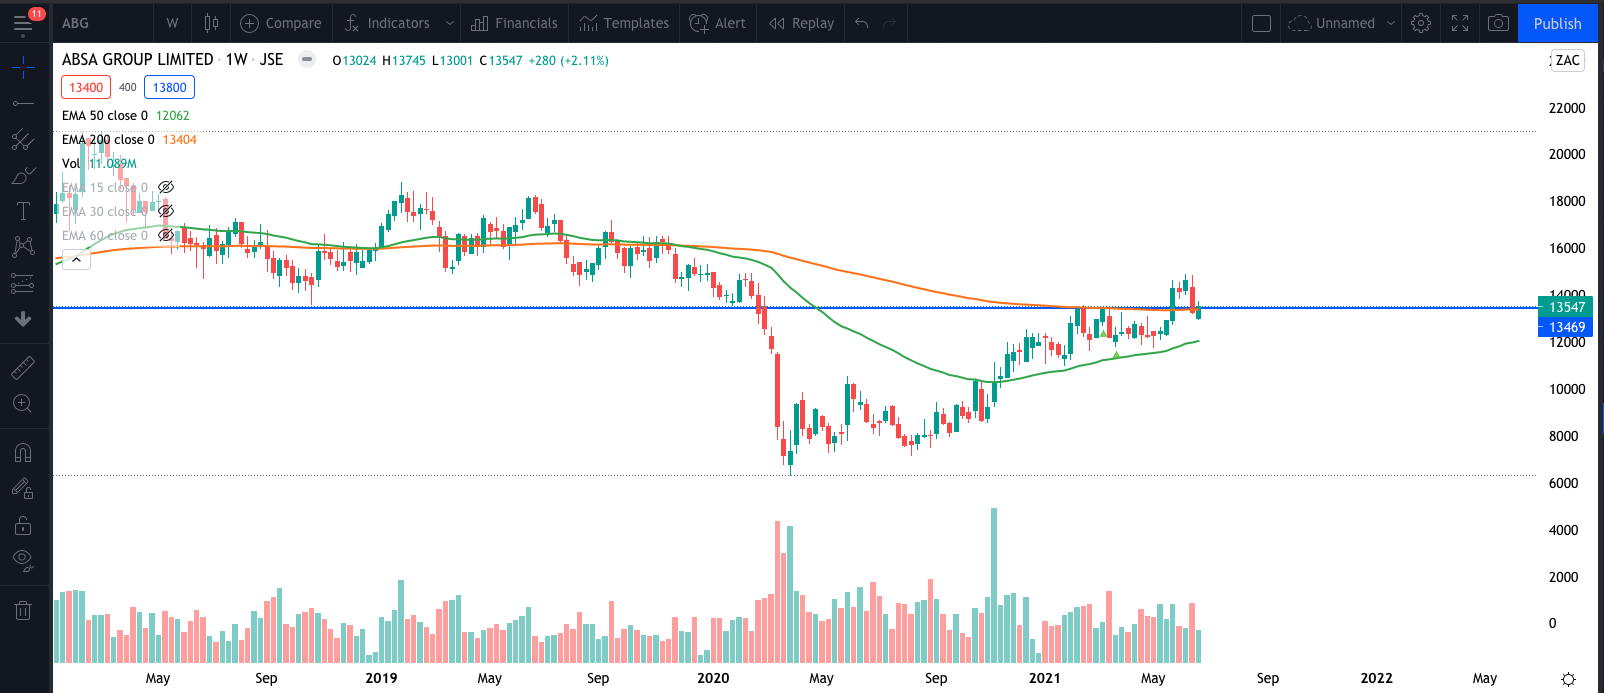
Zooming into the daily chart the stock the 50d EMA. If we can get a close above R136.60 I will buy the stock.
_____________________________________________________________
African Rainbow Minerals (ARI)
The stock experienced a 30% correction since March. The correction seems to have reached its end. The closed below the 50 week EMA last week and immediately recovered and closed back above the 50 week EMA.
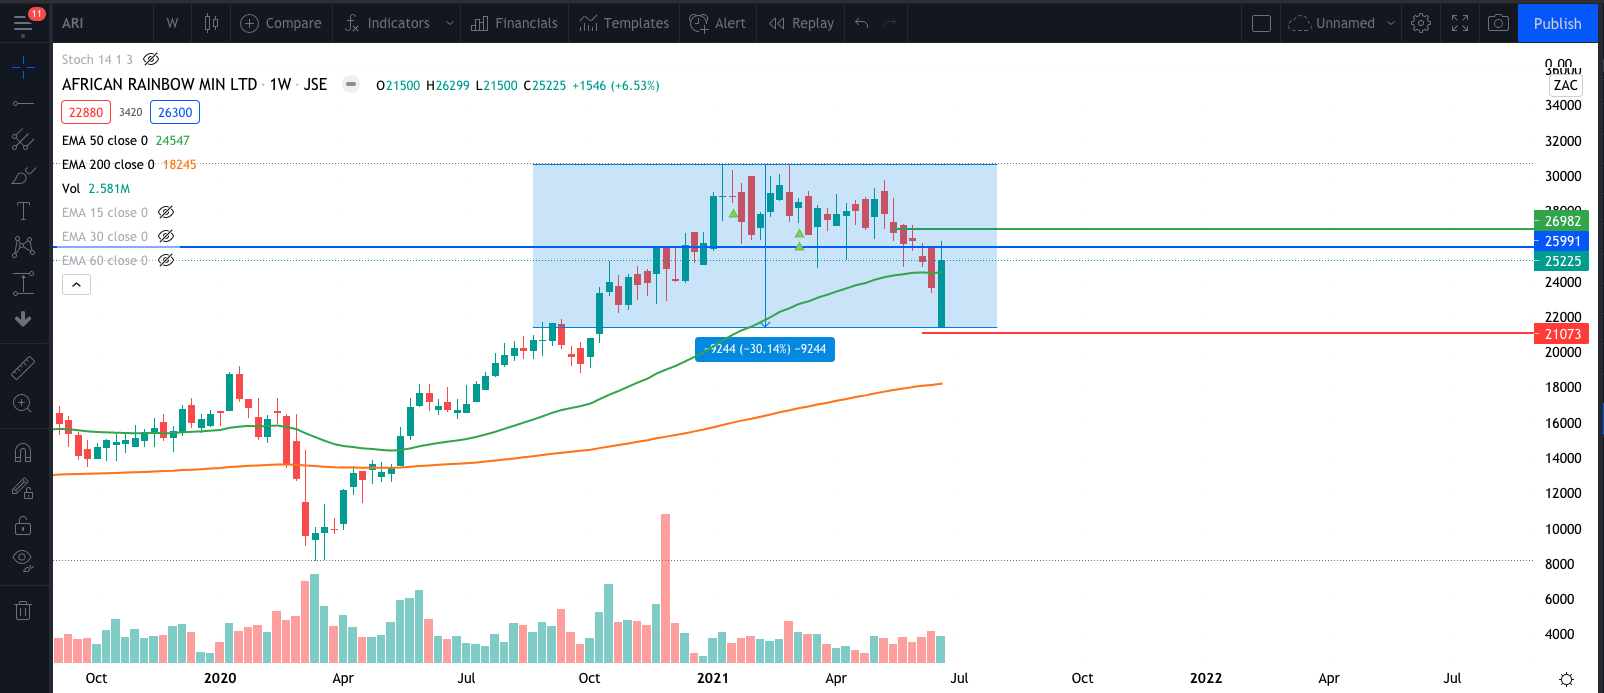
If the stock closed back above the 50d EMA and closed above R269.80. I will buy the stock with a stop just below the past week’s low around R210
_____________________________________________________________
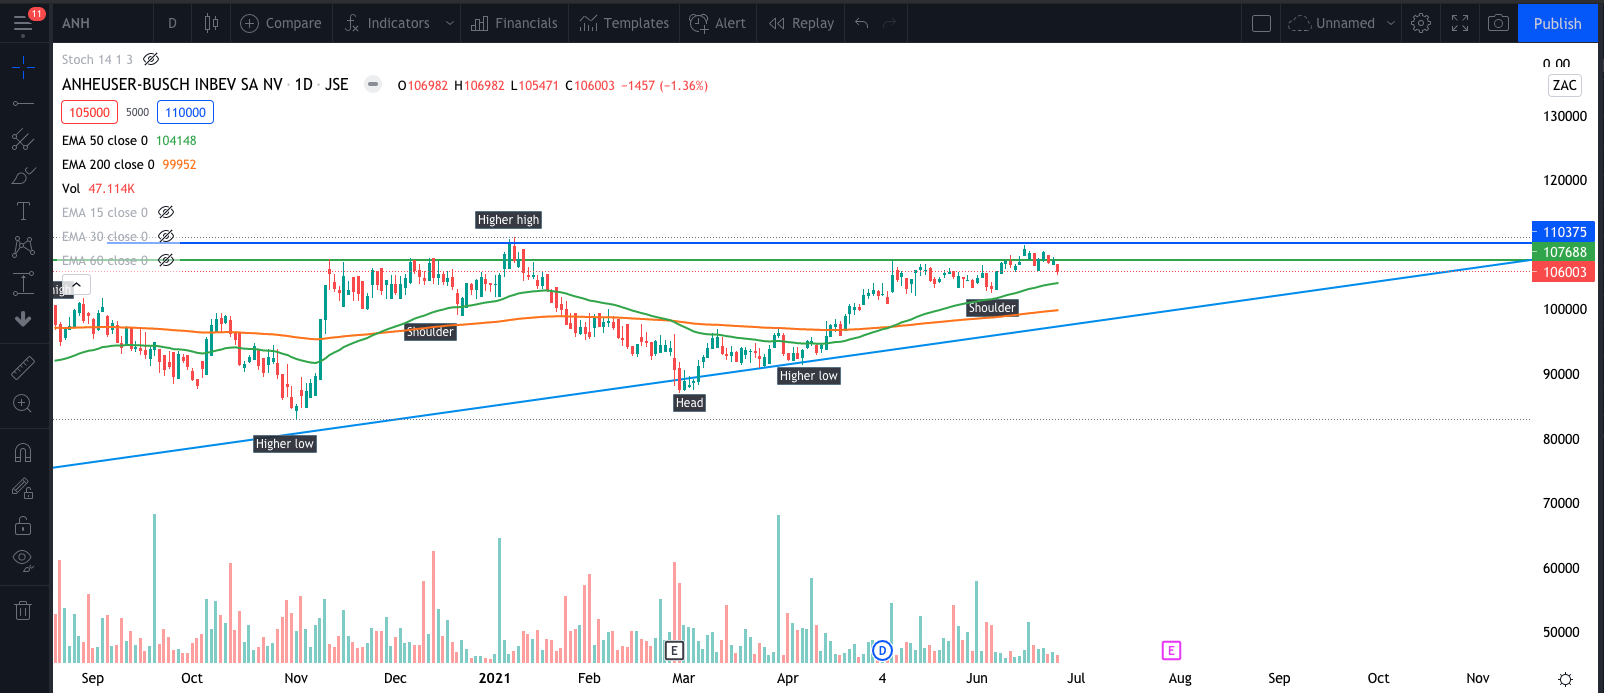
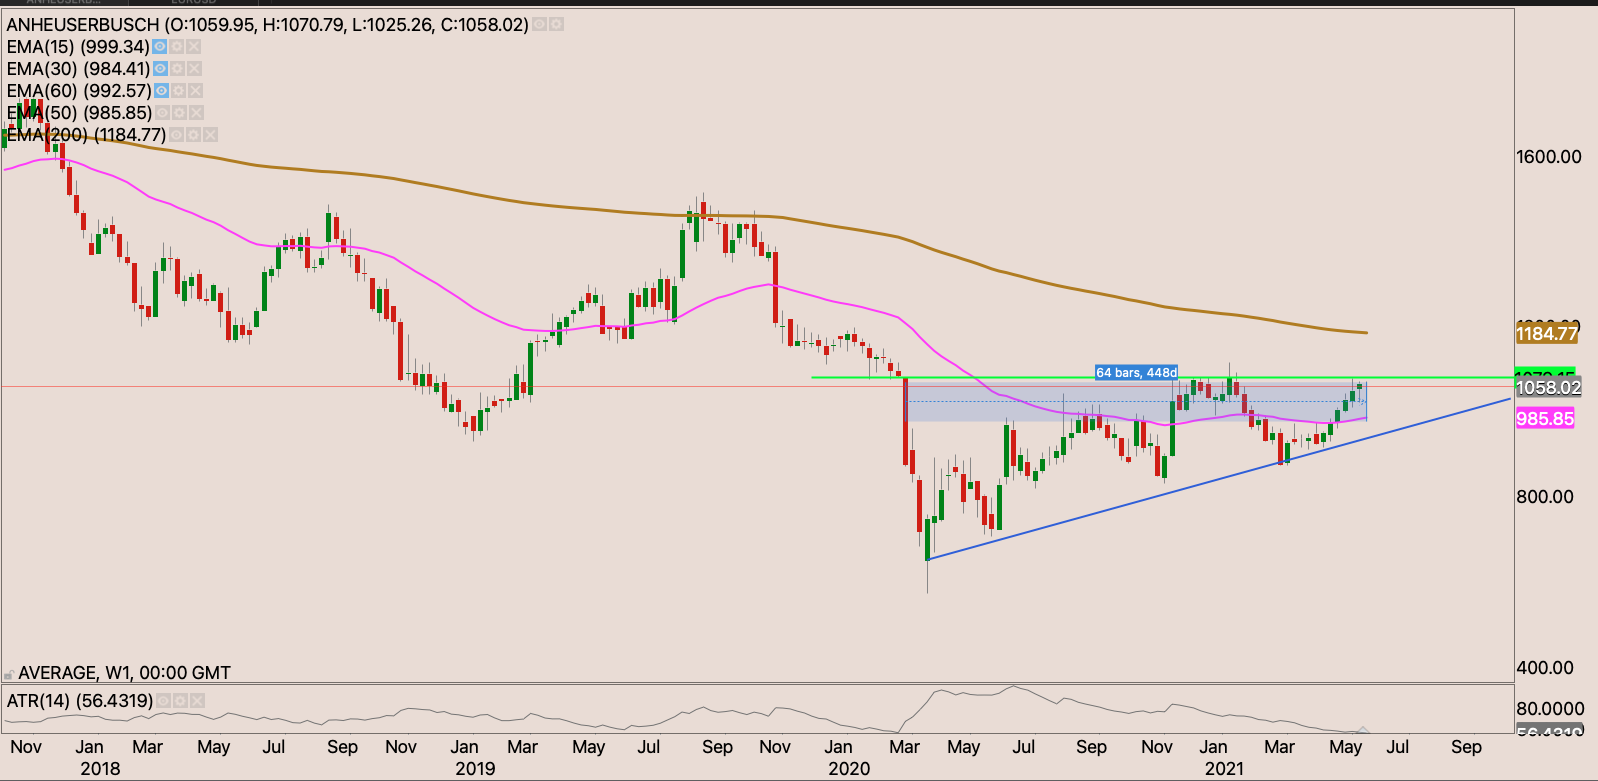
Ab InBev (ANH)
This is looking very nice and ready for a bull run. A combination of rising bottoms and rising tops. Plus an inverse head and shoulders pattern. If we get break the neckline with a closed above R1103.75 It will be buy time for me
_____________________________________________________________
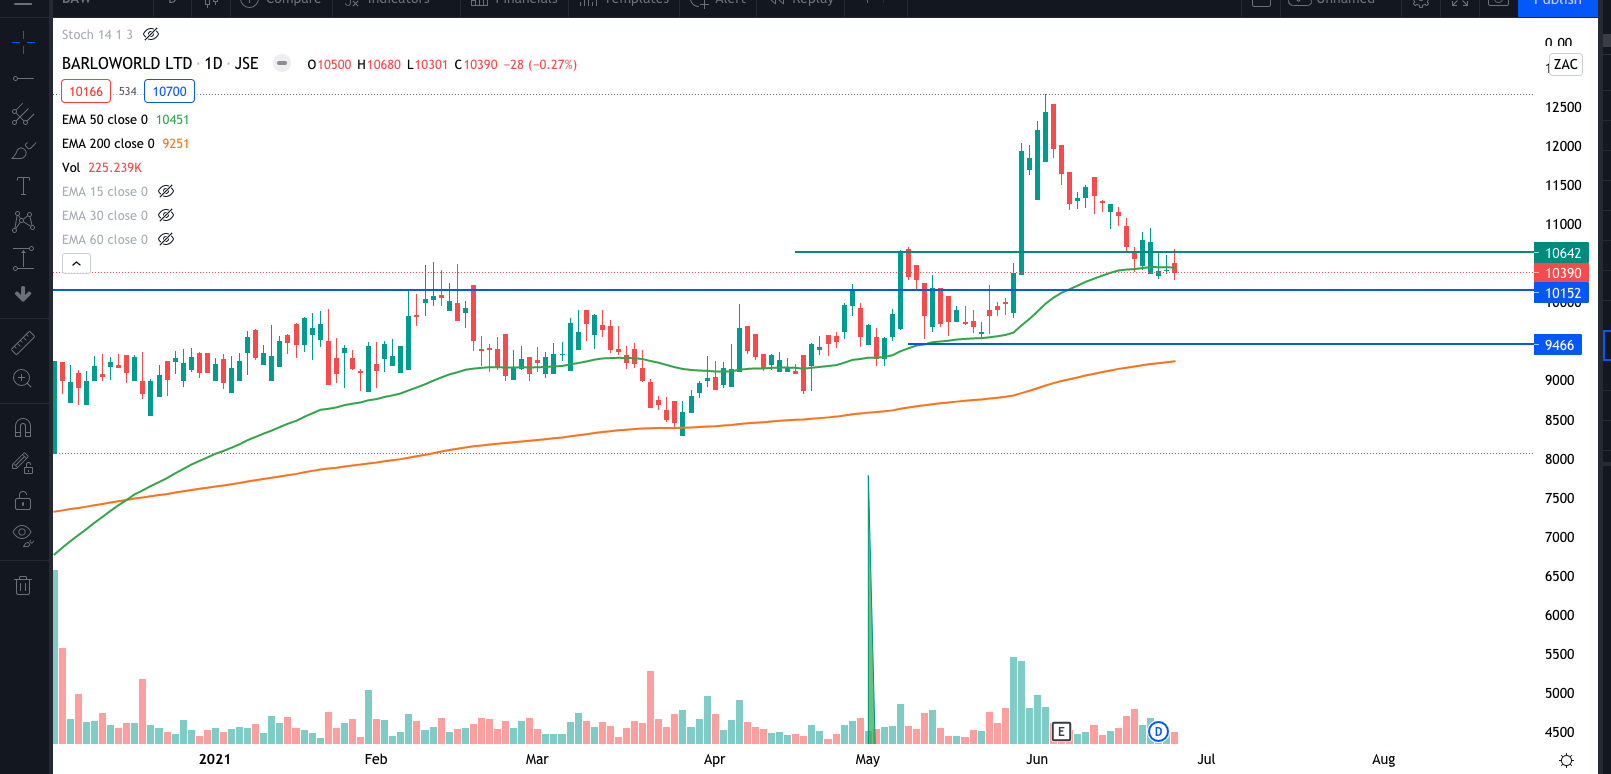
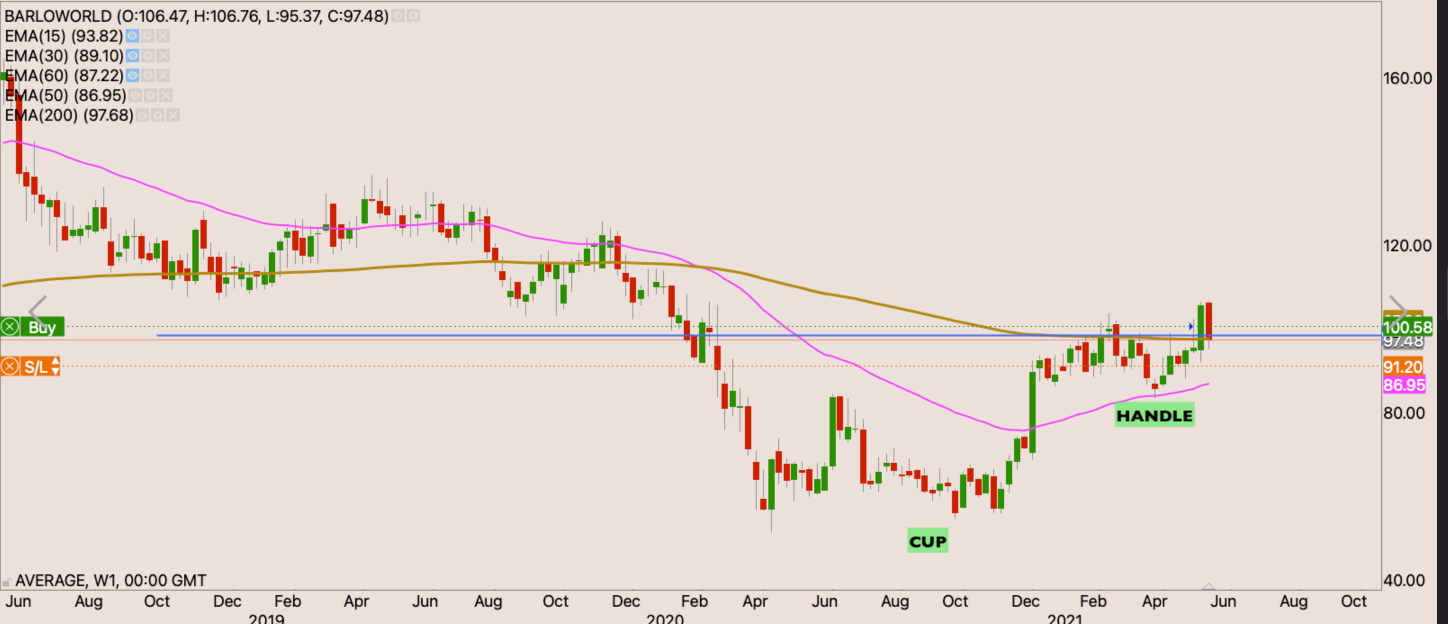
Barloworld (BAW)
Sharp pull back on the stock but holding the 50 day EMA. And what was resistance at R101 stood firm and hasnt been touched since the initial breakout a few weeks ago. If we get a closed above R106.42 I jump back in the trade
_____________________________________________________________
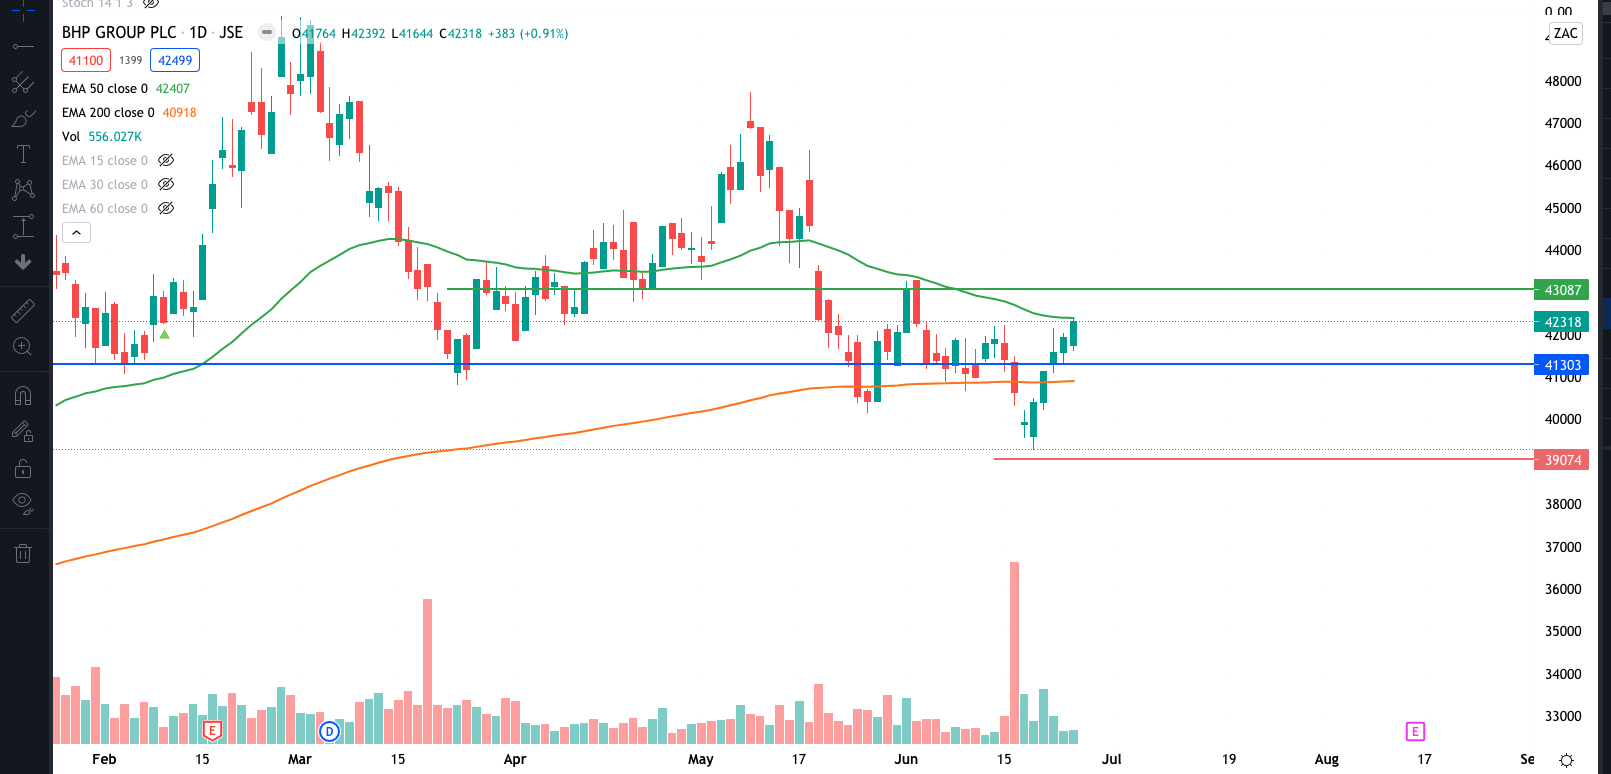
BHP (BHP)
Commodity stocks saw quite a sell off since. BHP was no exception. Since May the stock has been seeing falling bottoms and tops, struggling with the 50d EMA. If we get a close through R431.10, as it would have finally won against the 50d EMA. I will buy with a stop loss at R390.75
_____________________________________________________________
Bidcorp (BID)
There’s a nice round bottom on the stock. There’s a resistance level at R319.75. If we get a close through this price i will buy the stock.
_____________________________________________________________
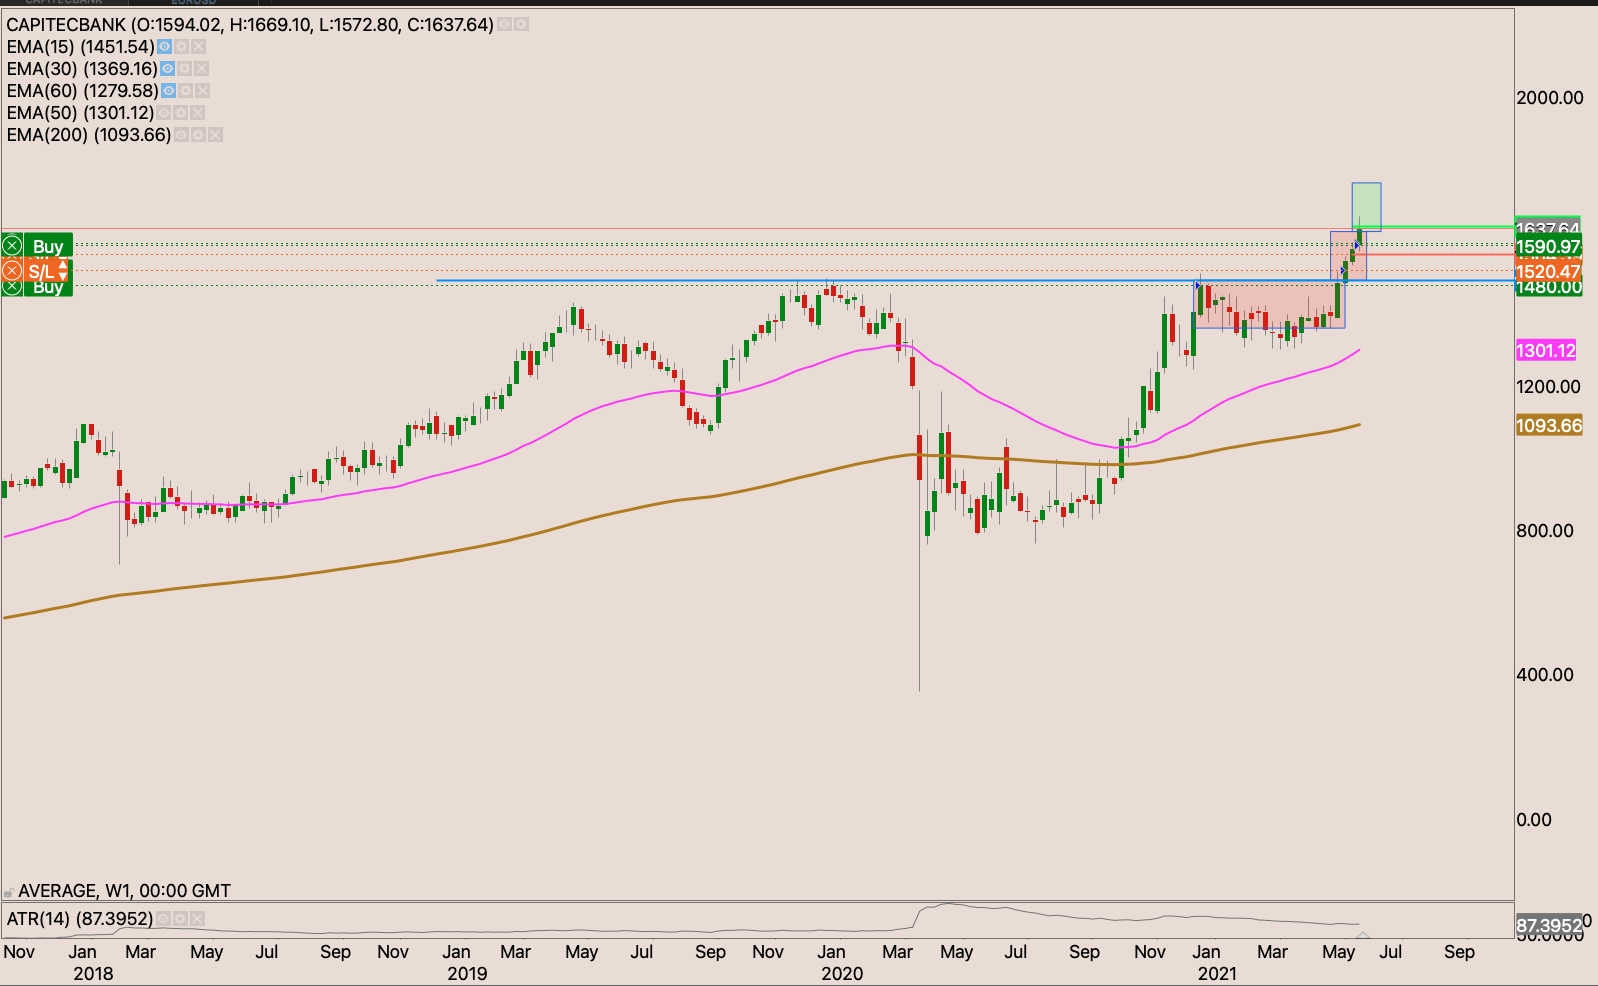
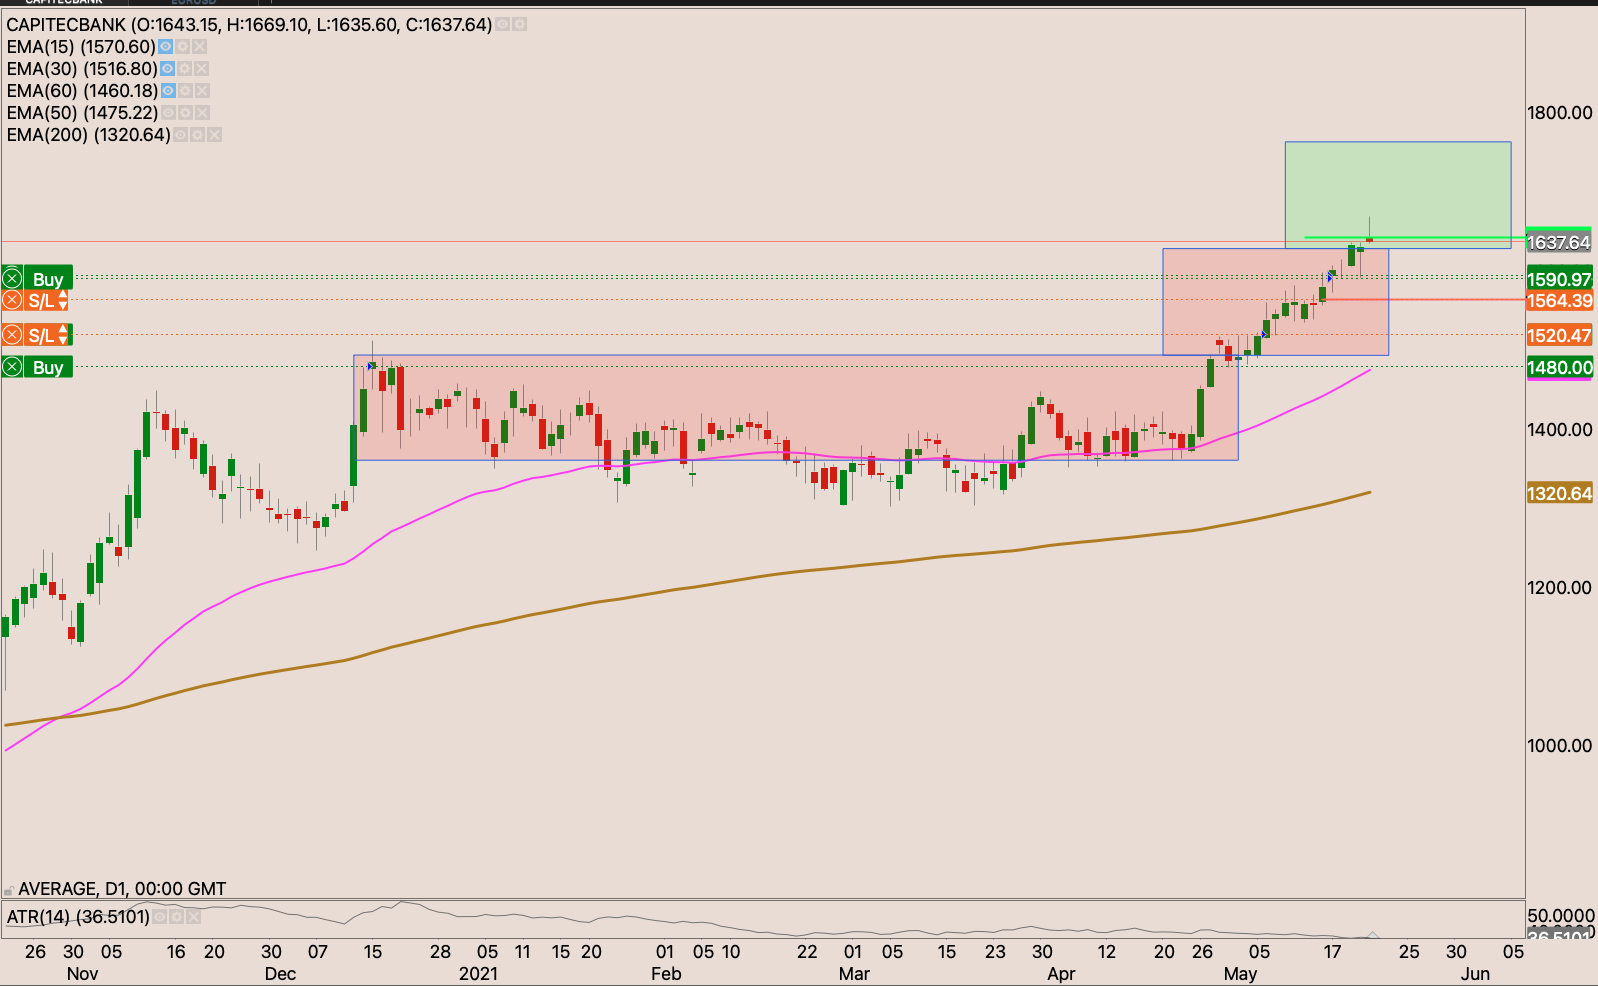
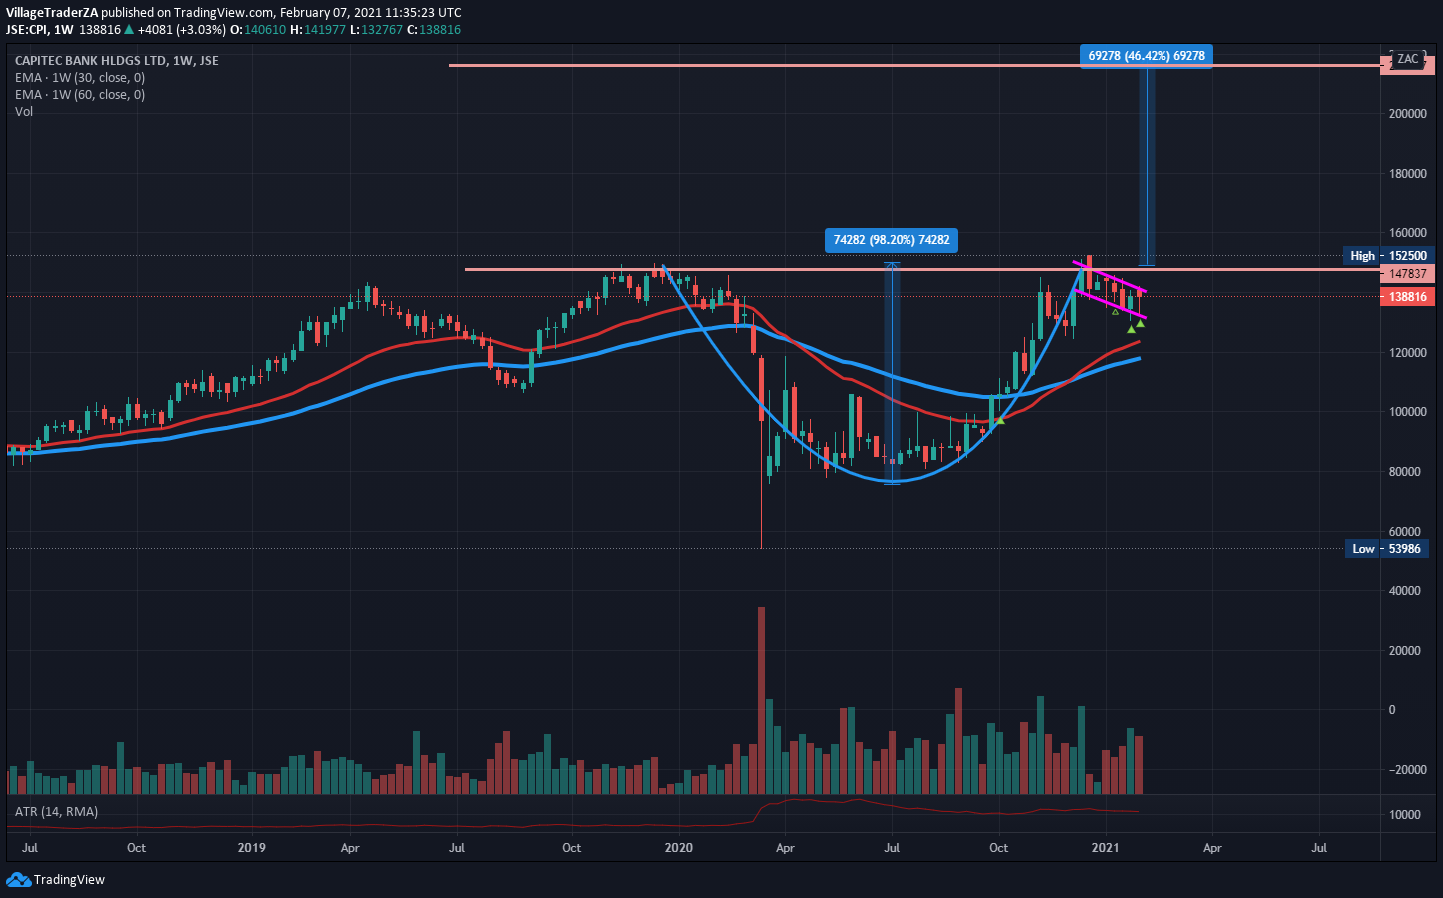
Capitec Bank (CPI)
The Chart is looking quite bullish. Still playing out the head and shoulders pattern.
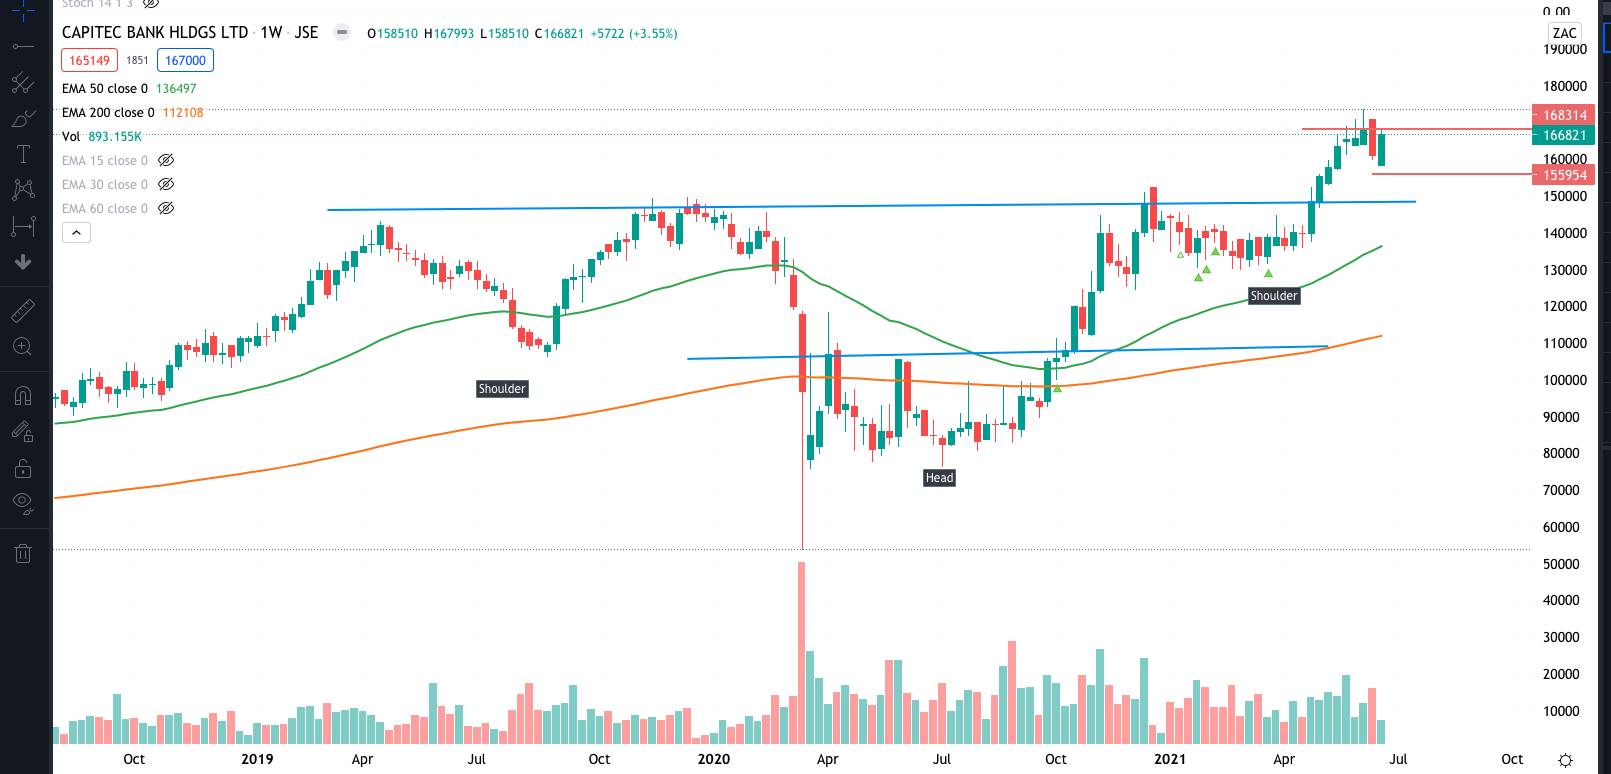
The stock was not spared in the recent sell off. Found support at the 50d EMA. If we get a close above R1682.25 I will buy the stock. With a stop loss just below the 50d EMA at R15595.59. On a new high close above R1731.15 I will then add to the position
_____________________________________________________________
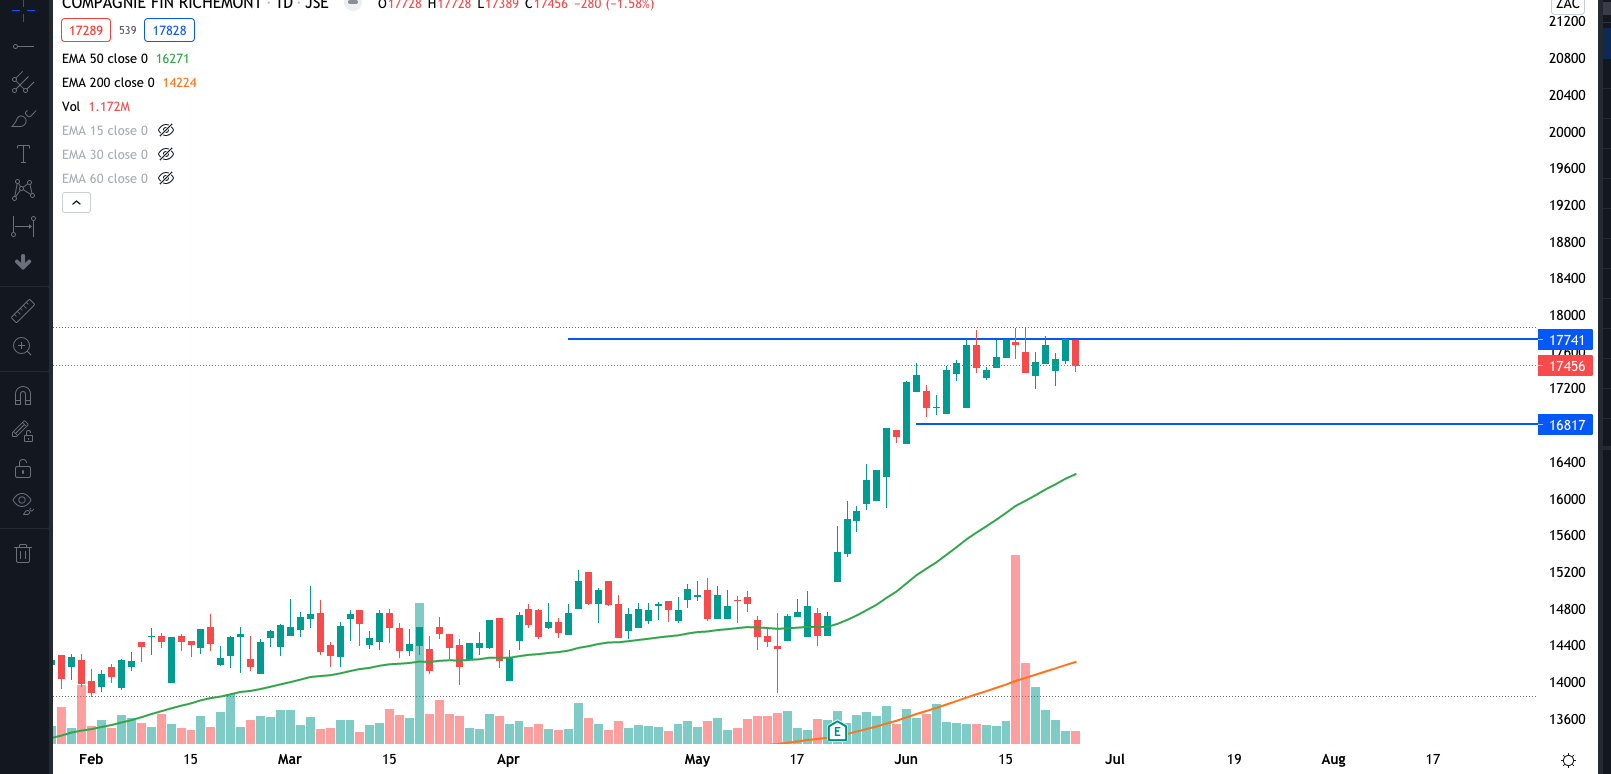
Richemont (CFR)
Stock is in a two week consolidation. I’m waiting for a break through R117.40 to add to the position. Volume decreased during this consolidation period. If volume can pick up on the break out. That will add to my conviction on the trade.
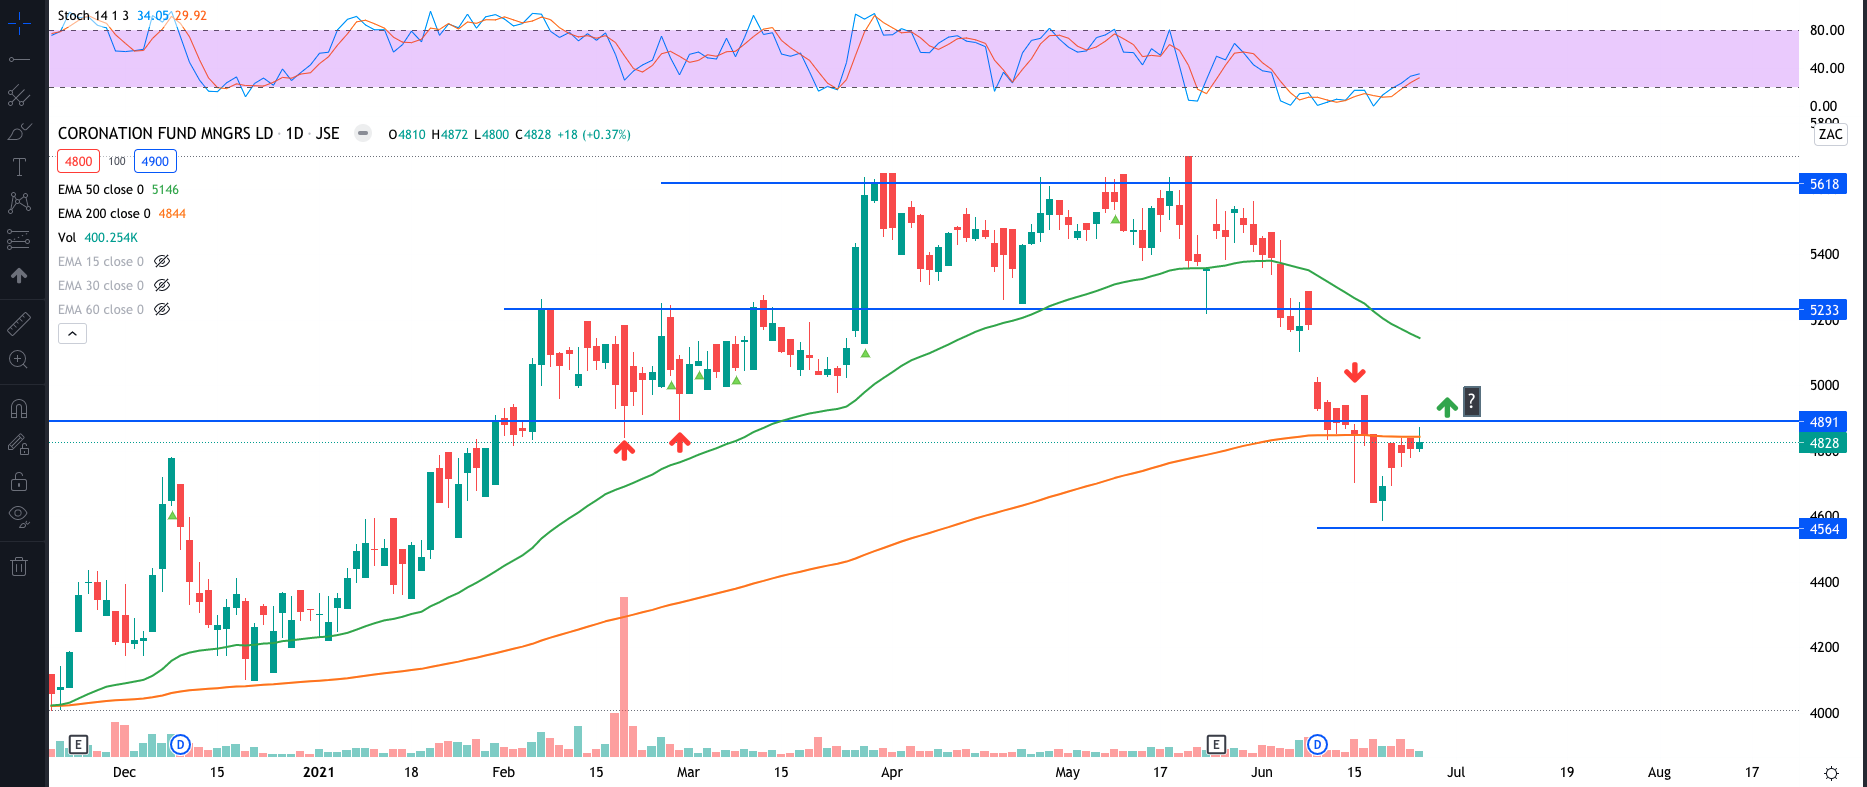
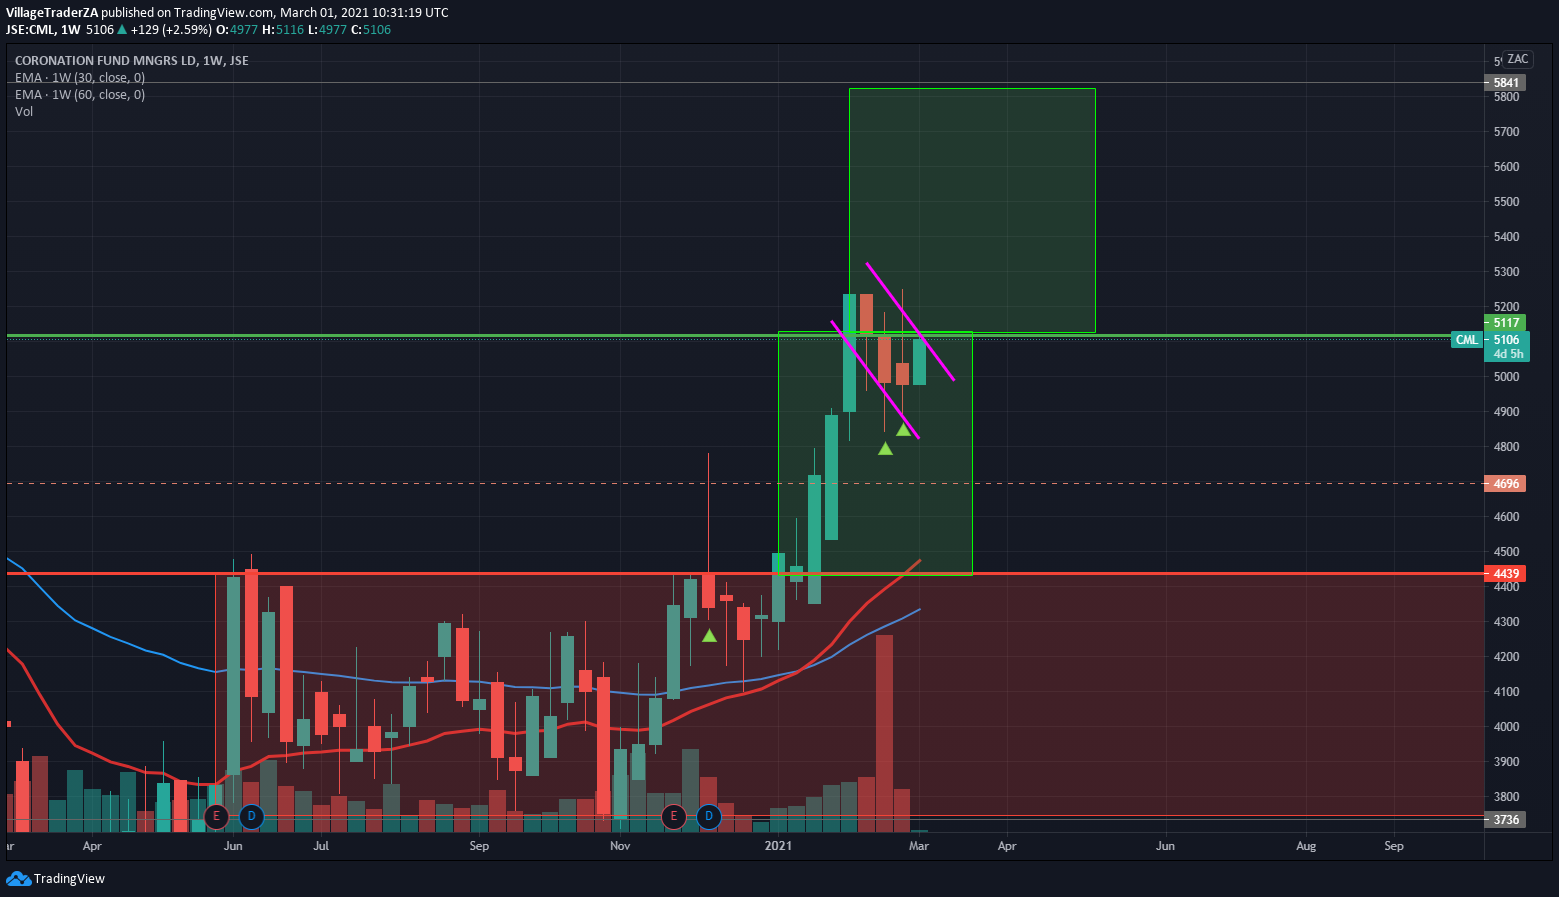
Coronation (CML)
The stock sold off sharply after paying a dividend. Went as far as closing below the 200d EMA and staying below it the whole week. There some support/resistance at R48.90. If the stock can win the 200d EMA battle. I have 3 buy spots on the stock. A close above R48.90, a close above R52.33 and lastly a close above R56.18. Trailing my stop behind me of cause, but to start my stop will just below the swing low and 200d EMA at R45.64
_____________________________________________________________
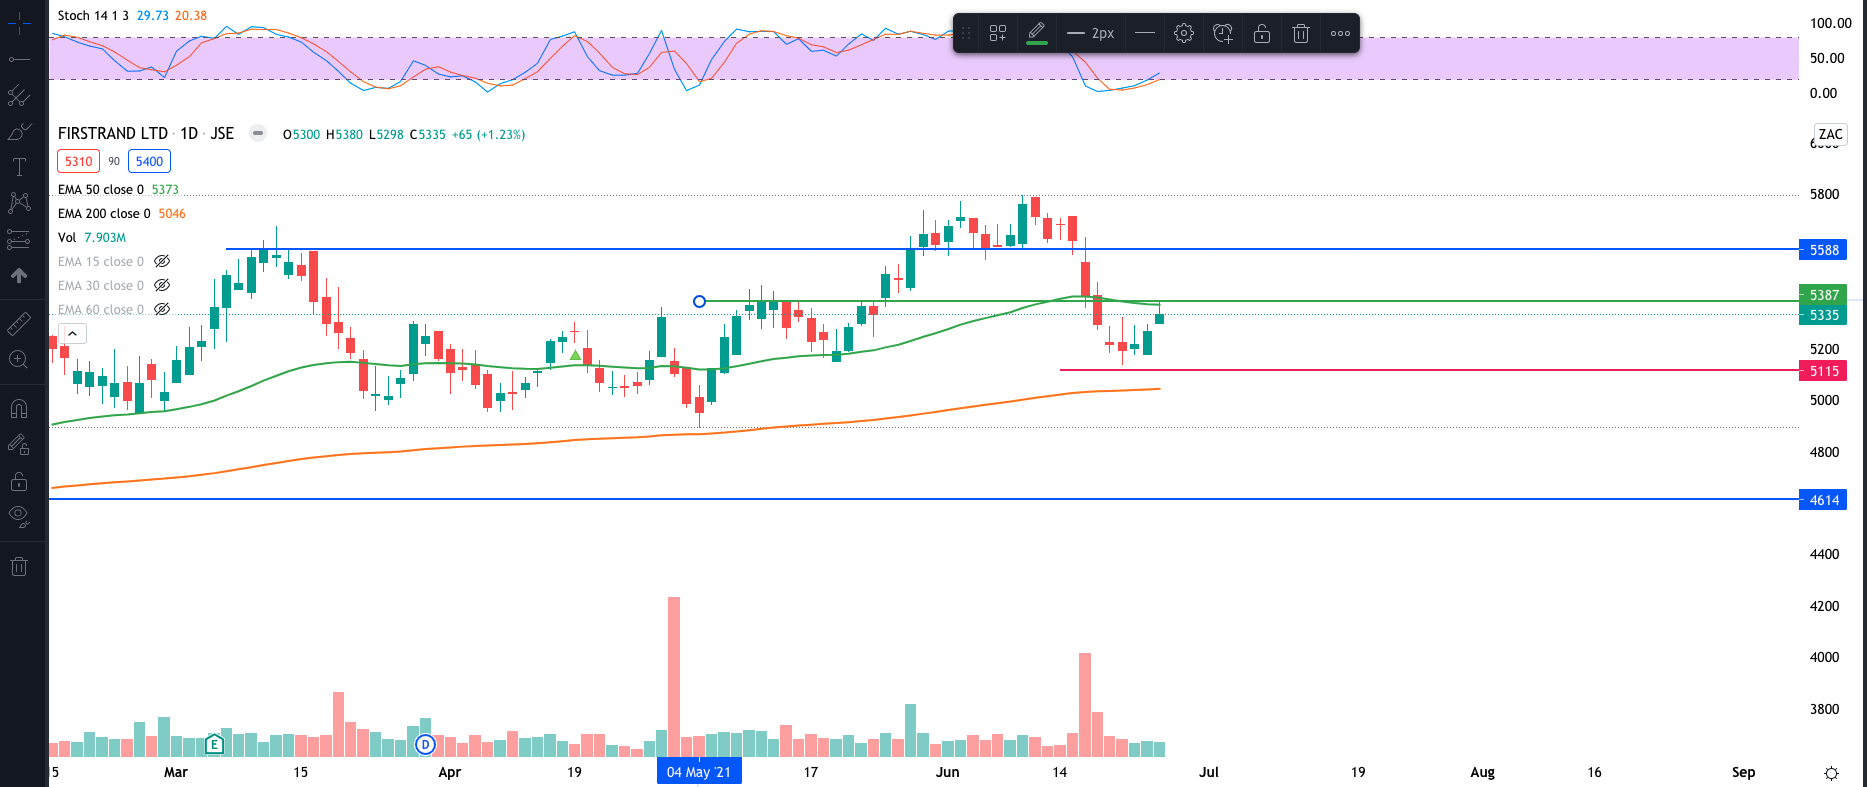
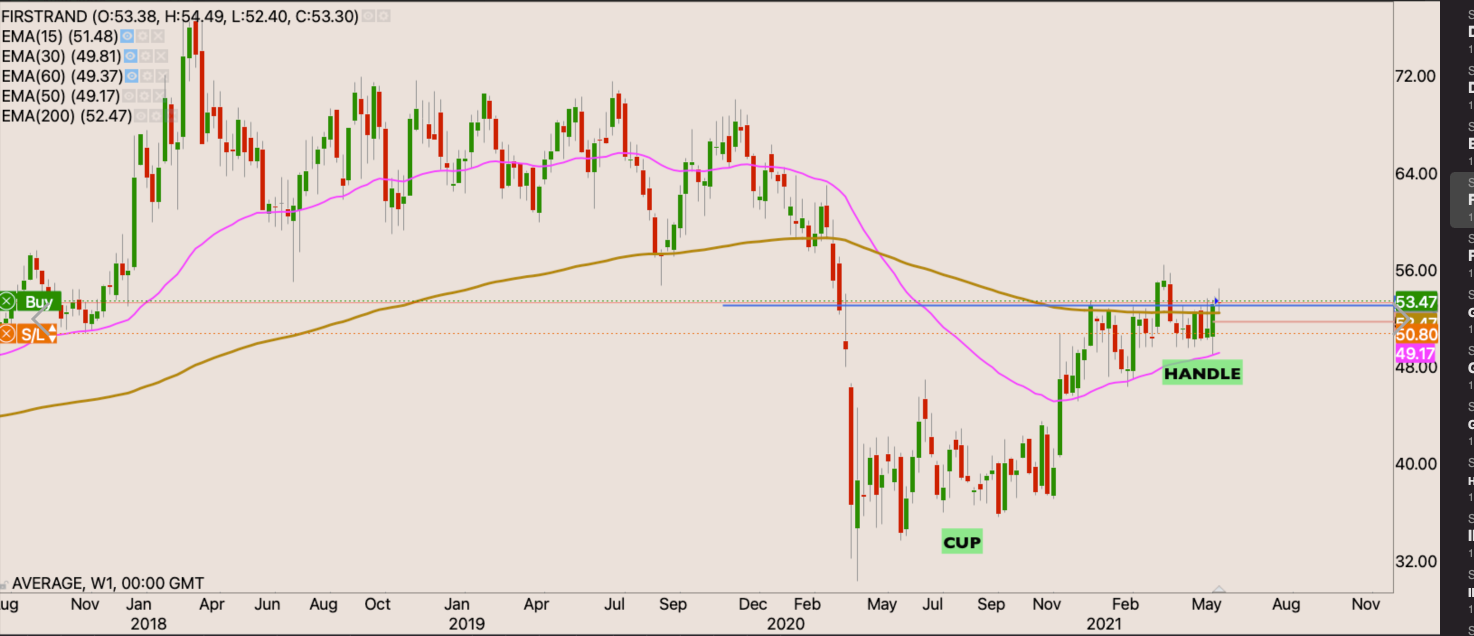
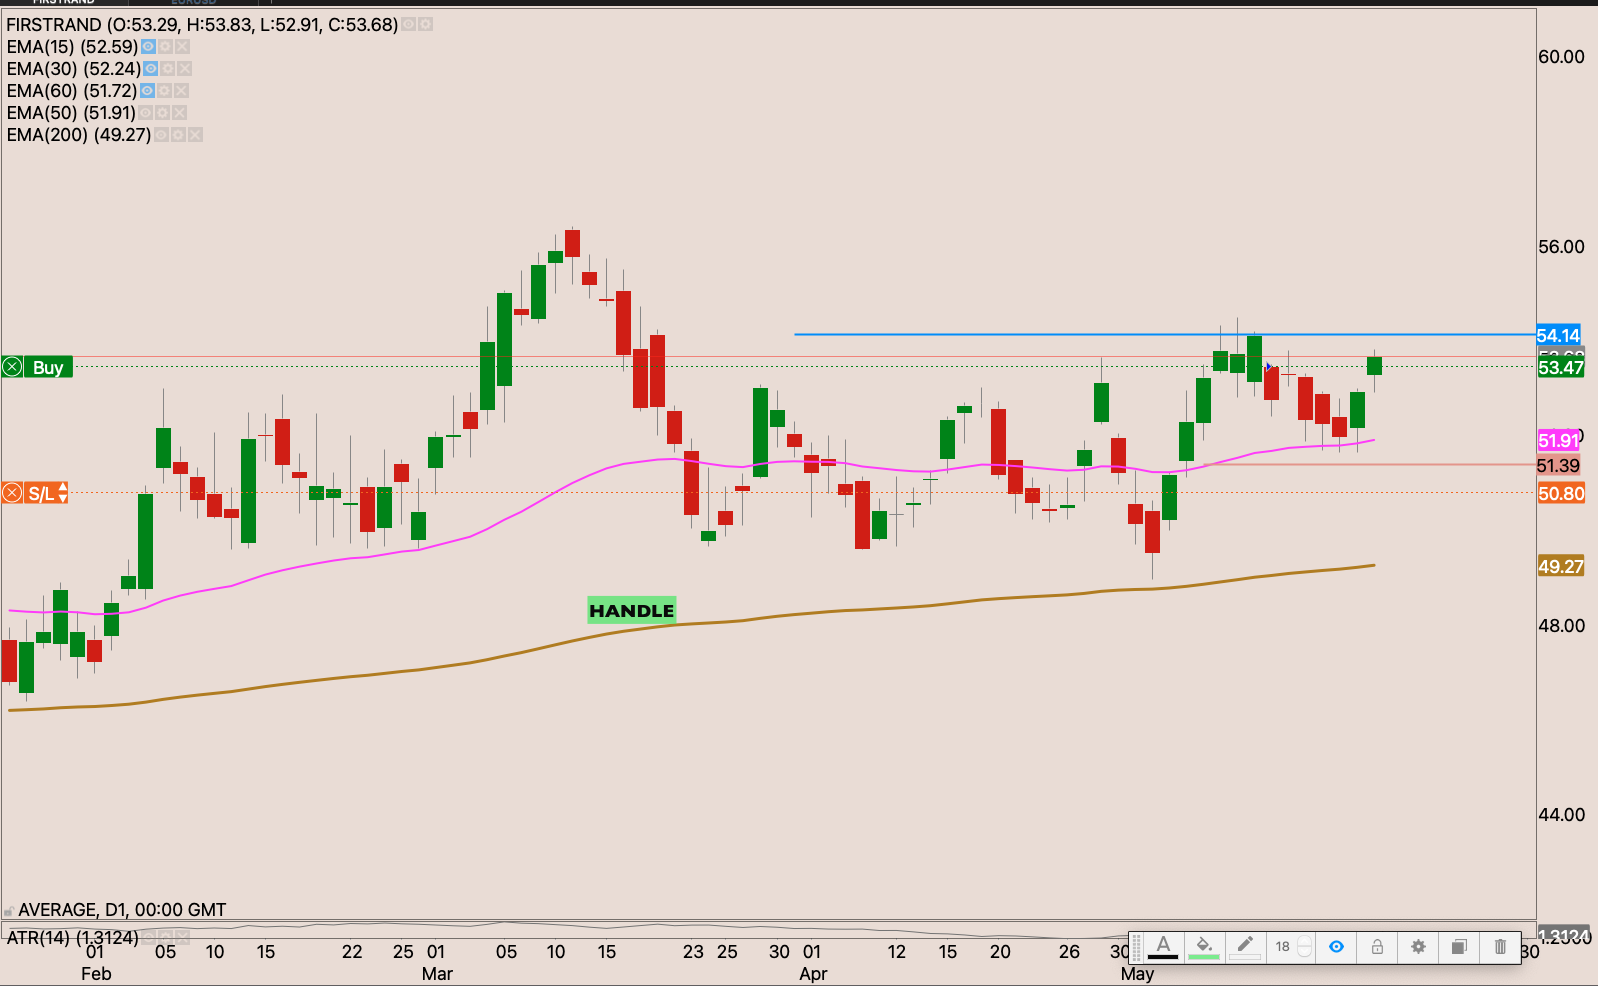
Firstrand (FSR)
Banks technical picture looks quite strong, Firstrand is no exception. We had a nice bullish flag close to the 200d EMA. Now waiting to see how the stock deals with the 50d EMA. If we get a close above R53.87 I will buy with a stop loss at R51.10
_____________________________________________________________
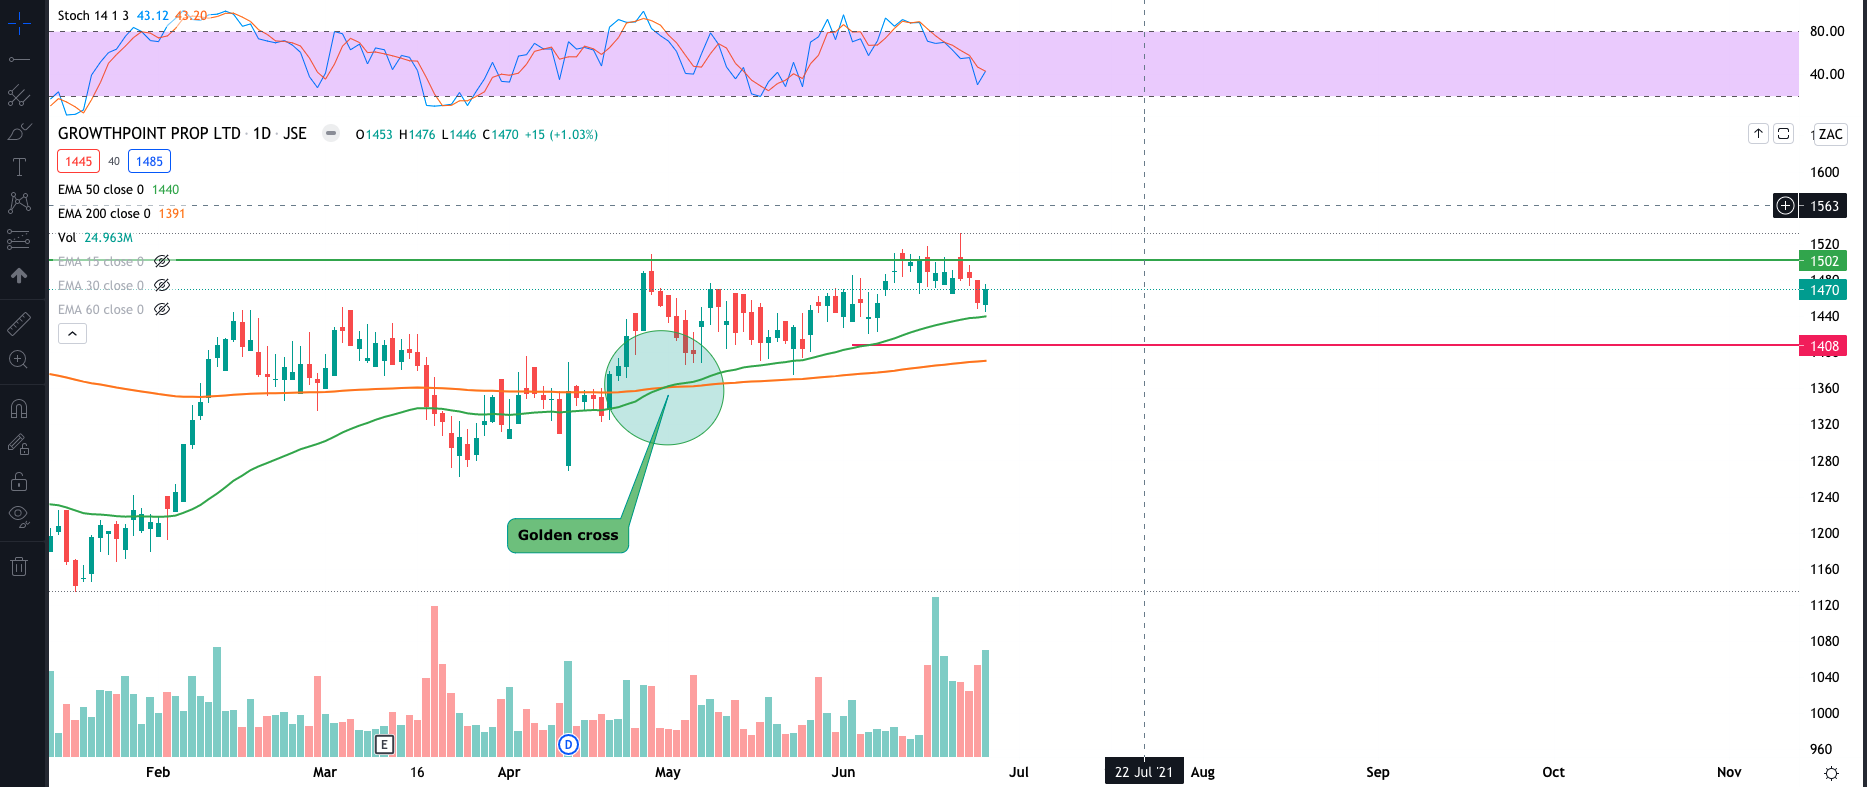
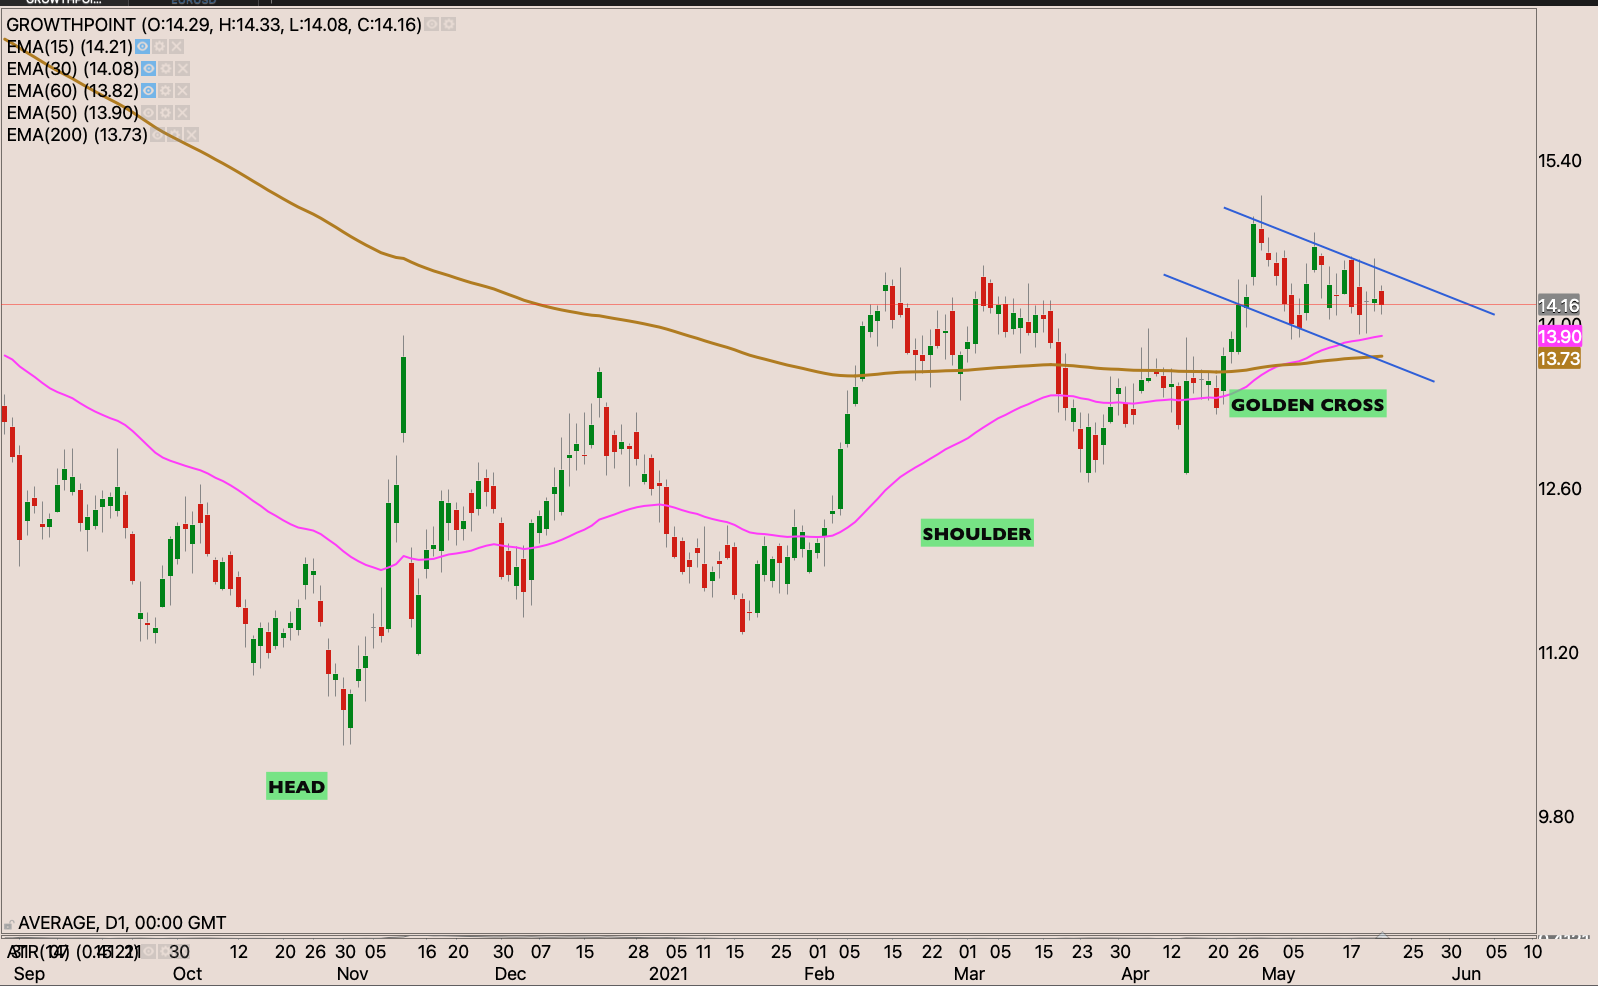
Growthpoint (GRT)
We had a golden cross on the stock a few weeks ago. As the stock seems to lead the recovery of the property stocks. Property stocks were amongst the most hit in the COVID-19 crash. Again took the longest to initiate recovery. I suppose uncertainty around dividends from REITs, in light of the COVID-19 lockdowns impact on the companies. Makes it hard for investors to have conviction in the companies.
After the golden cross the stock rallied and pulled back, each time staying above the 50d EMA forming rising bottoms. I’m waiting for a close above R15, and I’ll add to my position on the stock. This picture may be turned on its head after the President moved us to level 4 lockdown.
_____________________________________________________________
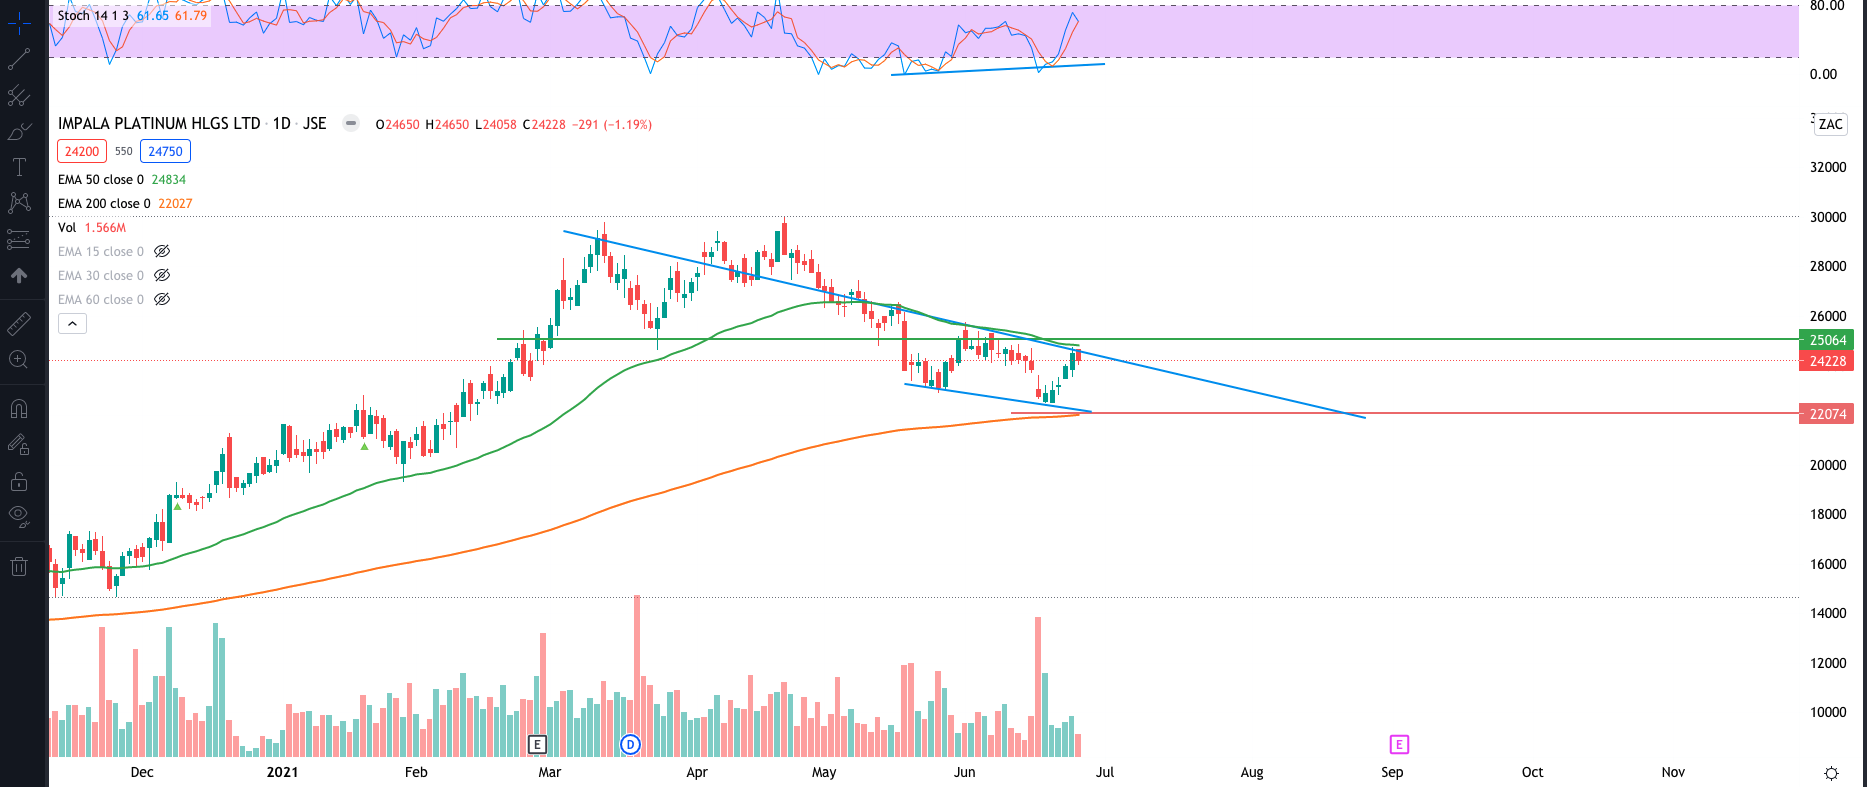
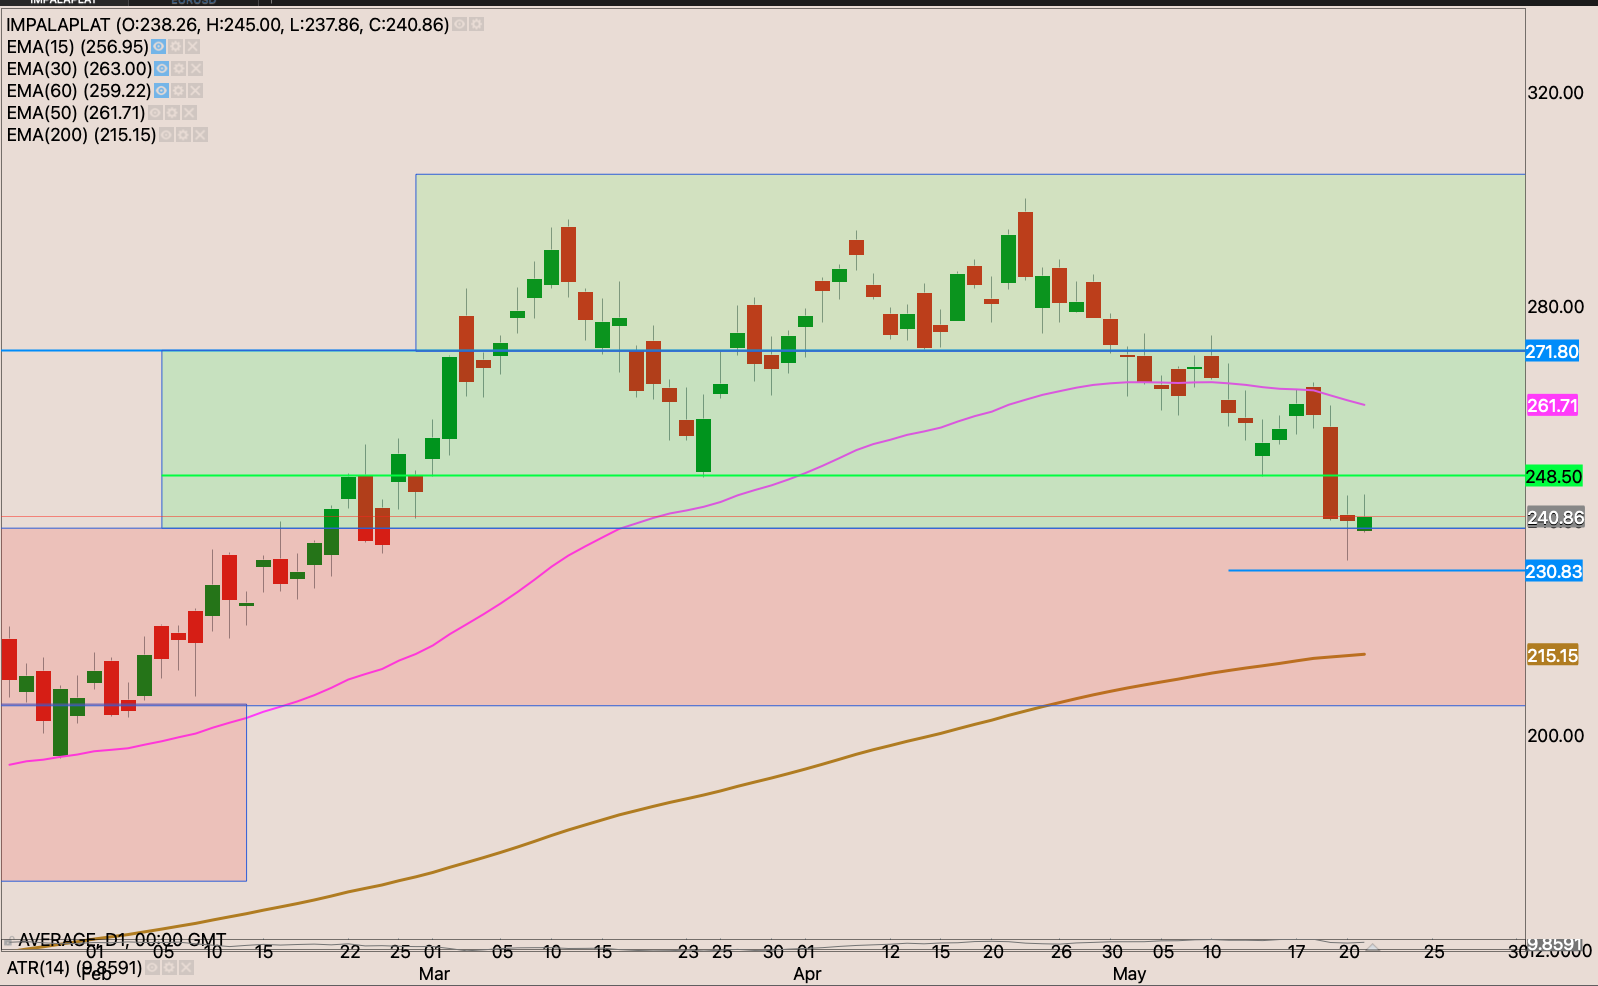
Impala Platinum (IMP)
Saved by the 200d EMA. The stock looked like it was on a free fall. As resources stocks were getting hammered. The stock found some support in the 200d EMA. Add to that a bullish divergence. The stock making lower lows, and the oscillator making a higher low. Now I’m waiting for a close above R250.65 to buy the stock with a stop loss at R220.75
_____________________________________________________________
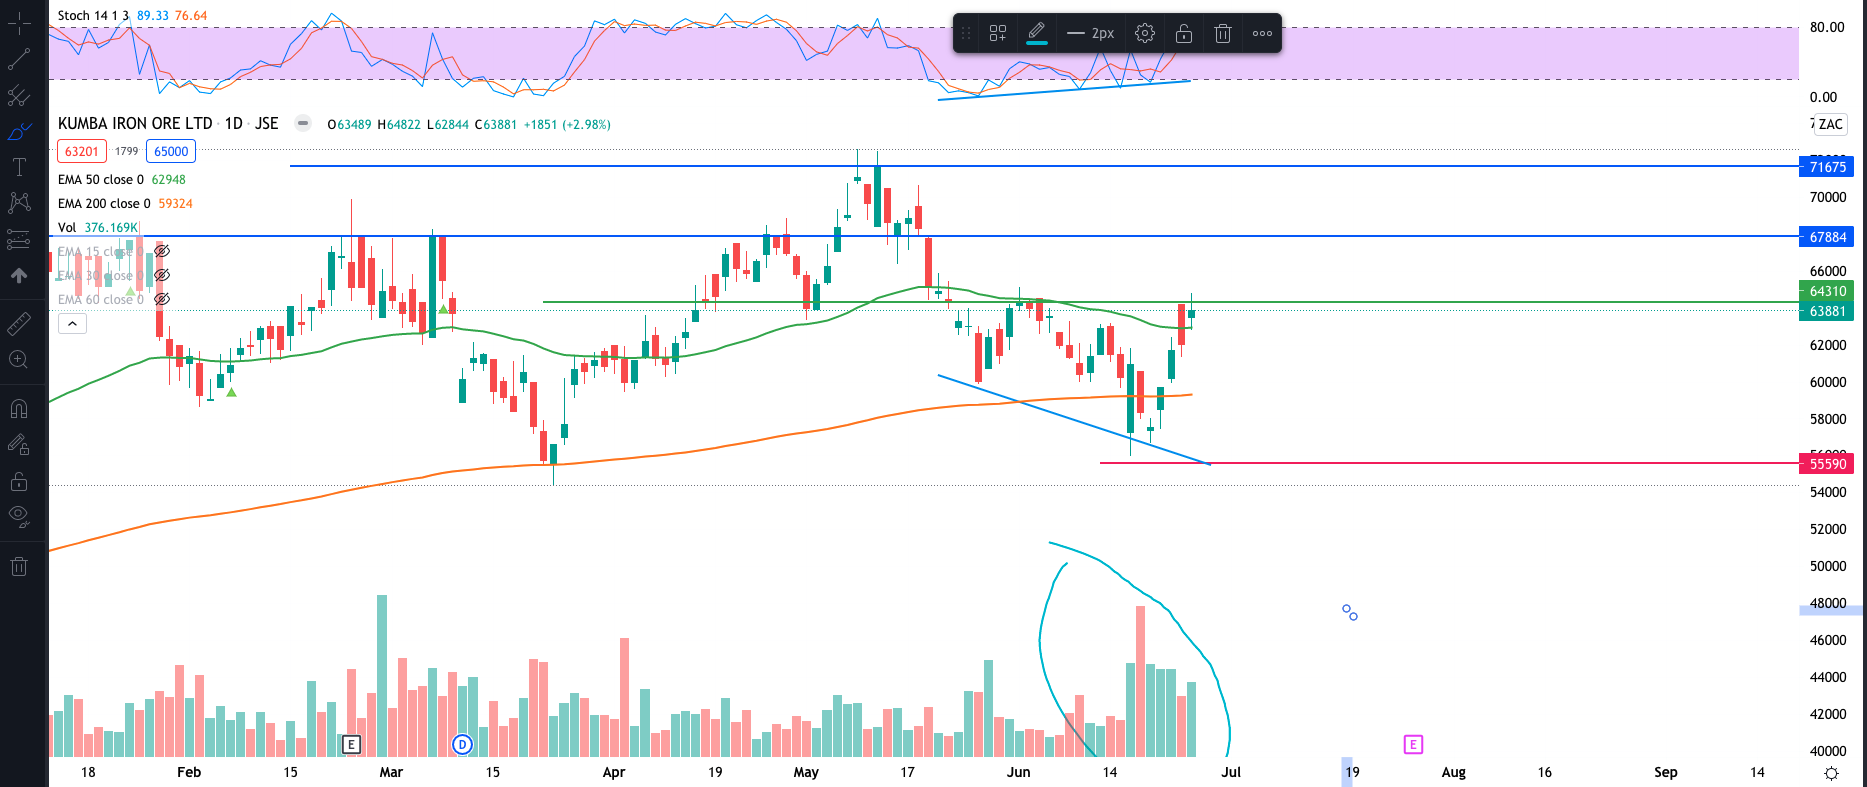
Kumba Iron Ore (KIO)
Nice bullish divergence pattern on increased volume as the stock holds the 200d EMA support. Now I’m waiting for a close above R638.80 I will buy the stock with a stop loss just below the 200d EMA at R555.90
Stocks in play – 23 May 2021
Absa (ABG)
| Absa (ABG) – 23 ayM 2021 | ||
| Time frame/ Date | comment | Chart |
Weekly chart view |
We have a nice cup and handle pattern on the stock. The stock holding above the 50w EMA. | 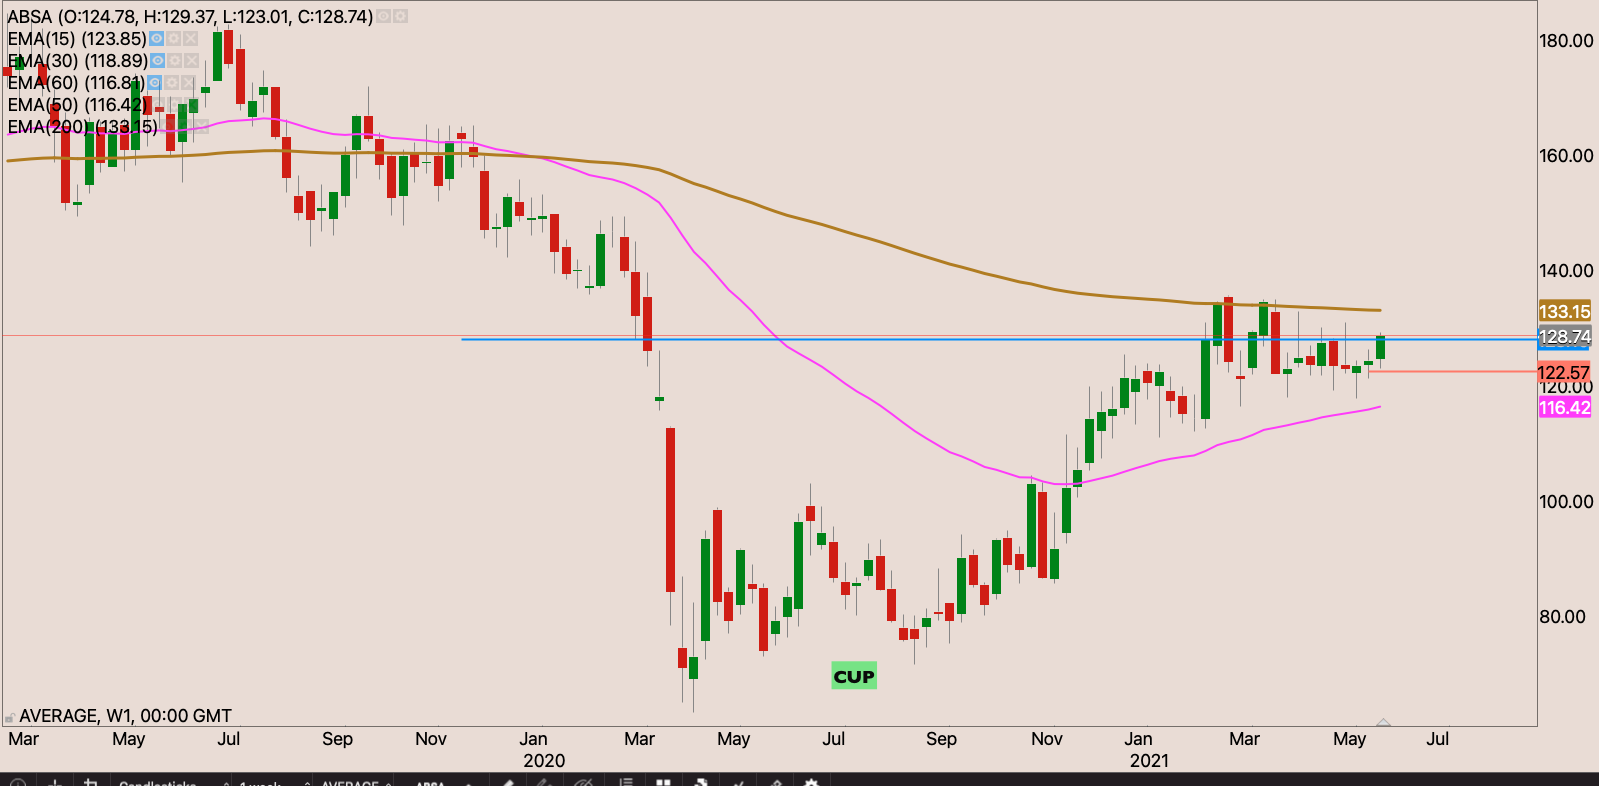 |
Daily chart –
|
The stock closed at R128.74. Triggering a buy with a stop loss at R122.50. This coincided with a symmetrical triangle breakout | 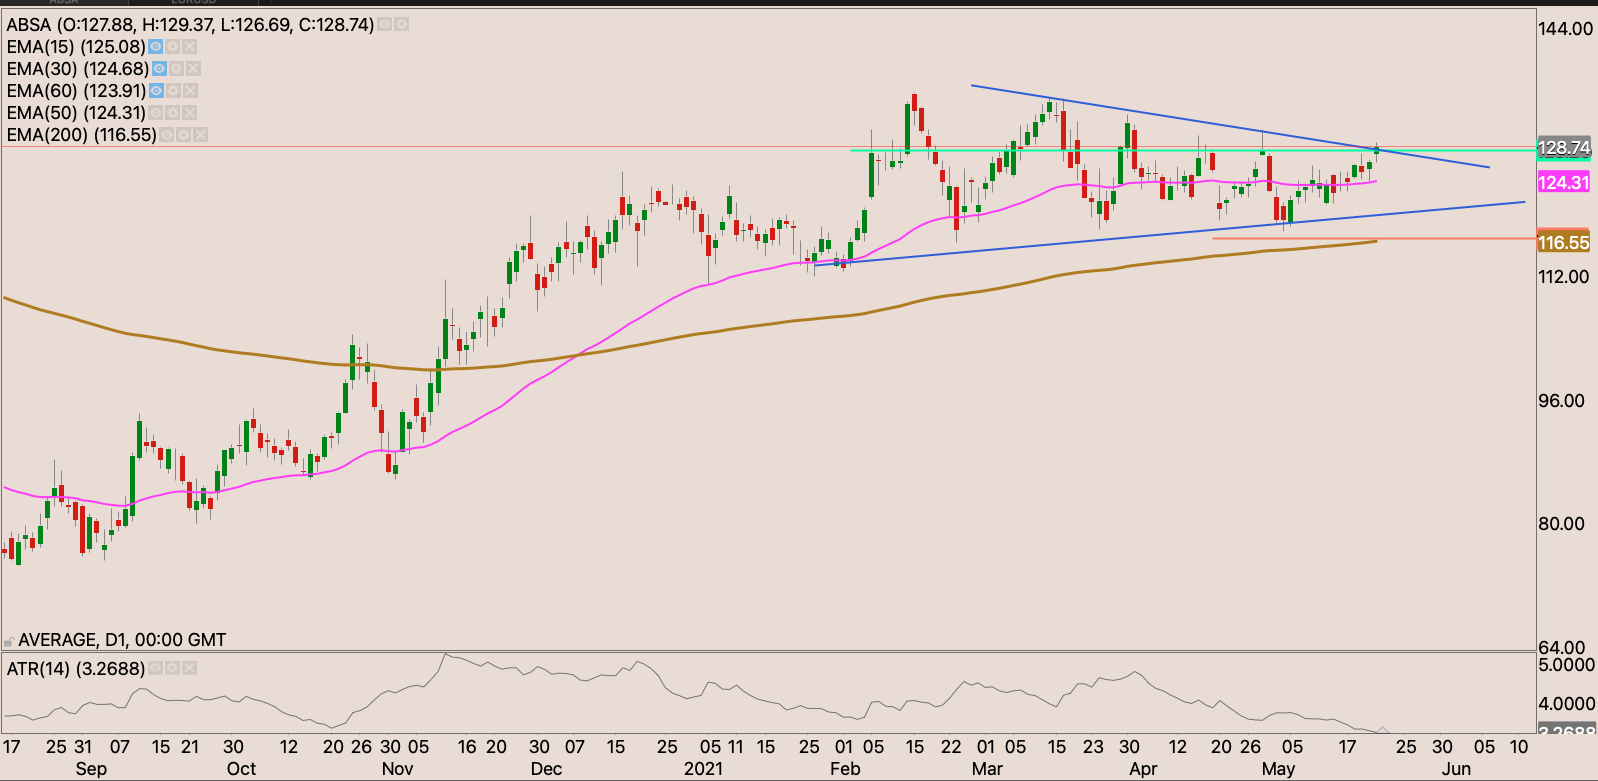 |
Anheusergbusch
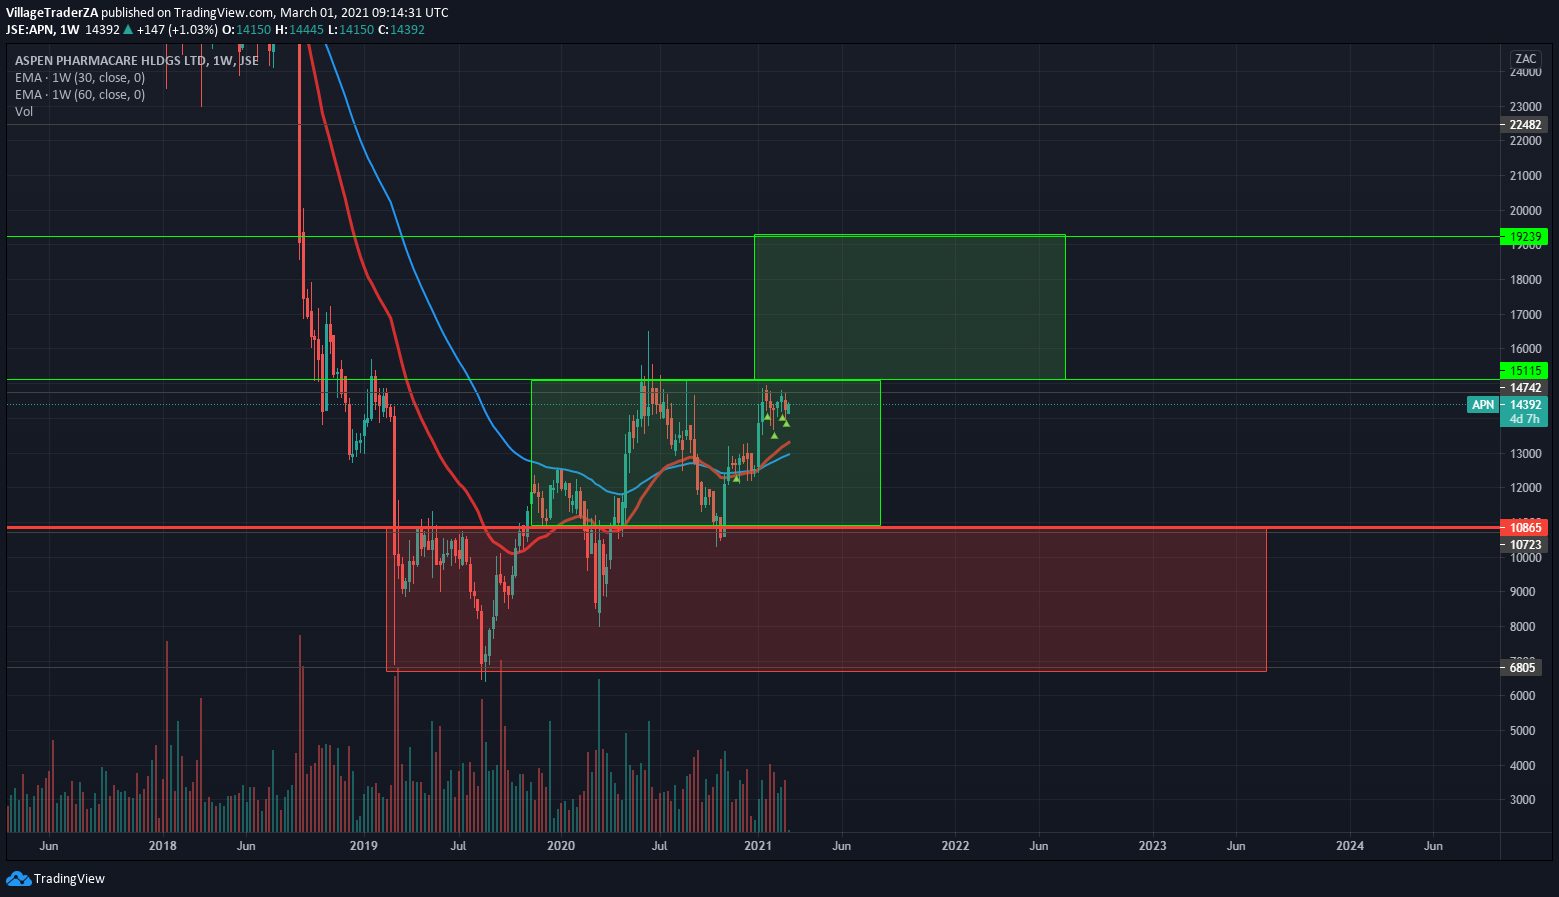
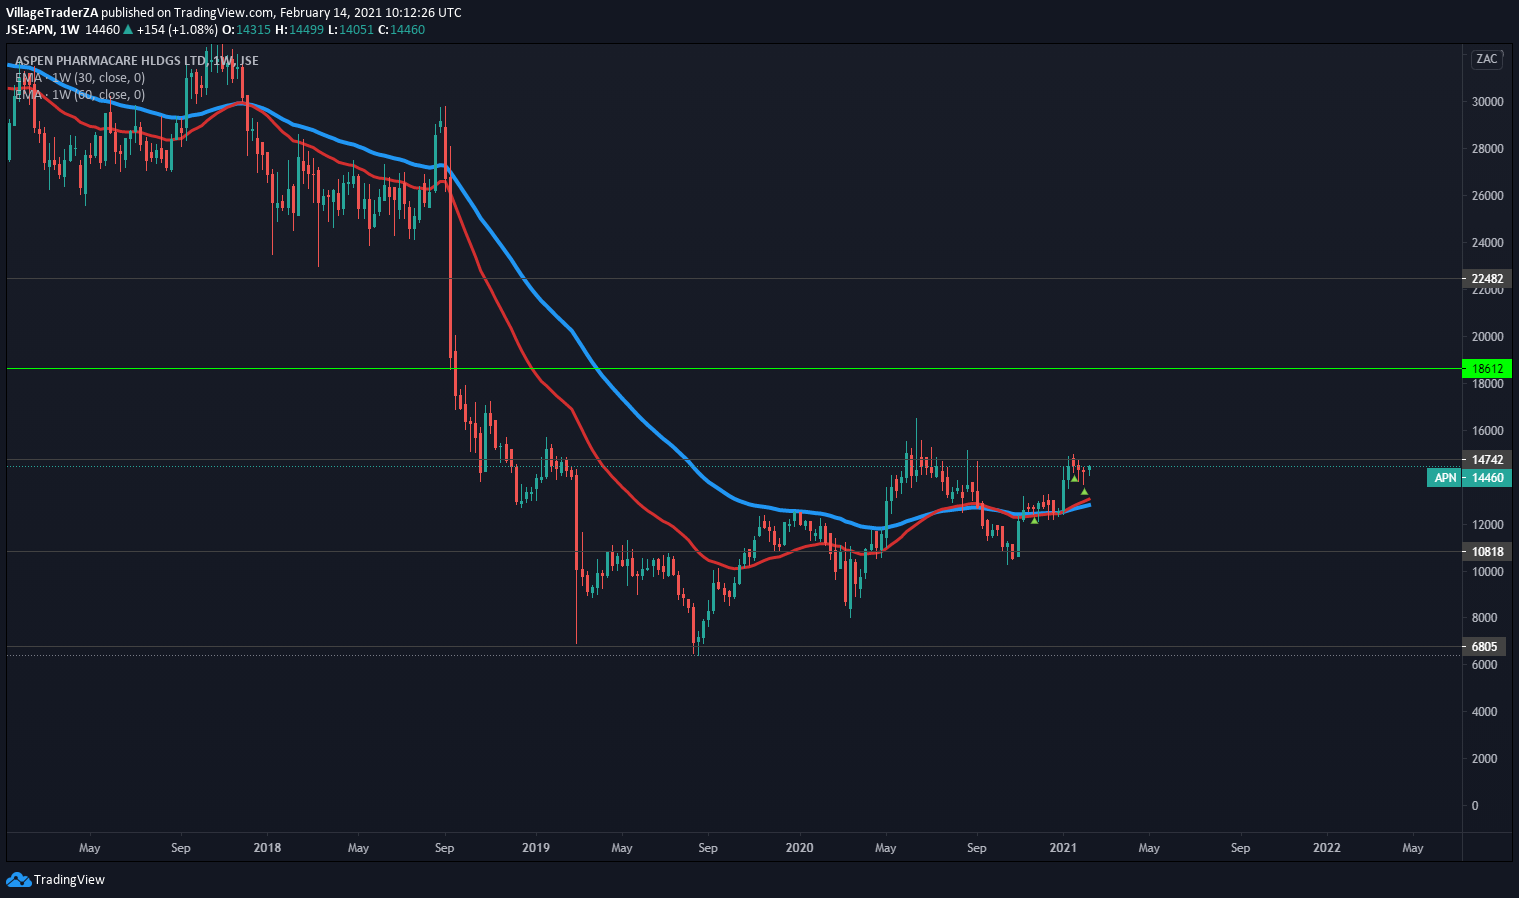
Aspen (APN)

Barloworld

Bidcorp
Bidvest
Capitec Bank
Richemont
| Richemont (CFR) | ||
| Time frame/ Date | comment | Chart |
| Weekly chart | – | |
Daily chart |
The Gapped sharply and closed at R153.99. I will buy the stock market open Monday. | 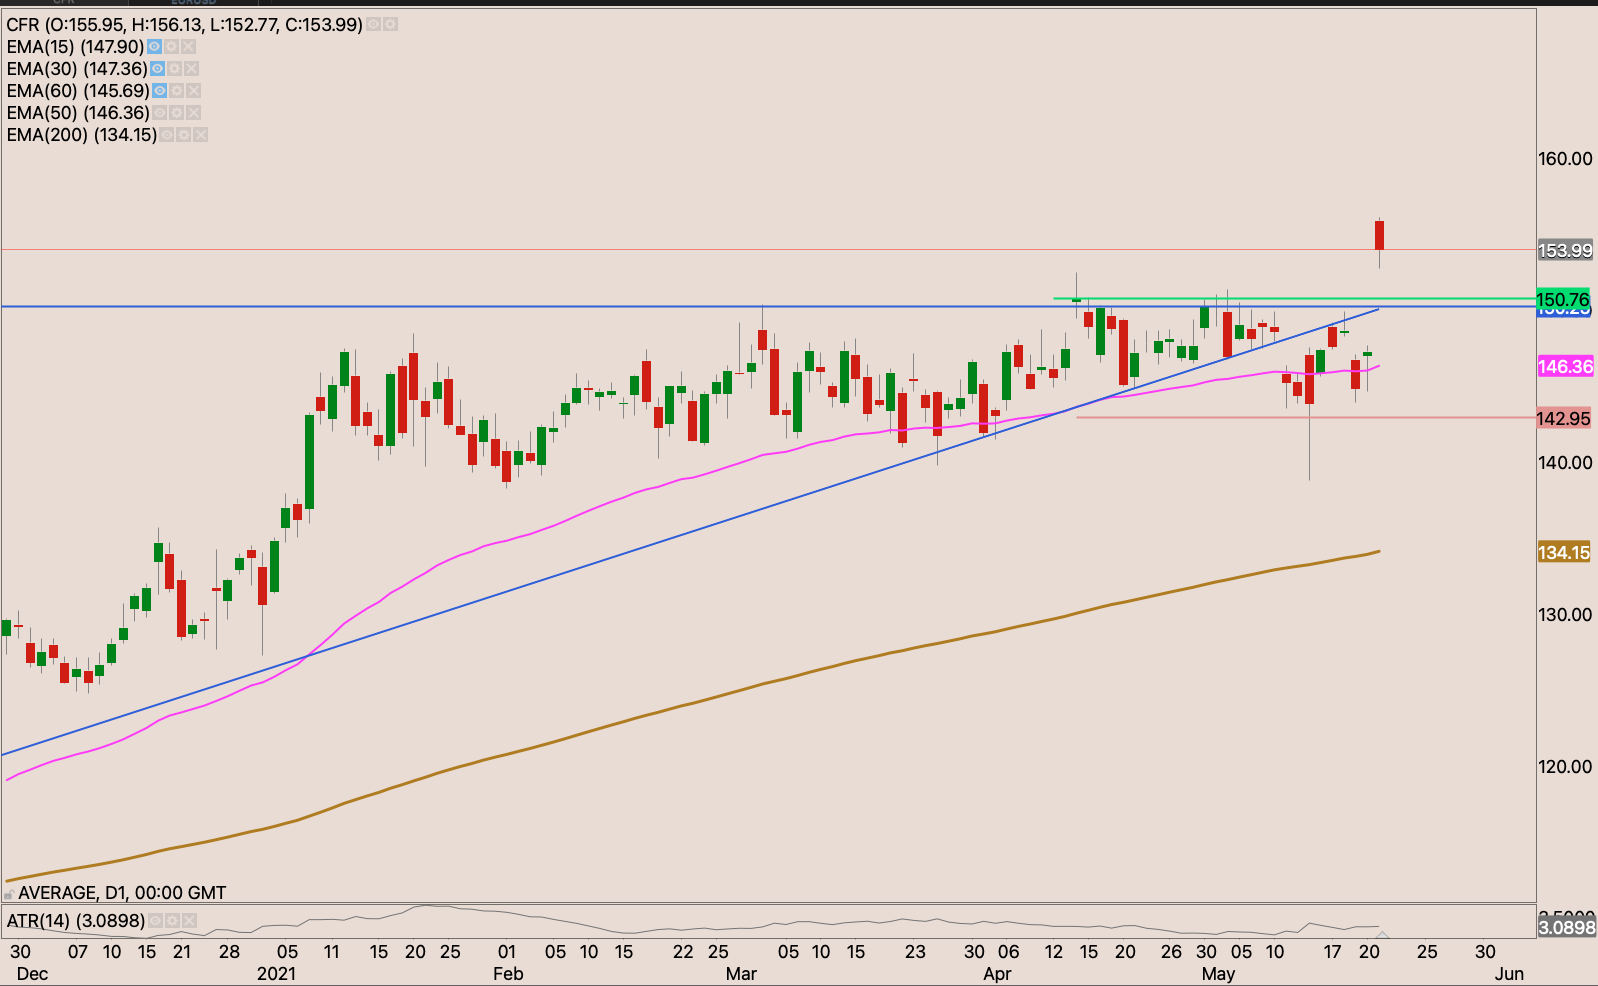 |
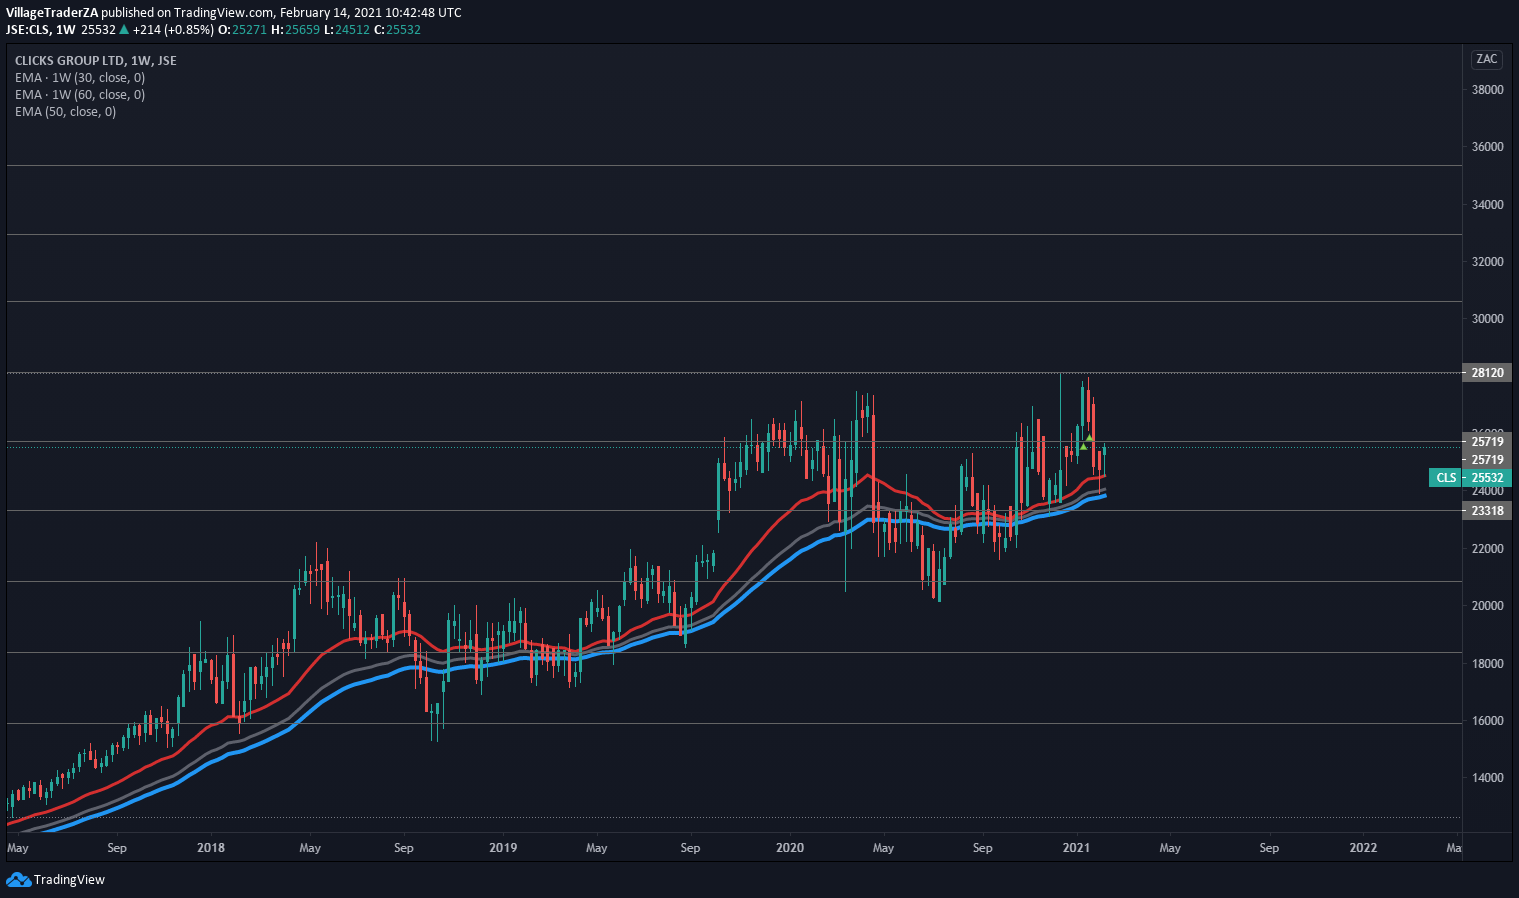
Clicks
Coronation

Dischem


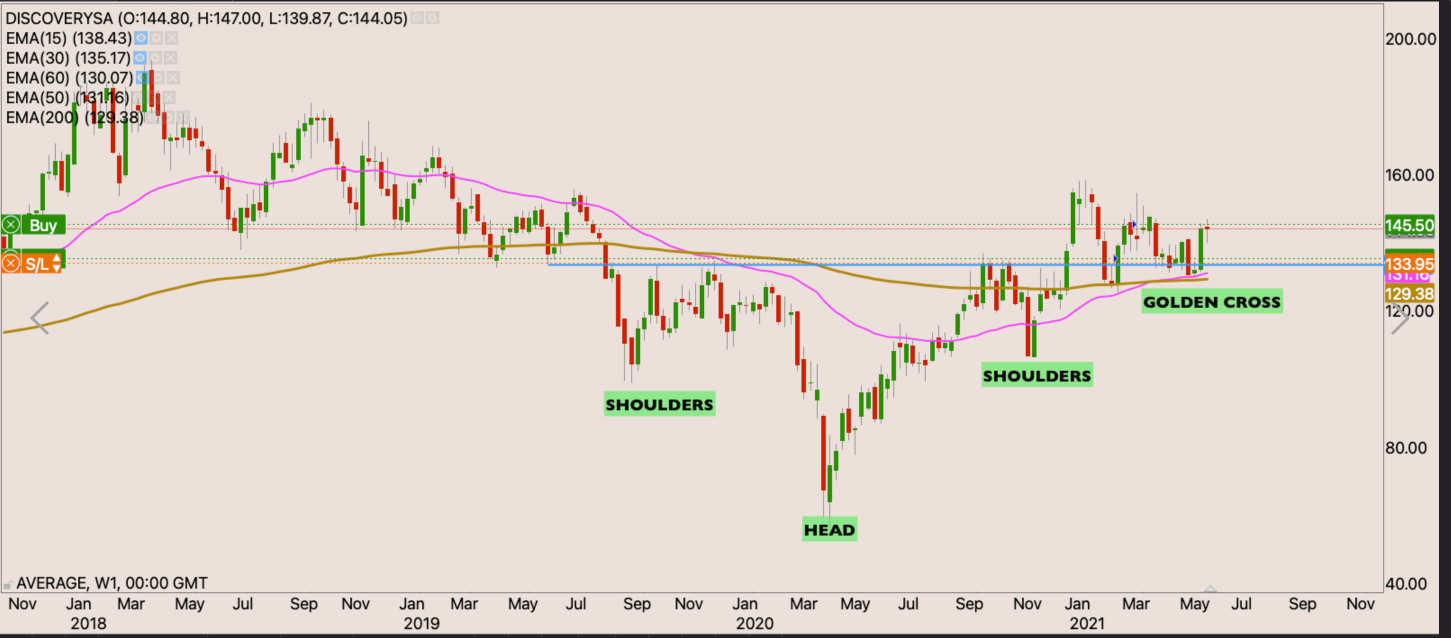
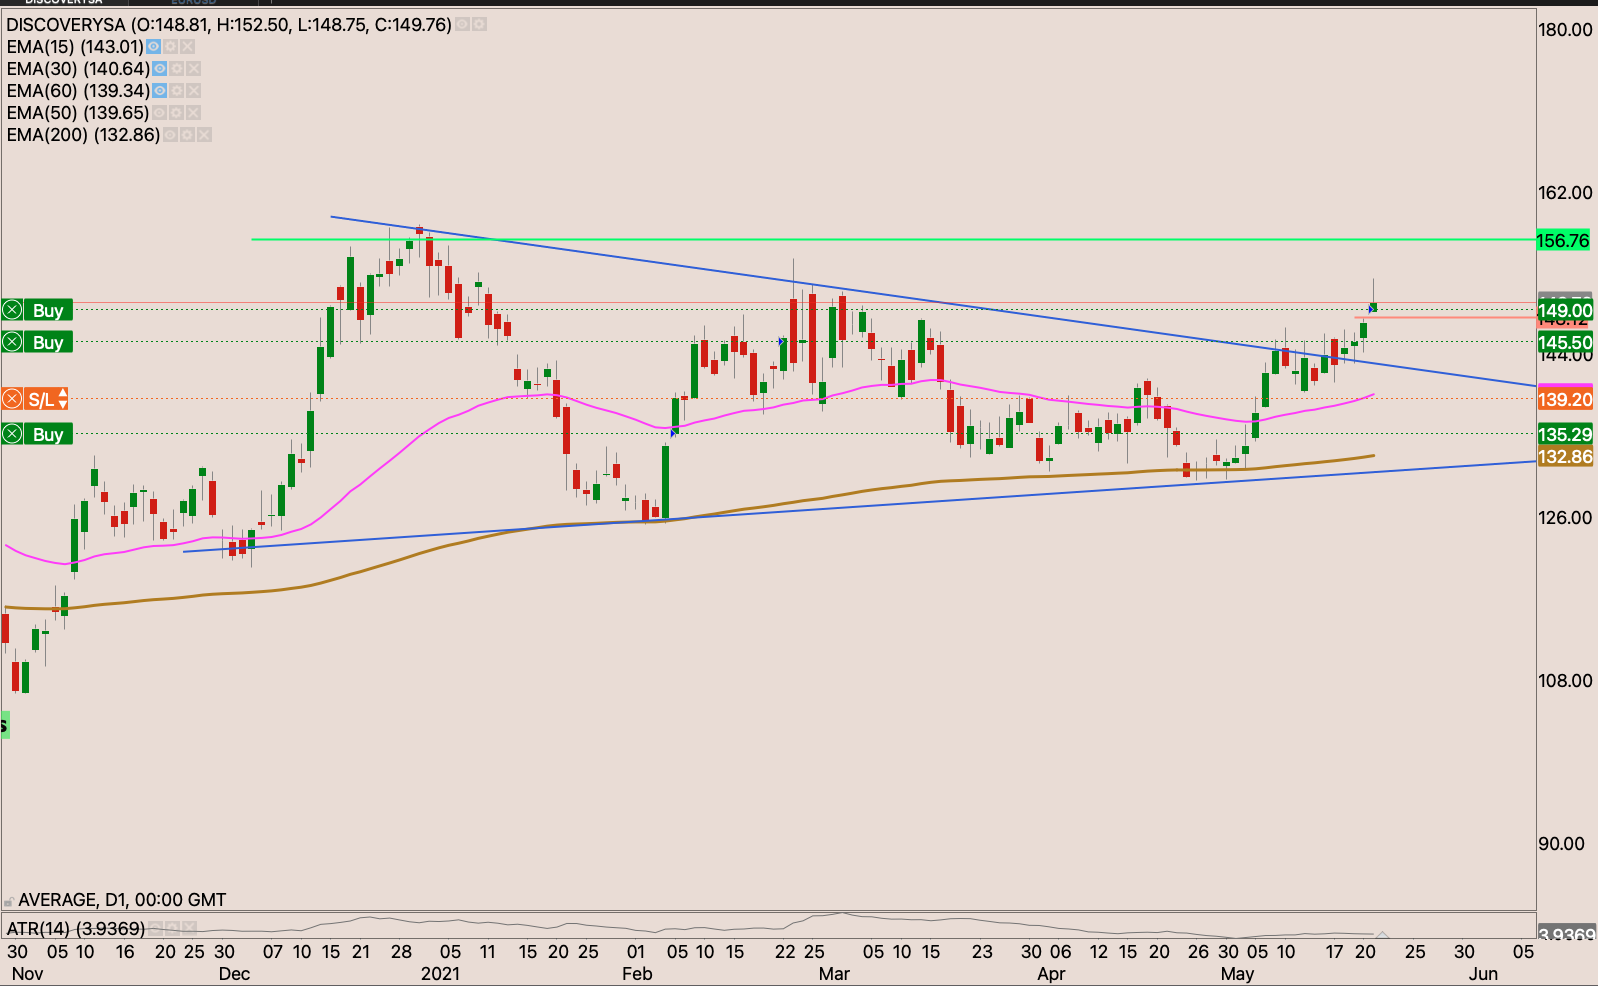
Discovery
Distell

Firstrand
Foschini

Glencore
Growthpoint

Impala Platinum

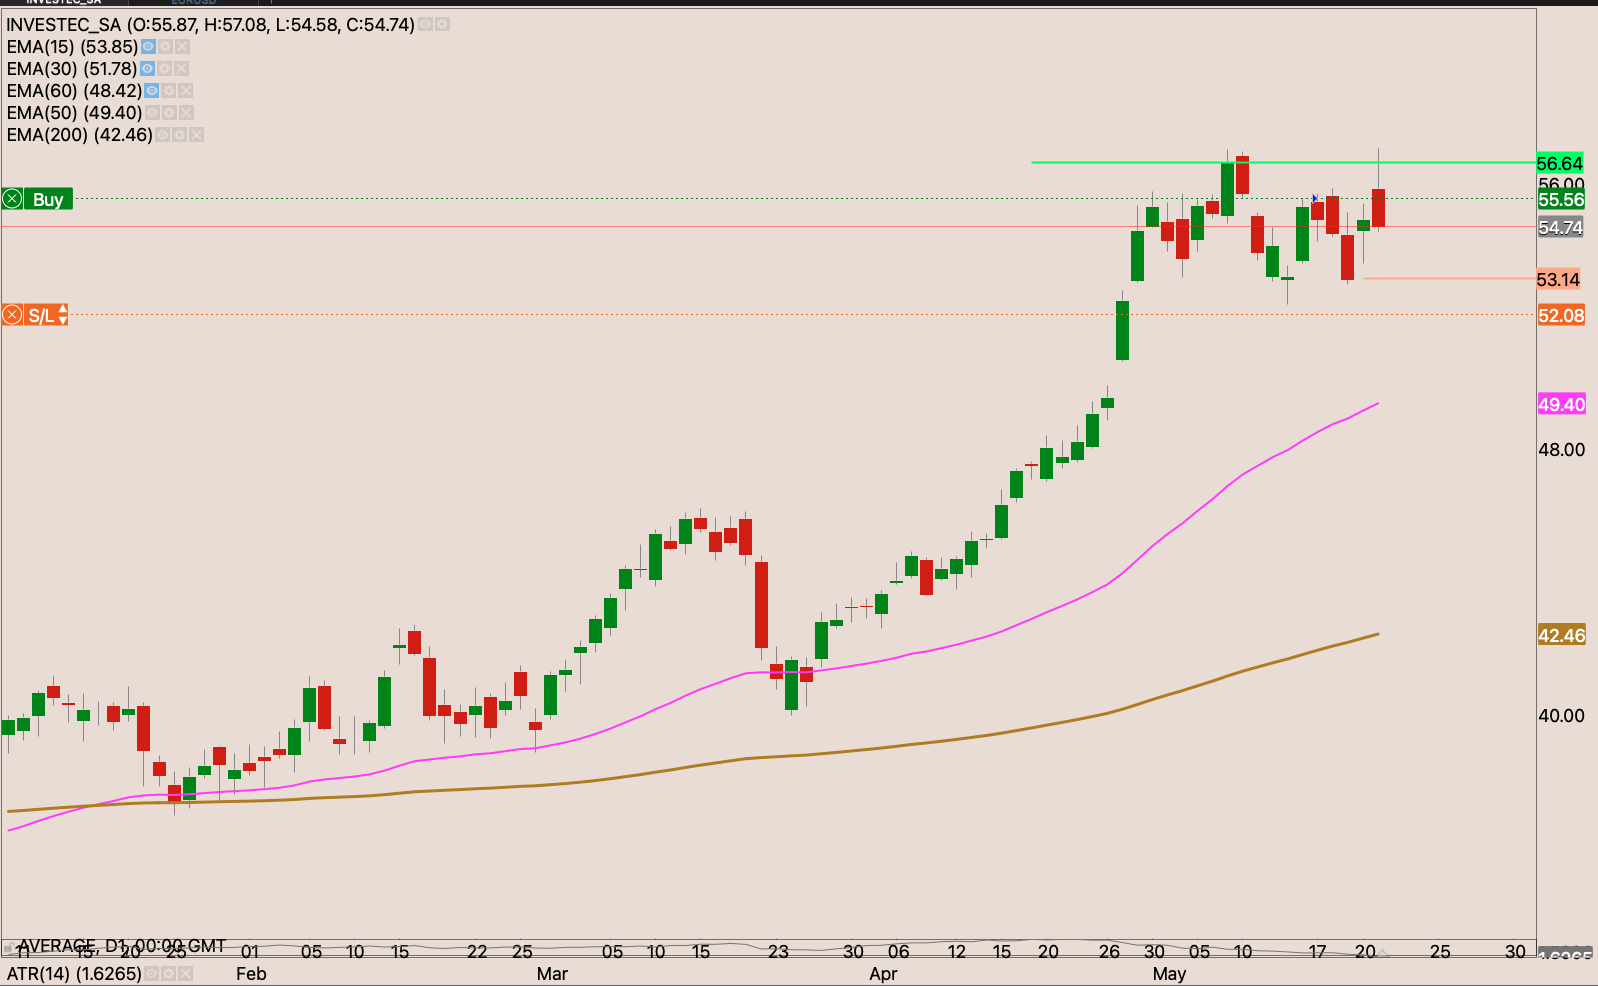
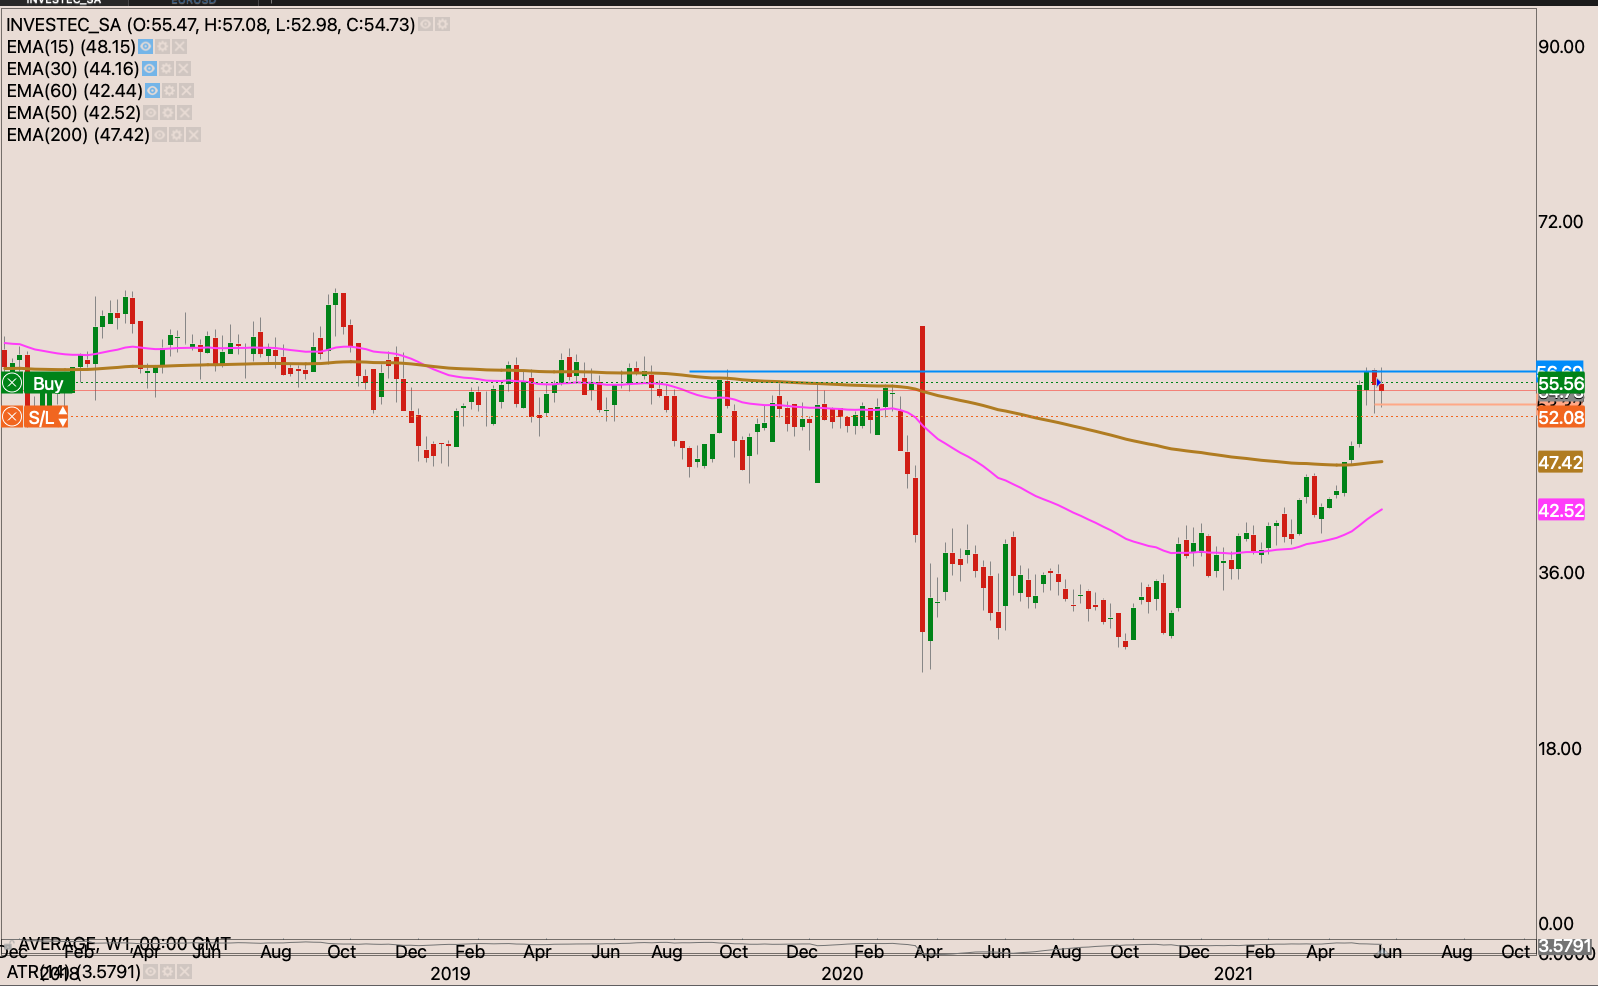
Investec
Kumba (KIO)

Life Health care


Netcare


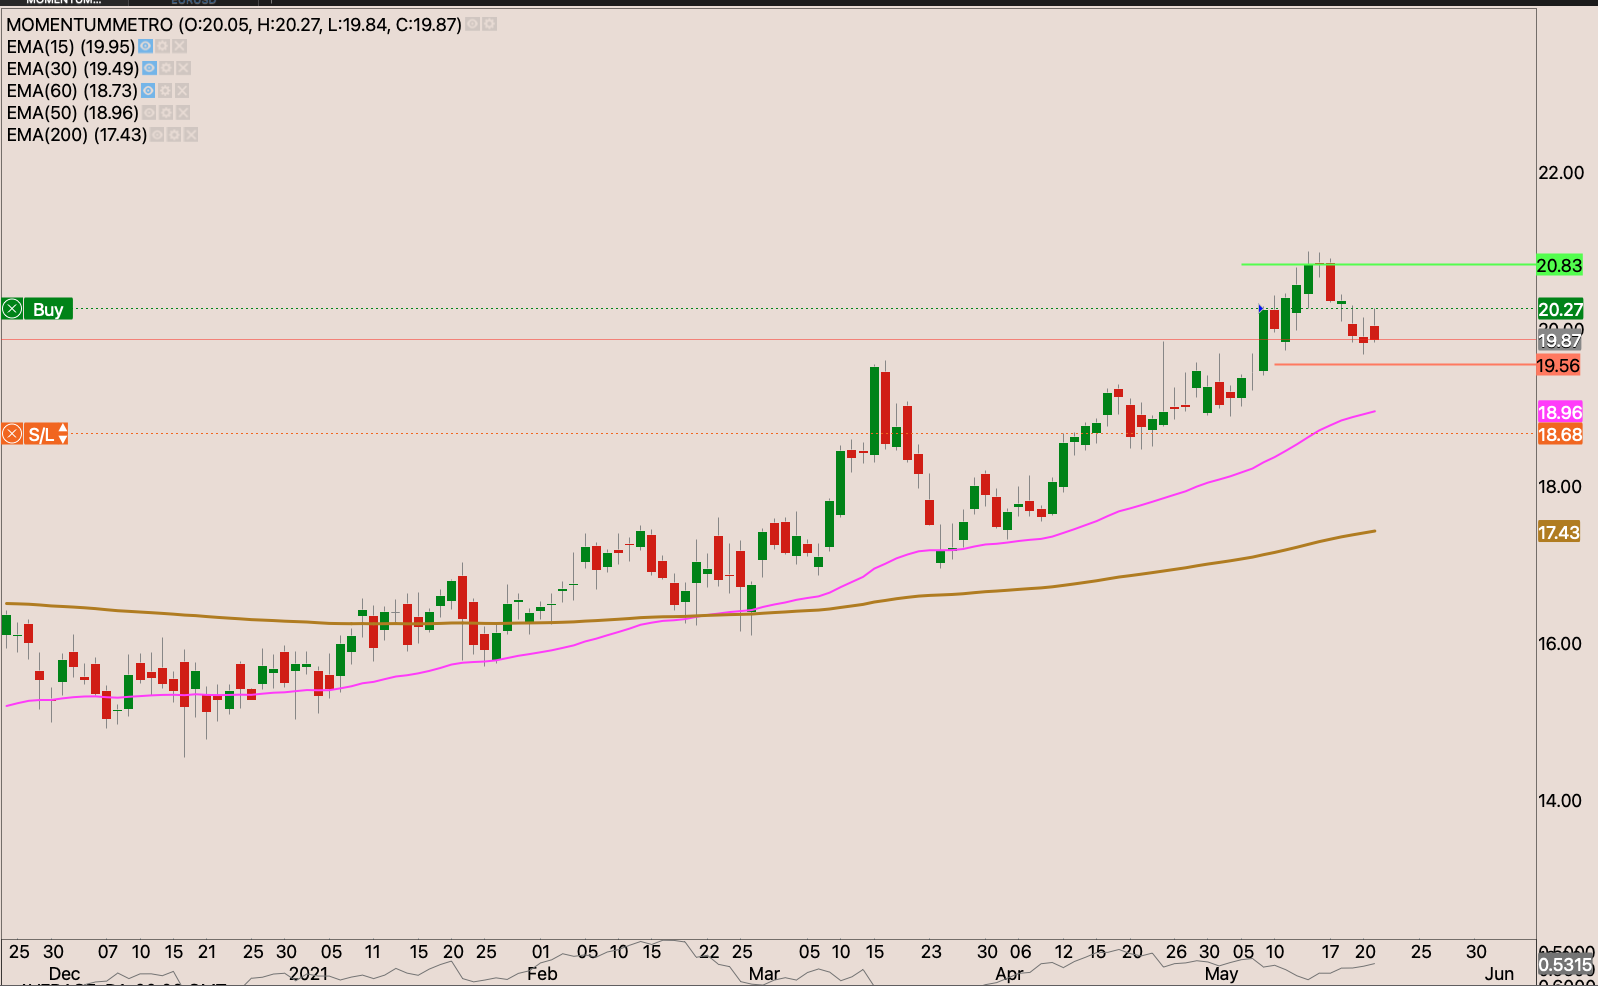
Momentum metro
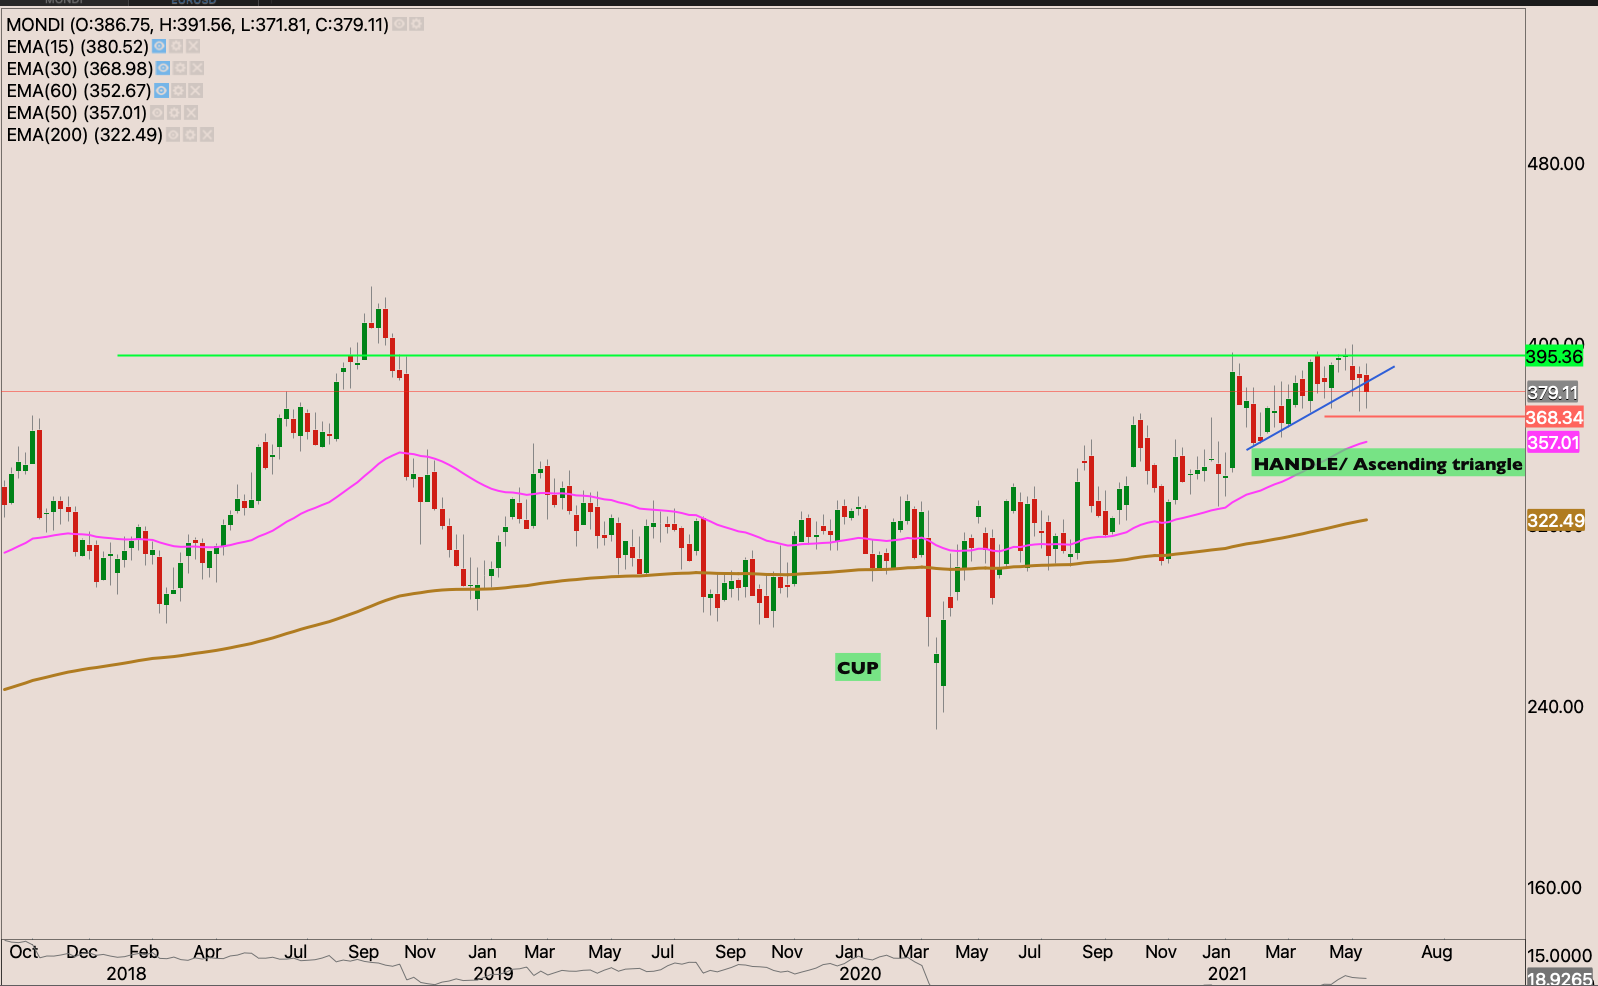
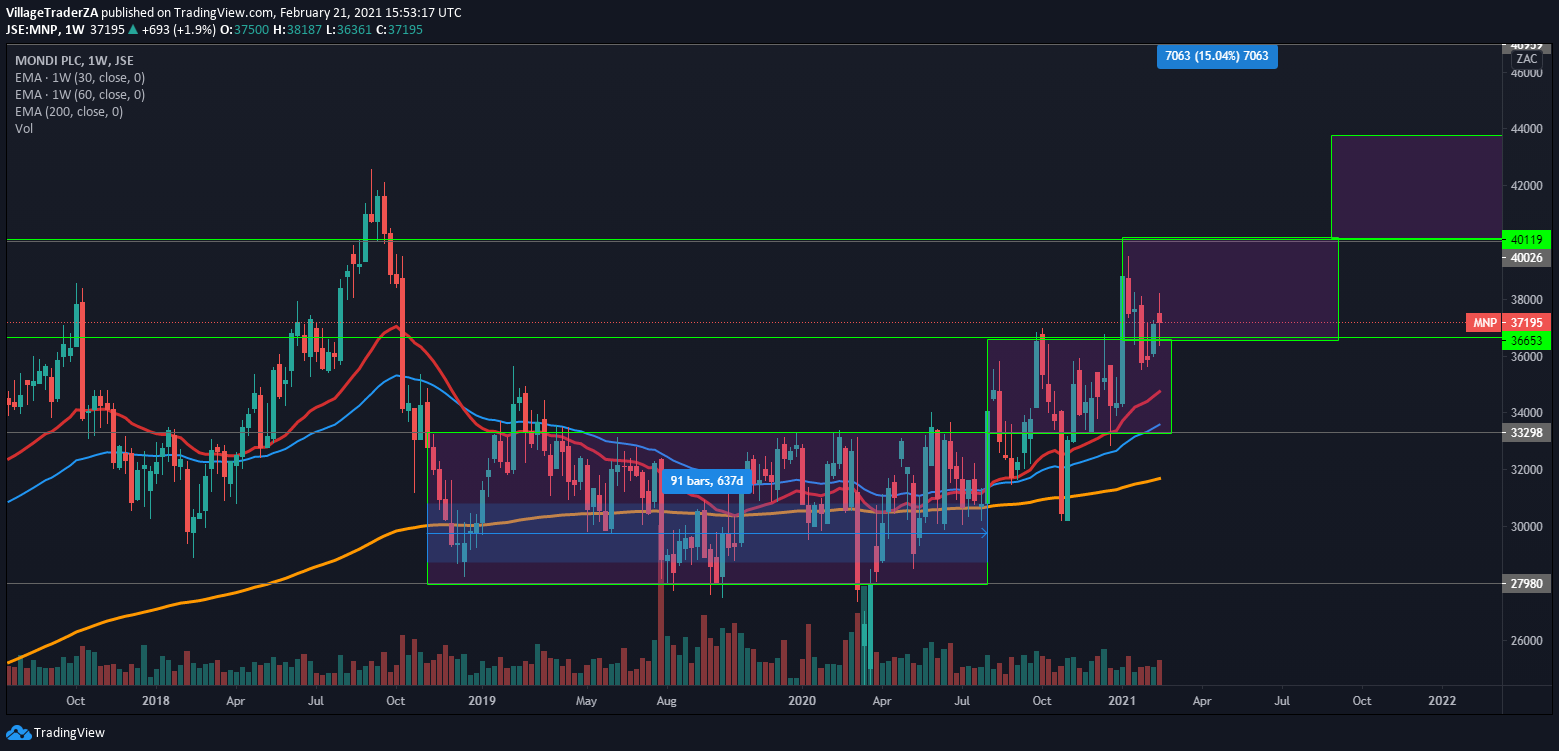
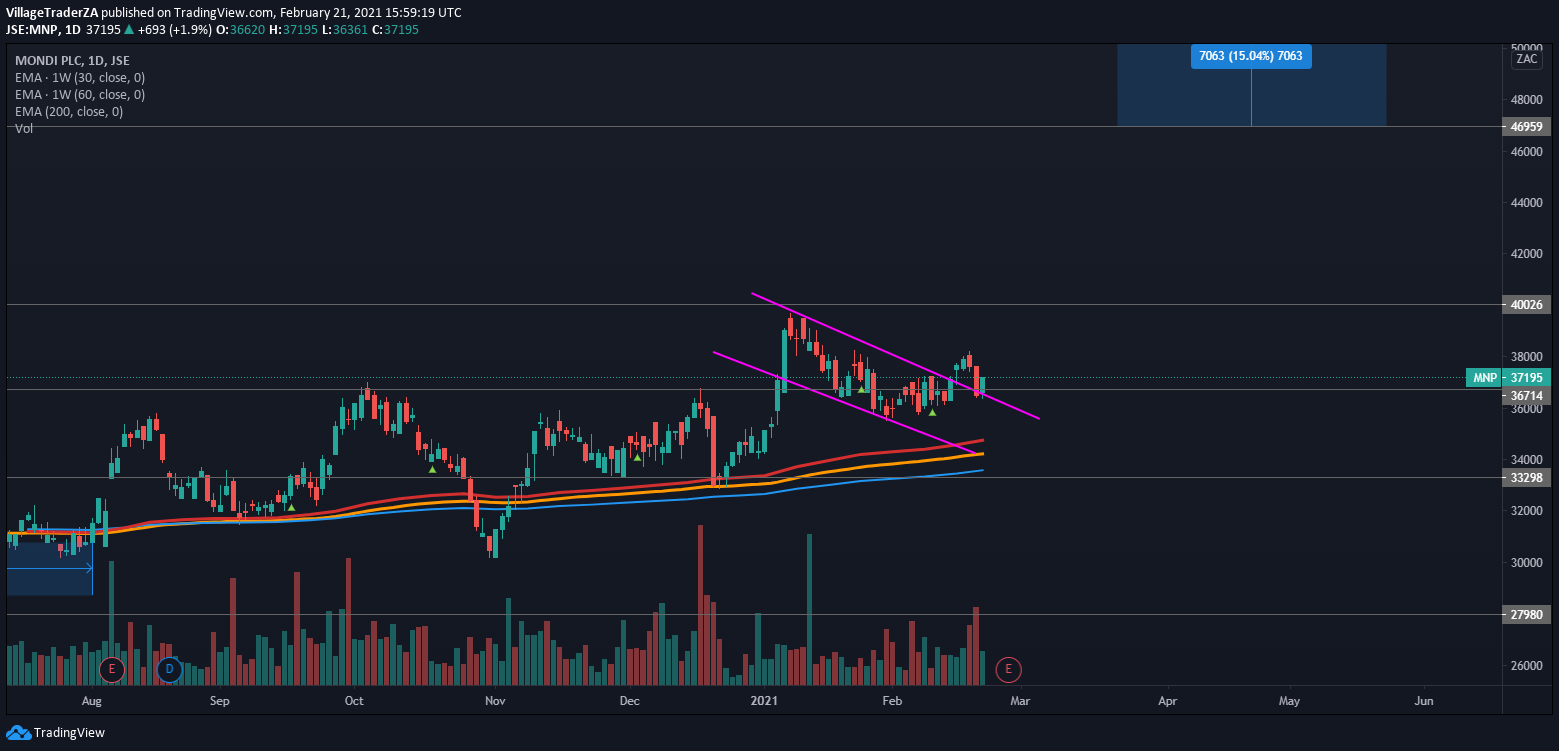
Mondi

Mr Price.
There’s some resistance at R208.13 . A break above this level provides a good entry in the stock
MTN group
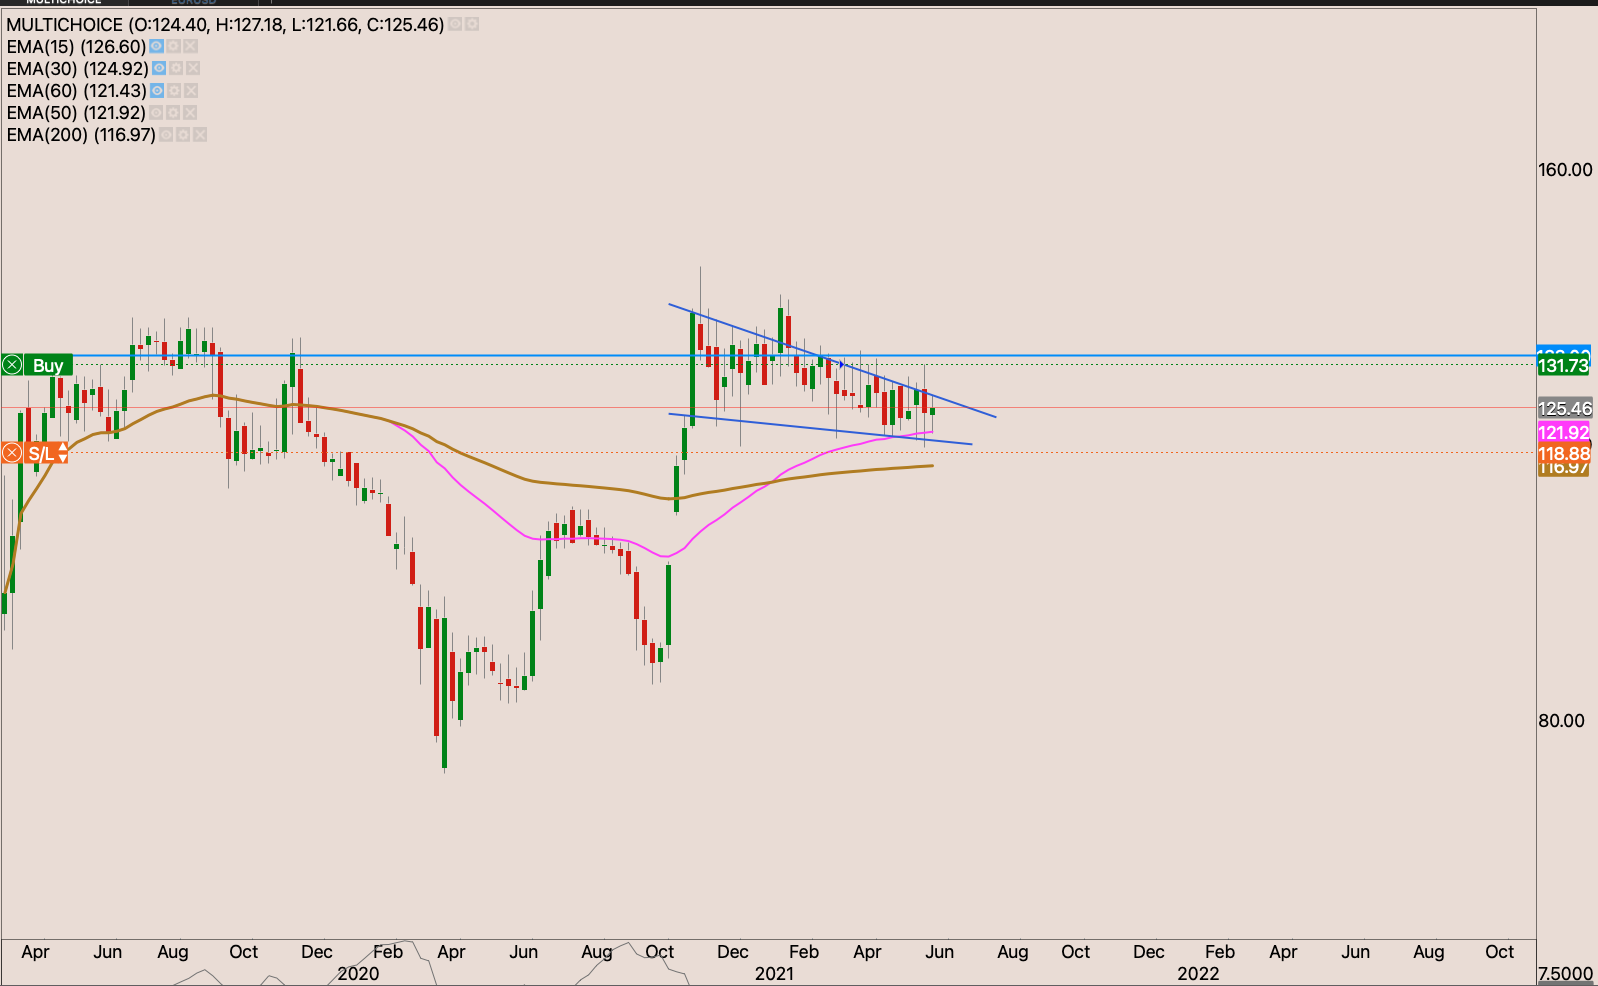
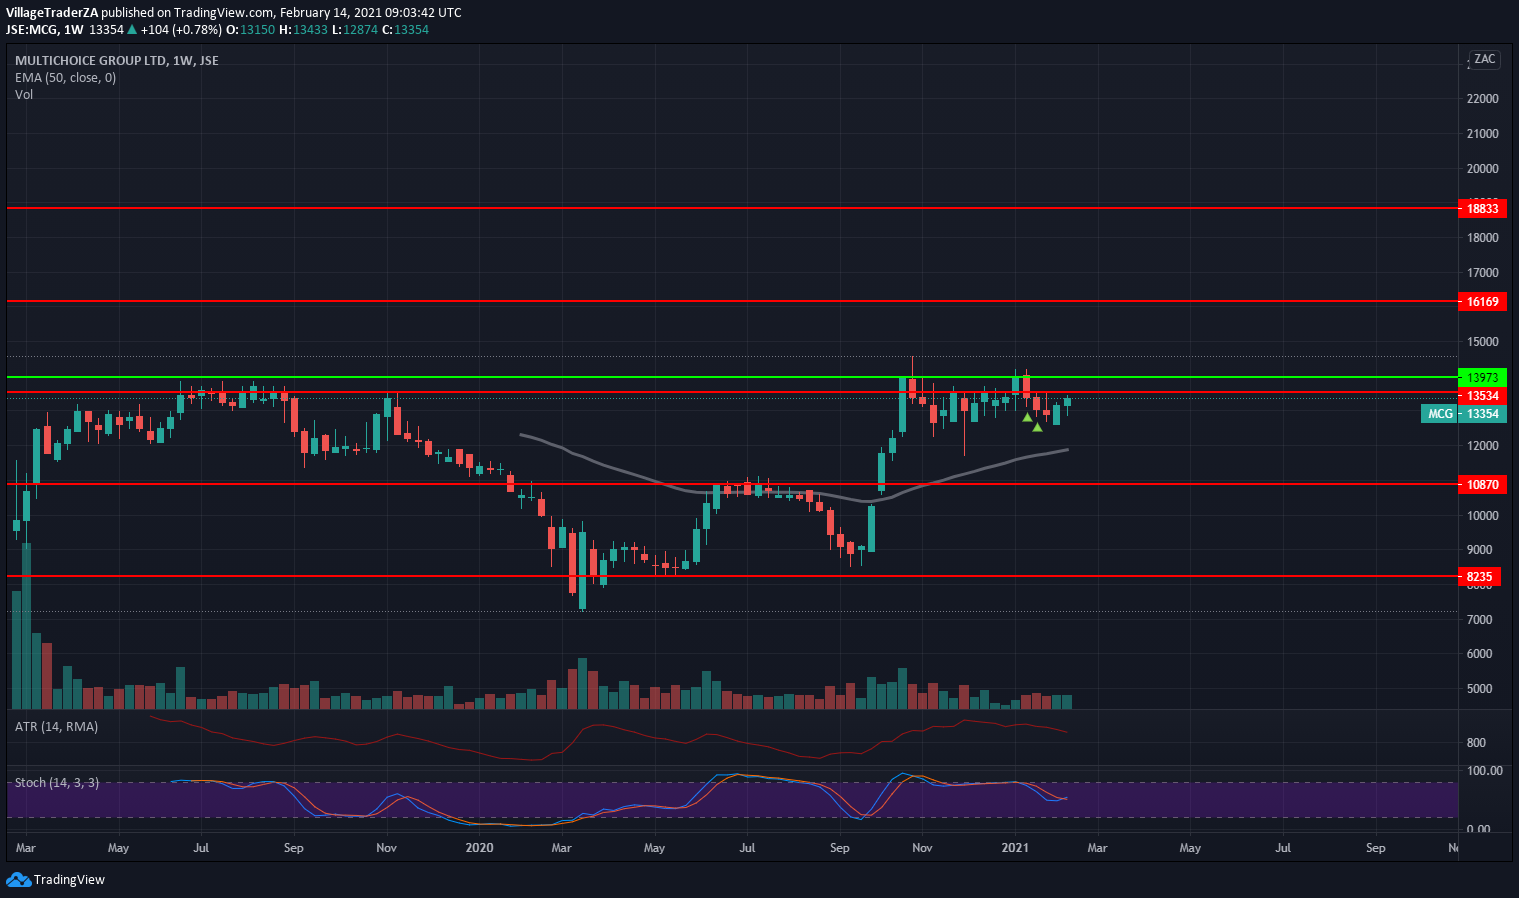
Multichoice

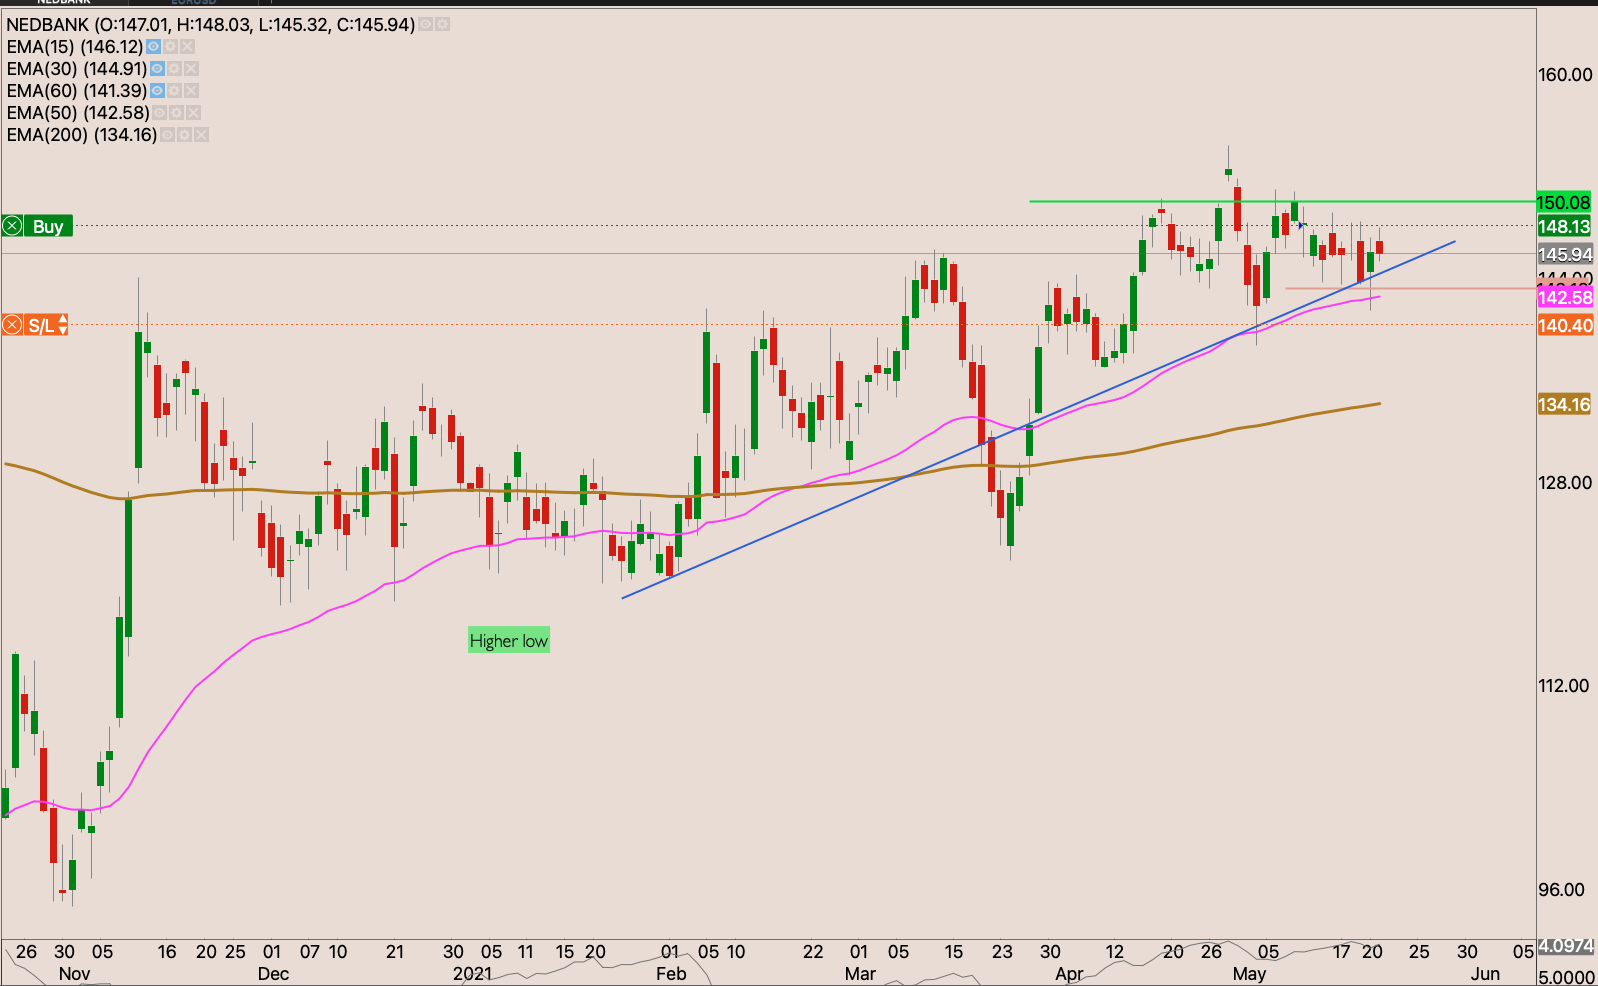
Nedbank

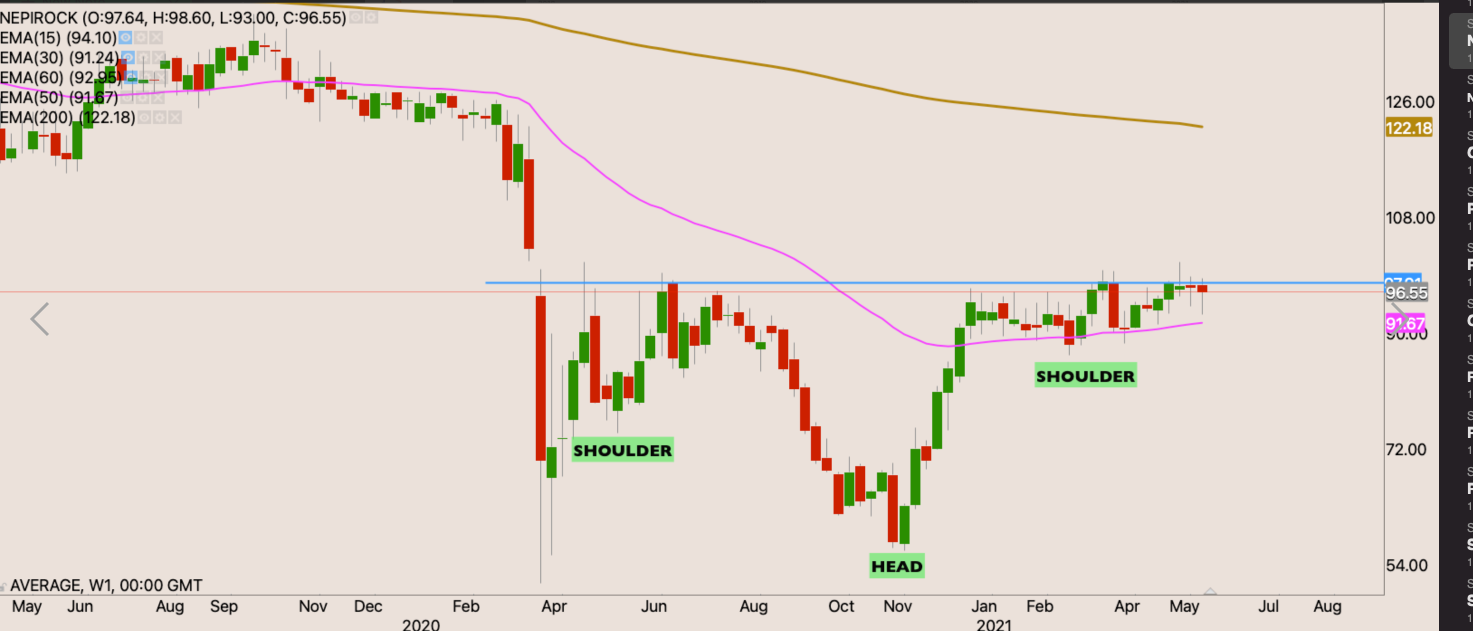
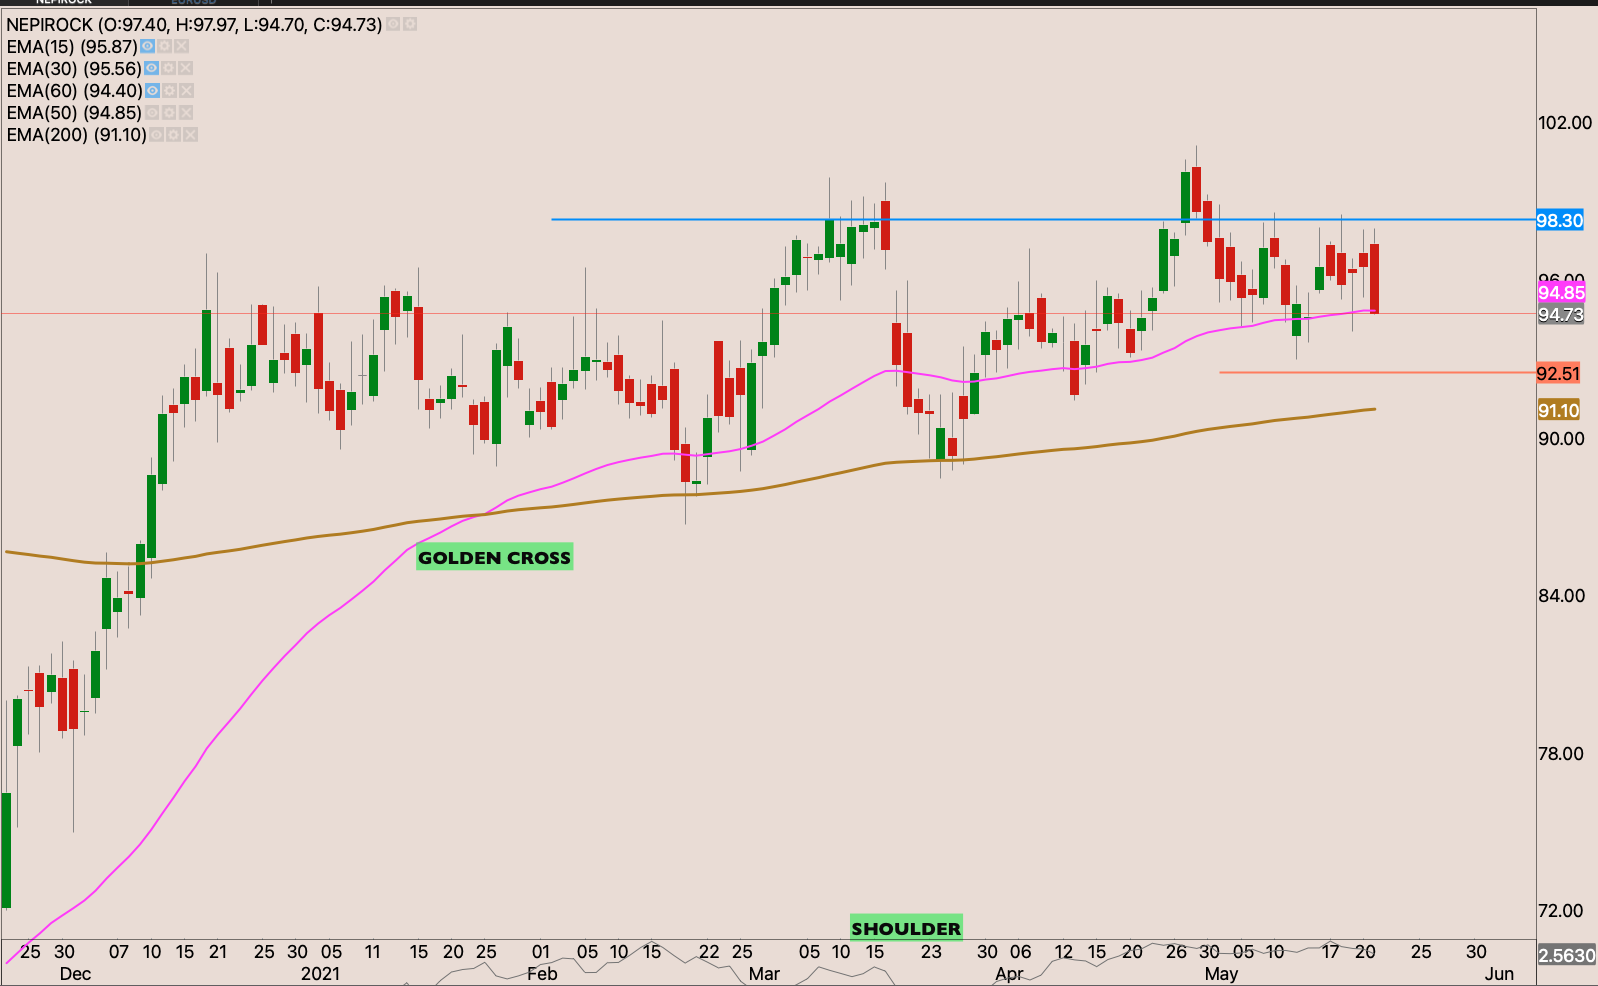
Nepirock
Northam Platinum

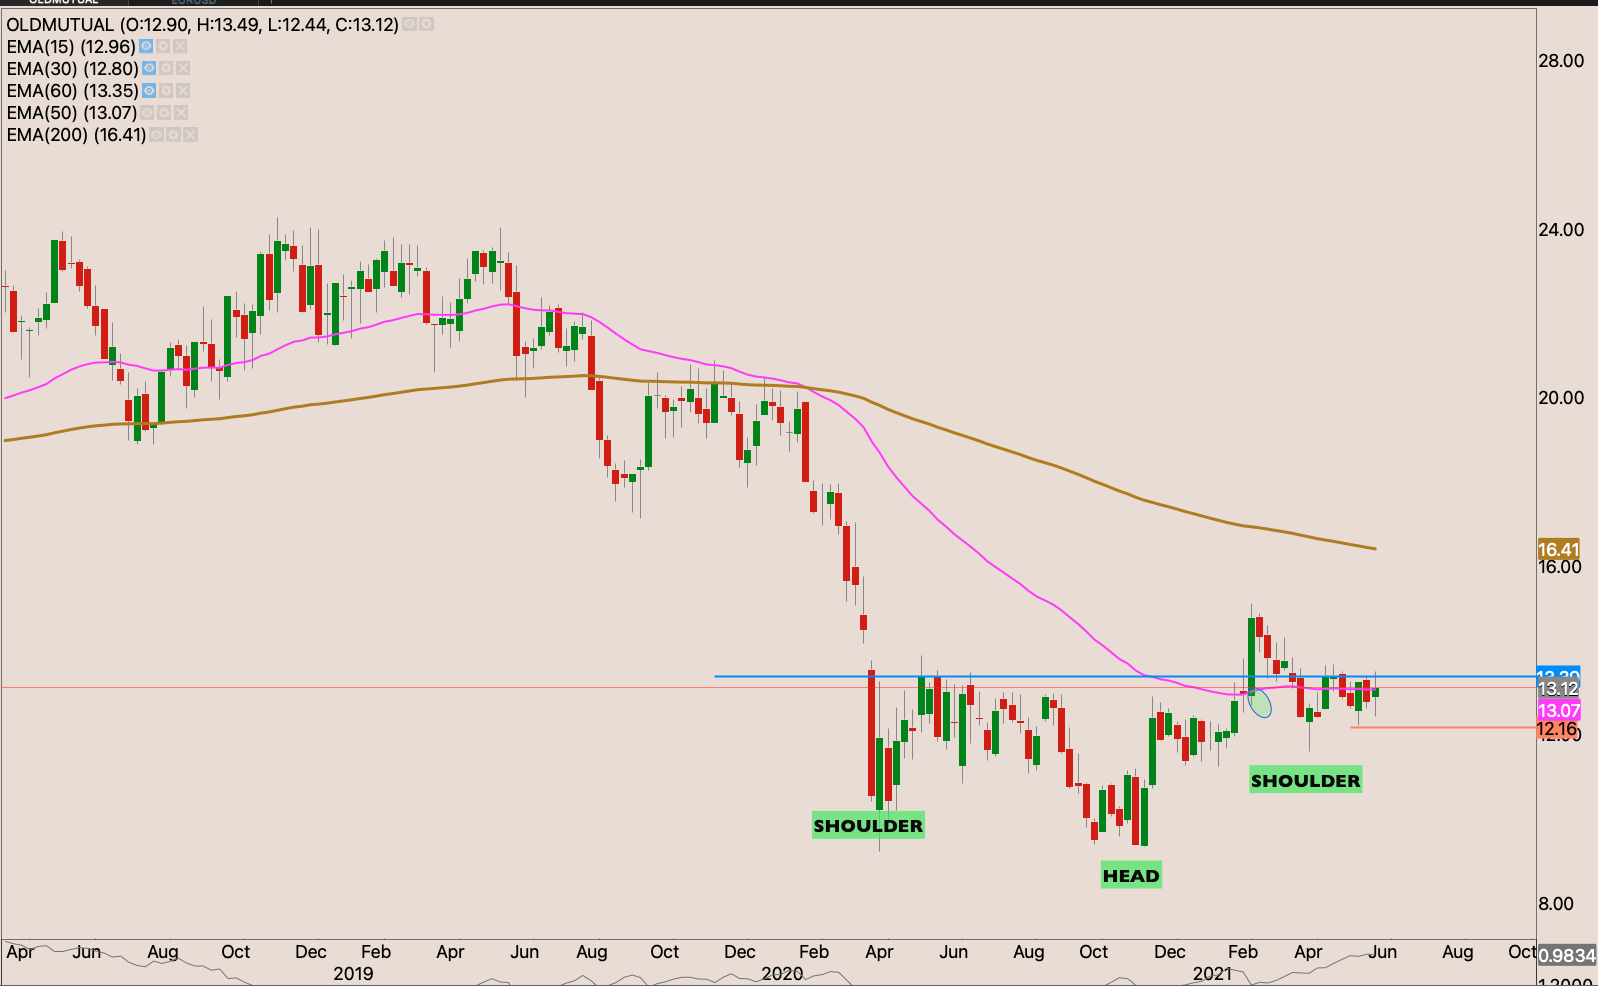
Old Mutual

Pepkor


Pick n Pay
| Pick n Pay (PIK) | ||
| Time frame/ Date | comment | Chart |
Weekly chart view |
We have nice Ascending triangle pattern. The stock holding above the 50w EMA. |  |
Daily chart view |
The stock is moving to a higher box | 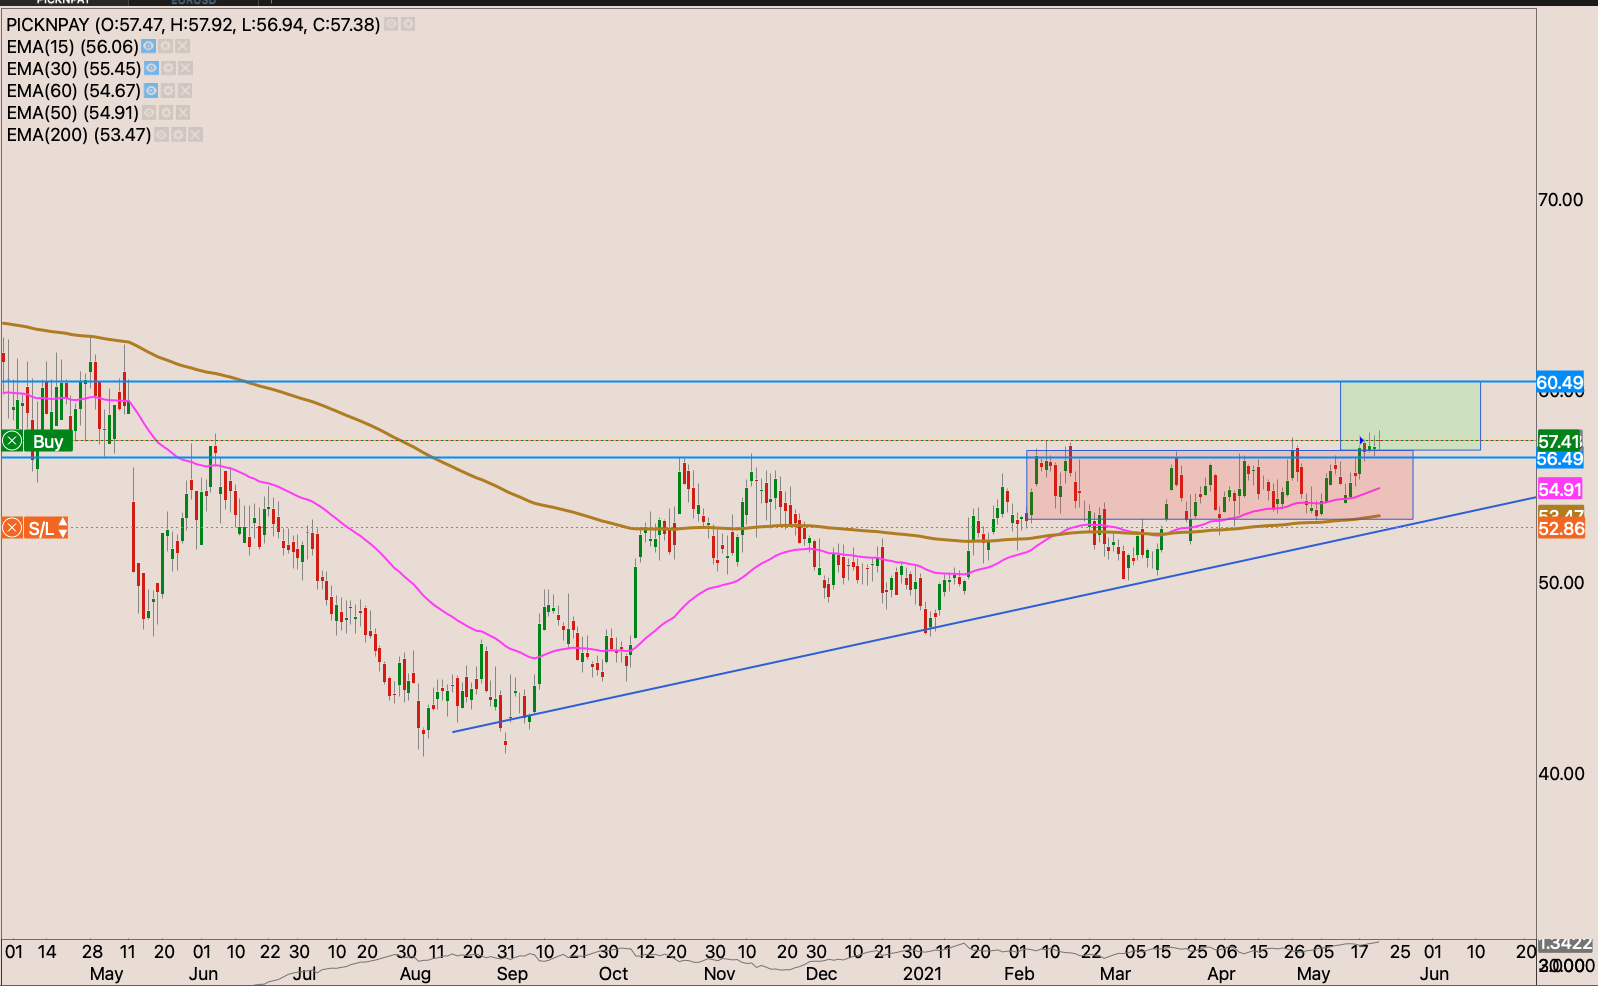 |
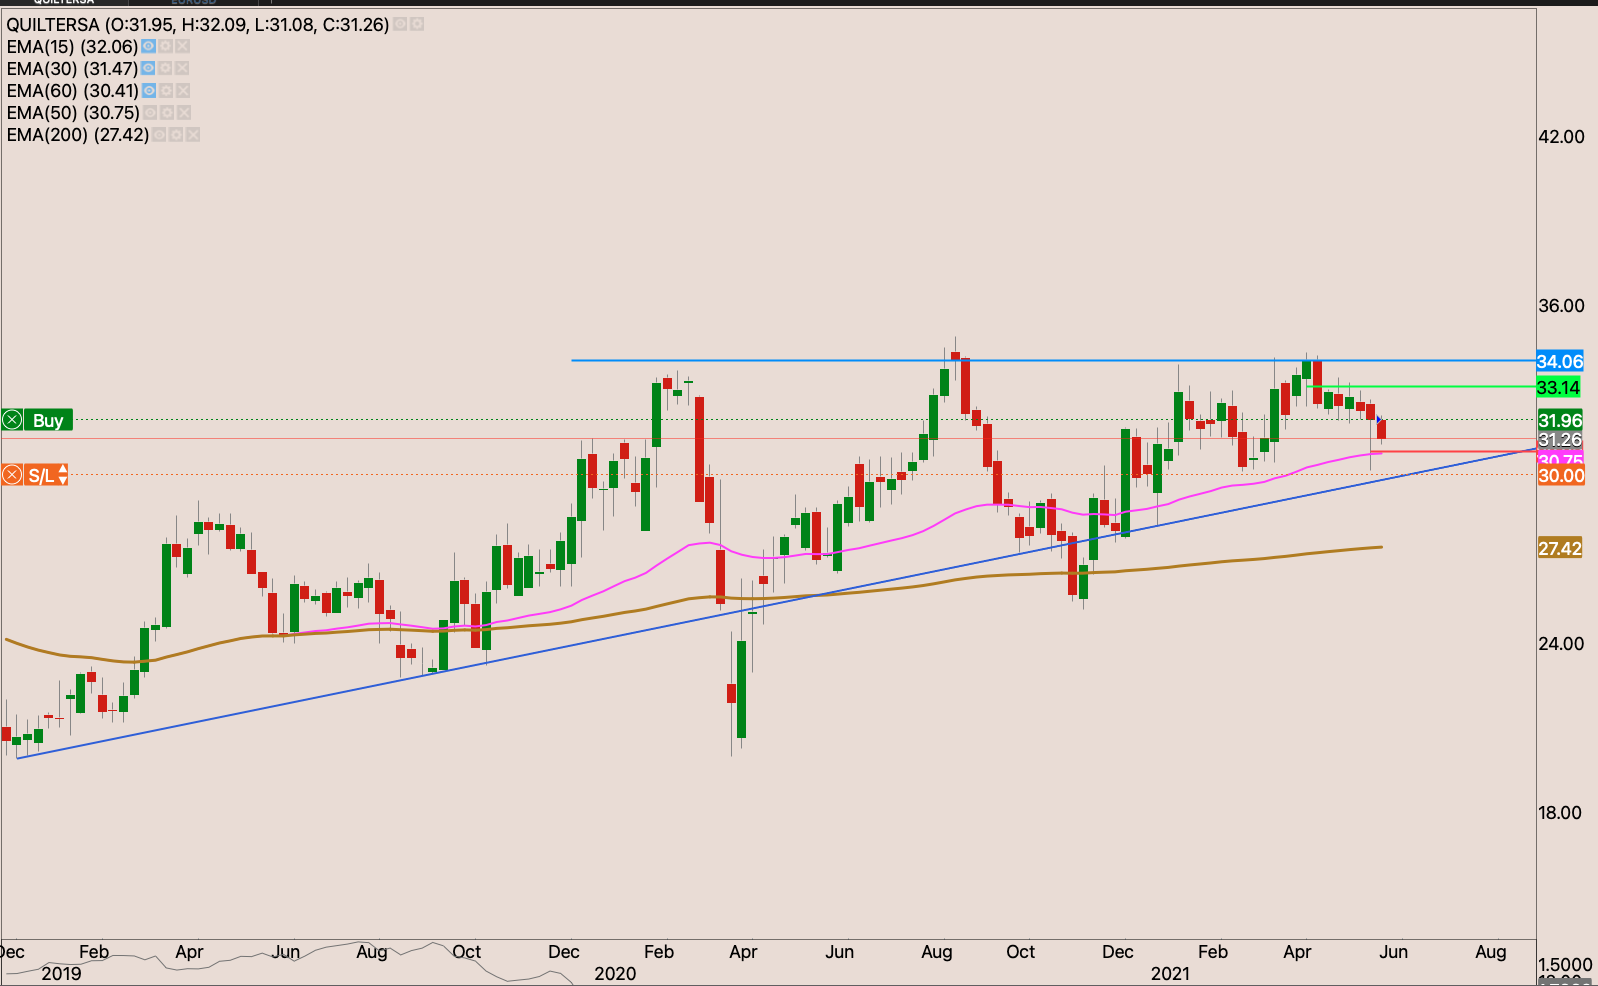
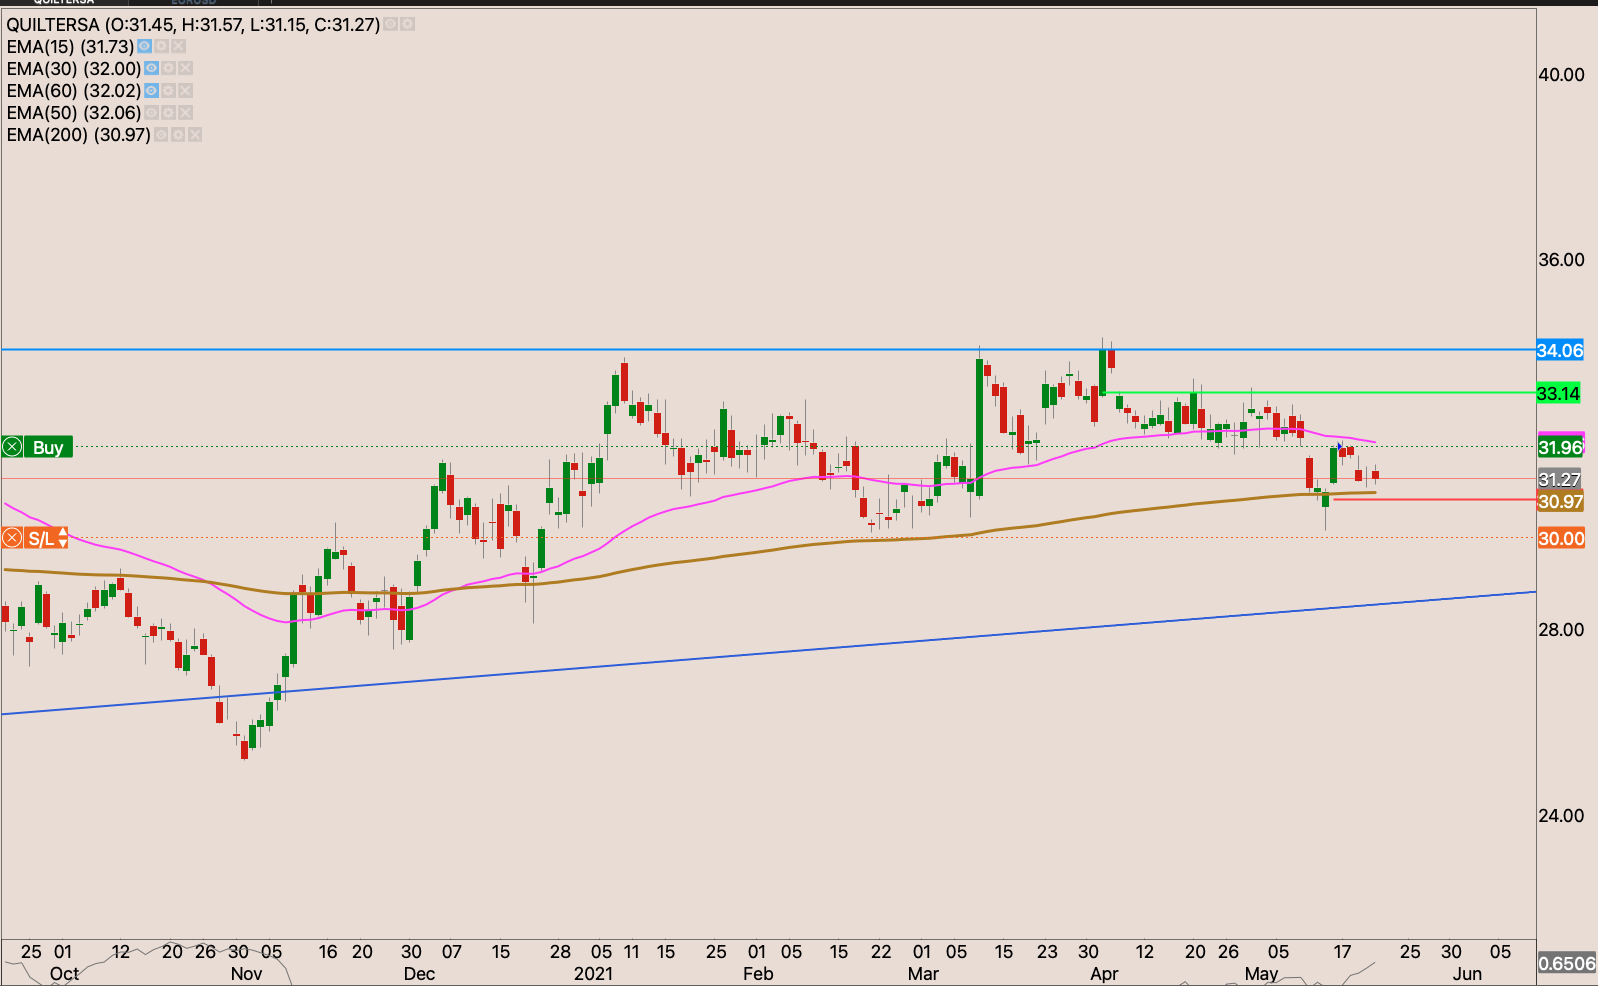
Quilter
Royal Bafokeng Platinum

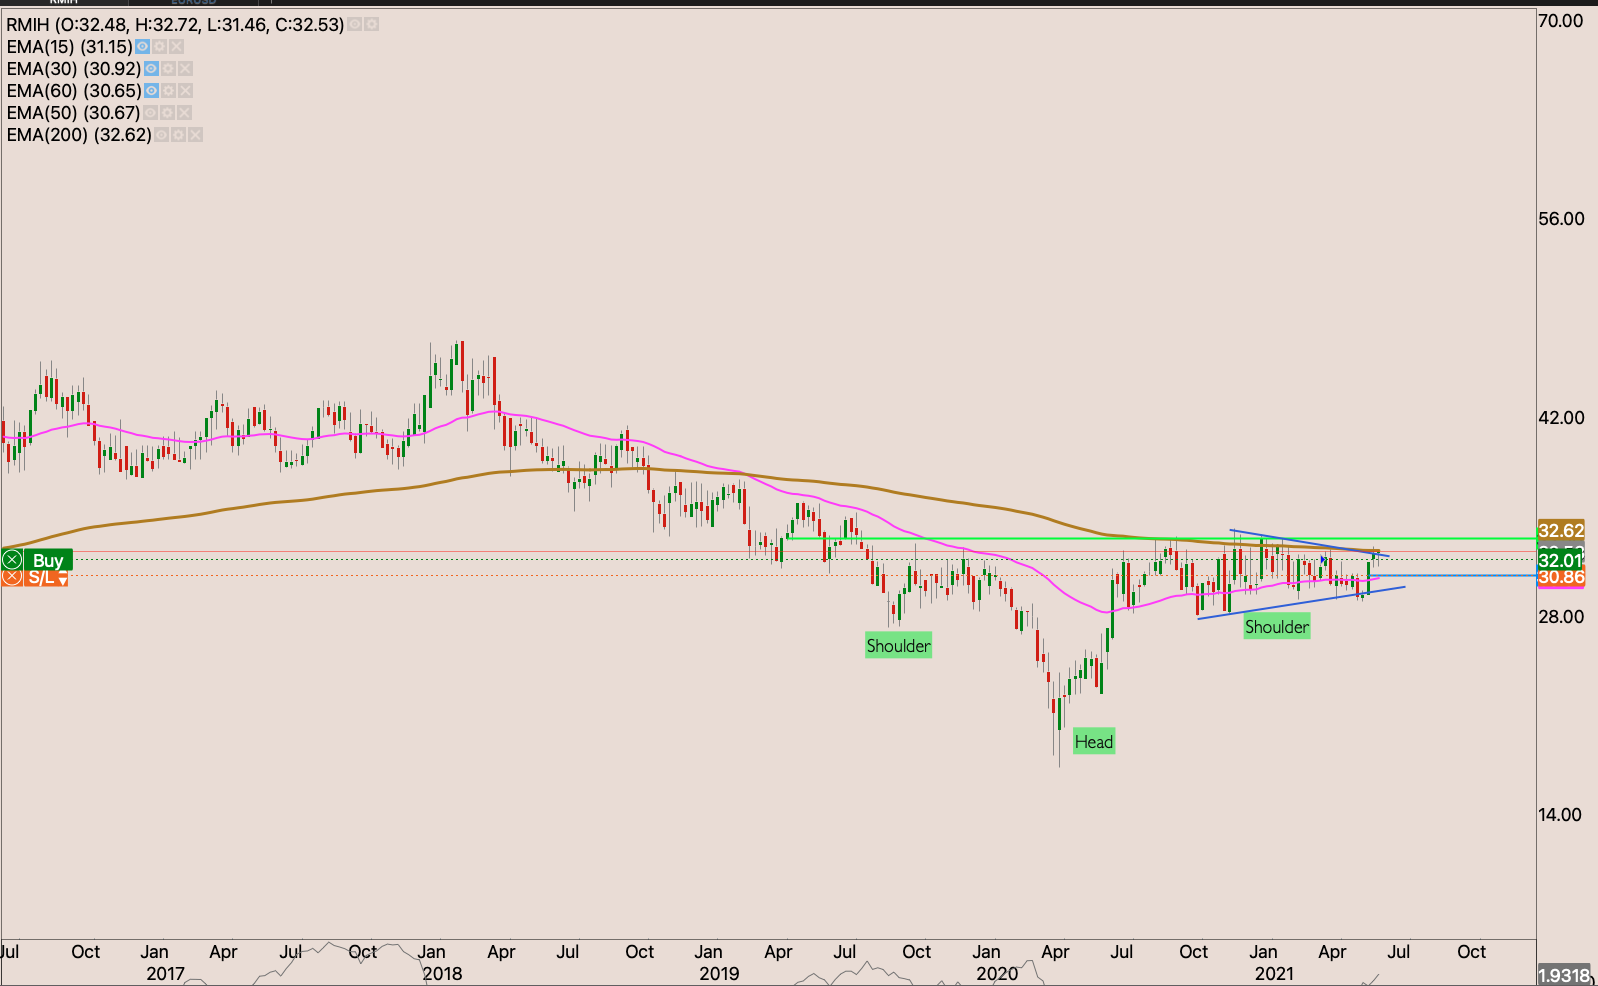
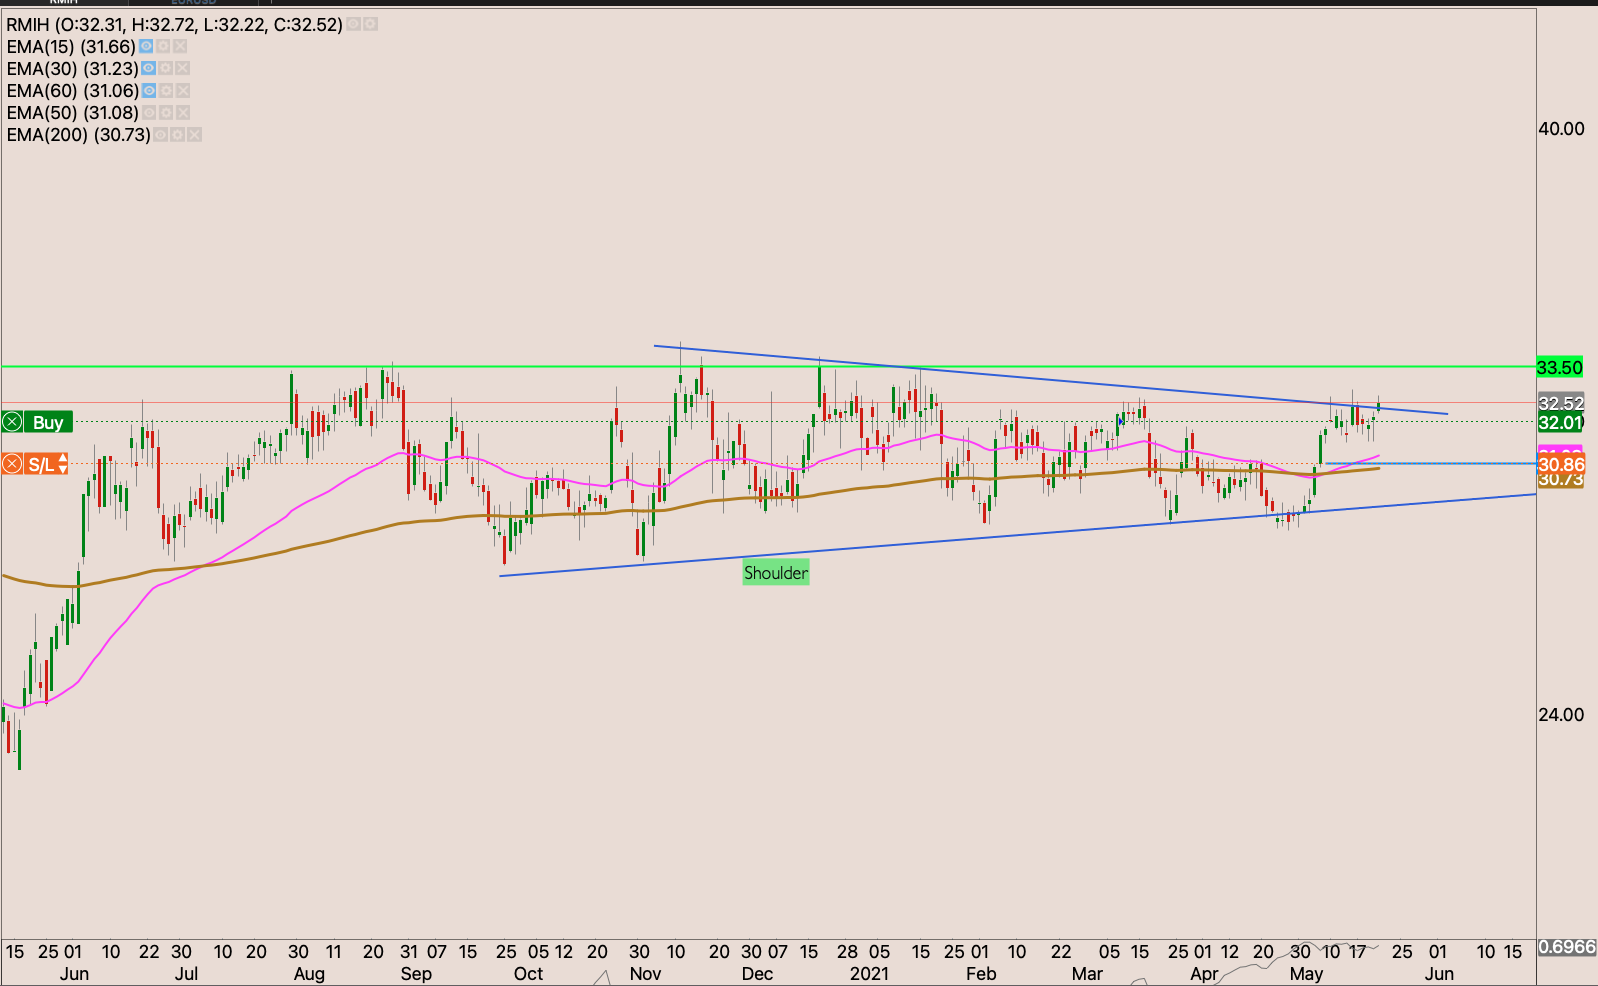
Rand merchant Investment holding
Shoprite


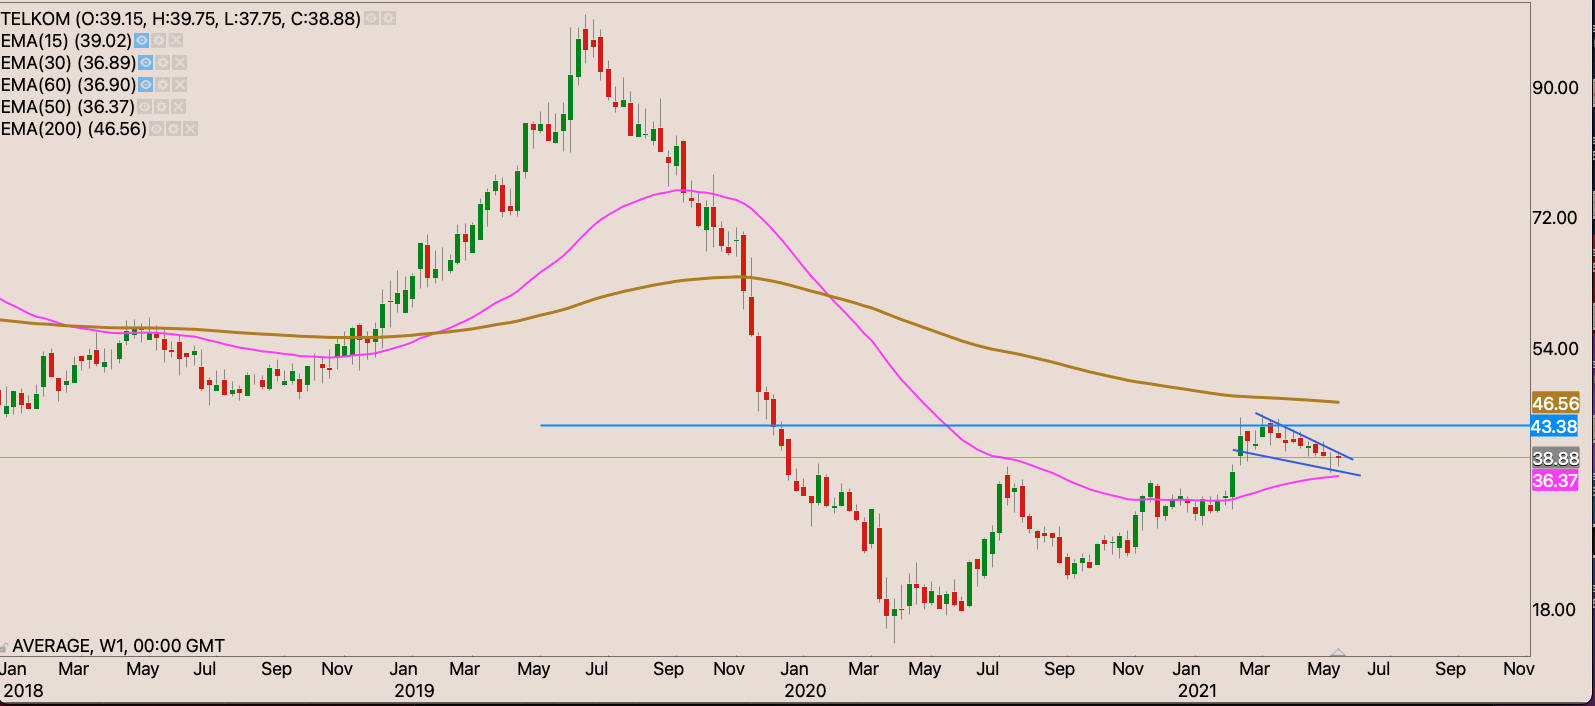
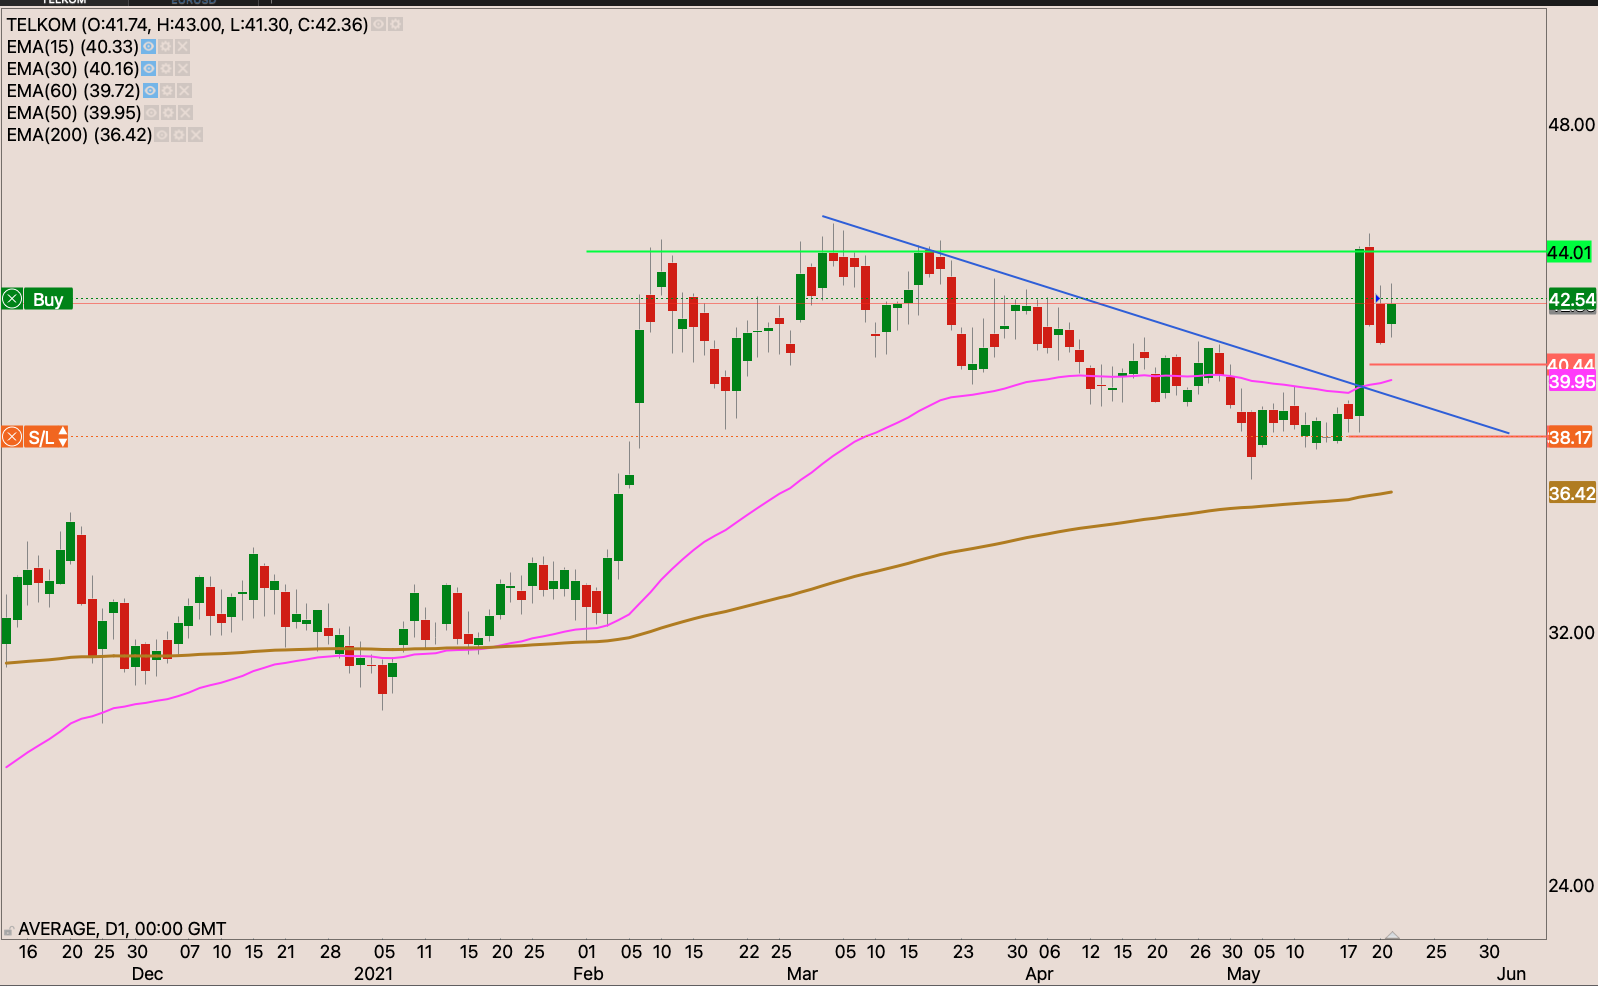
Telkom
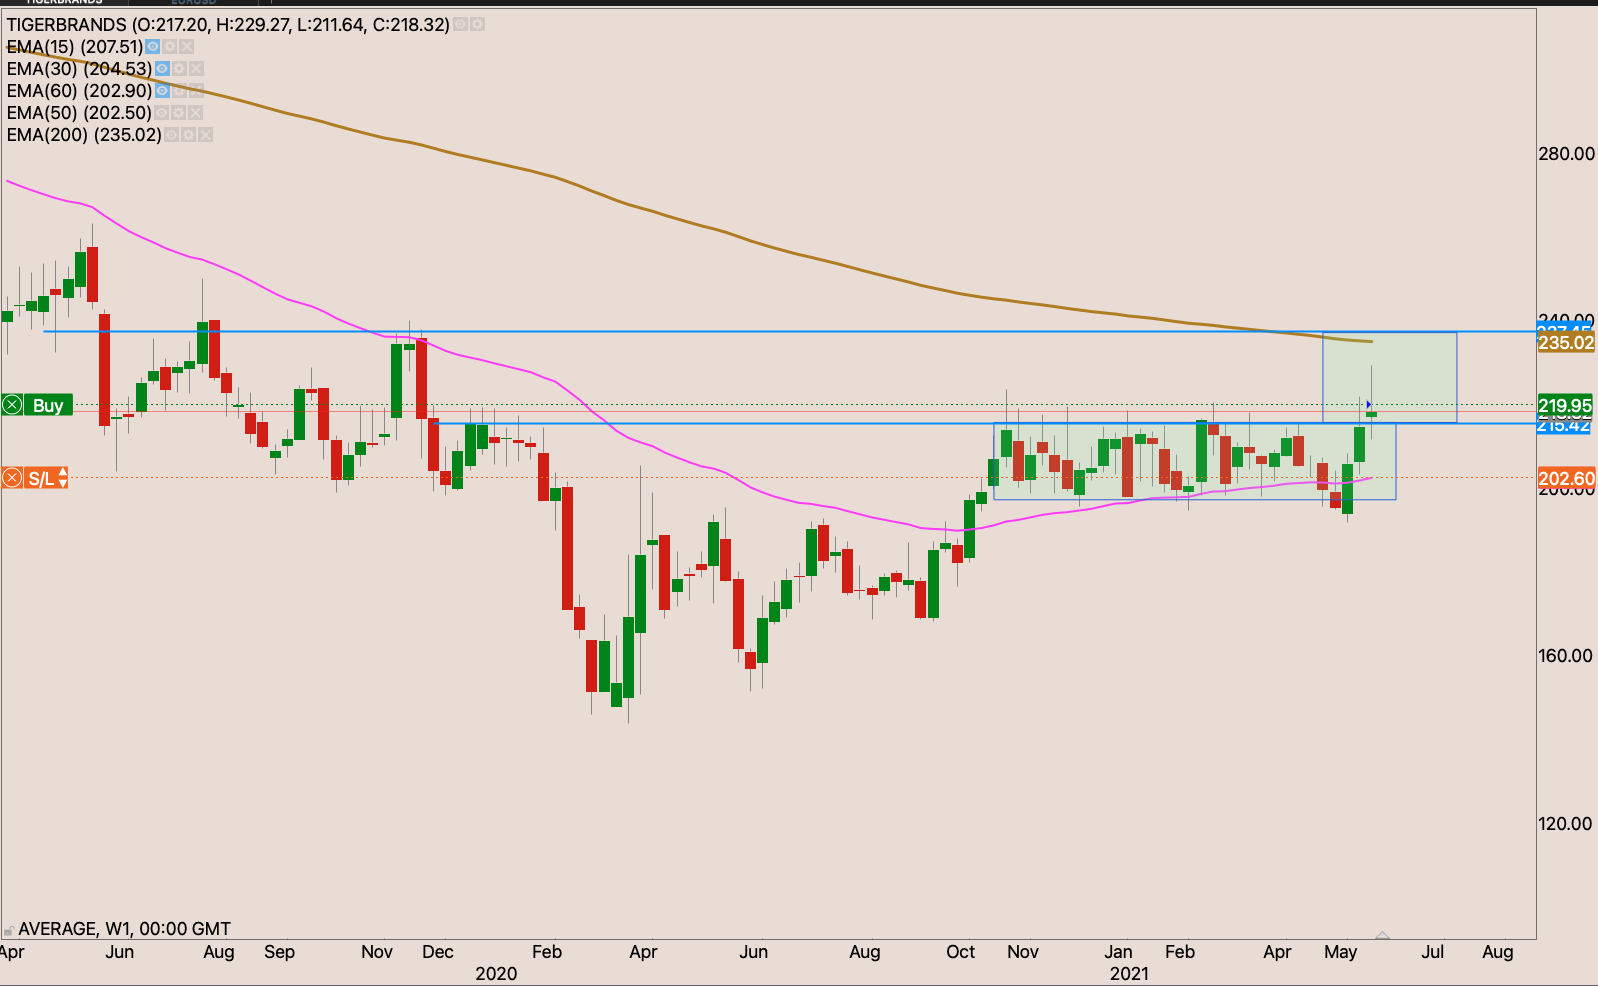
TIgerbrands

Transaction Capital

Truworths

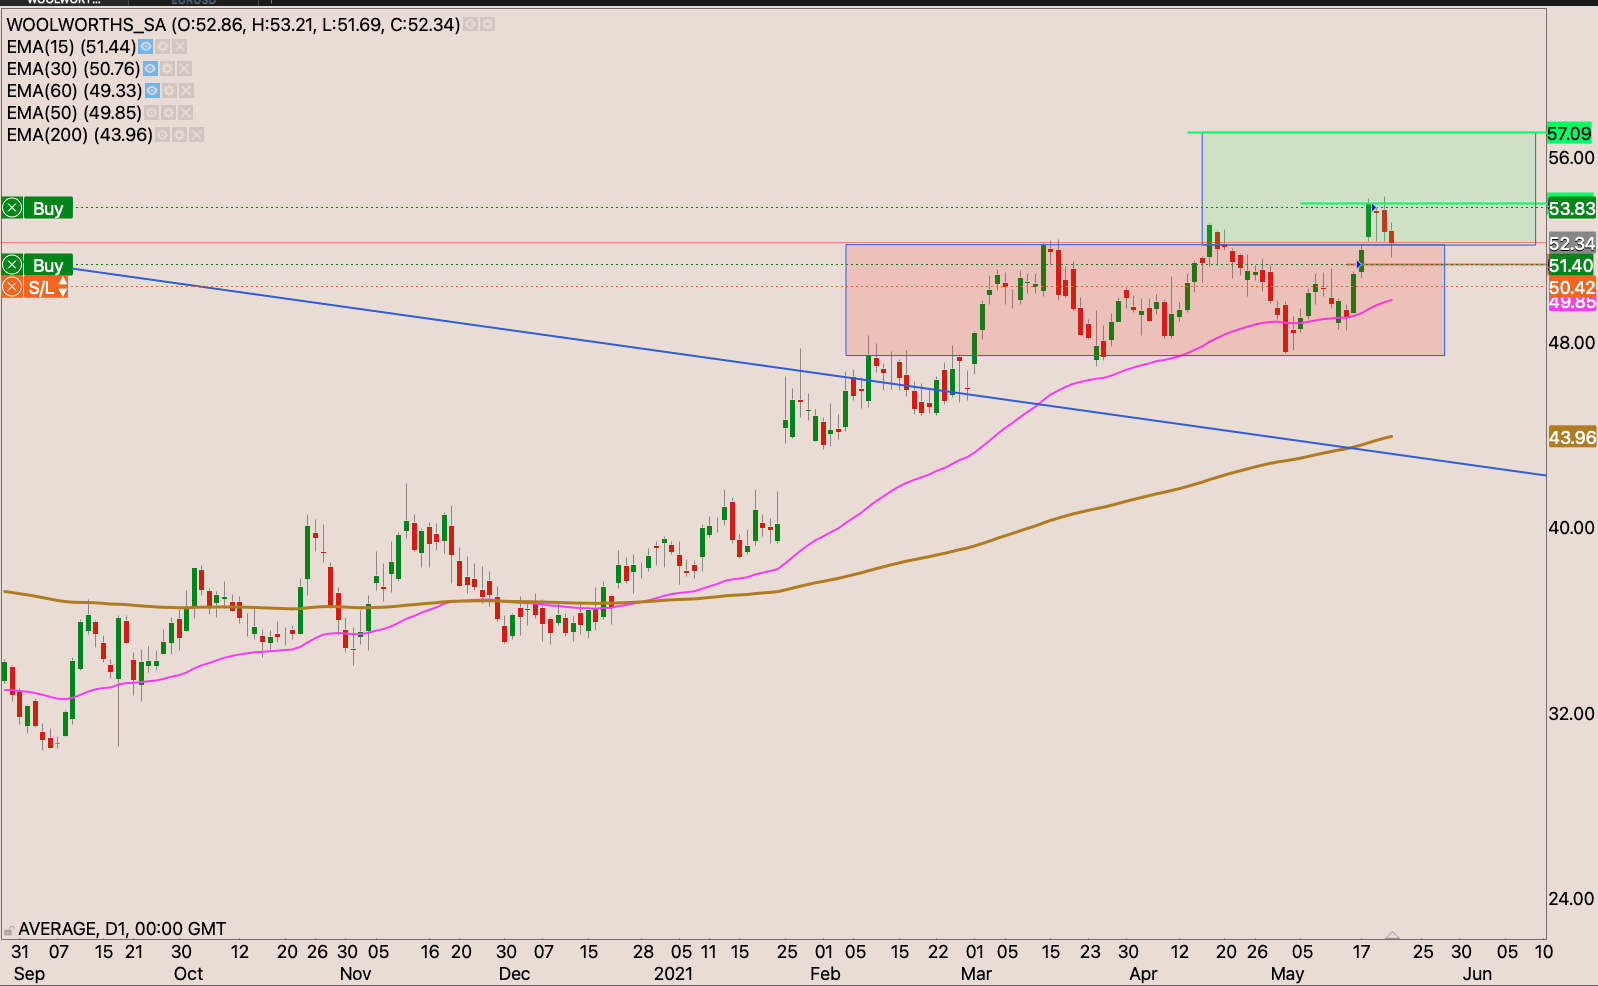
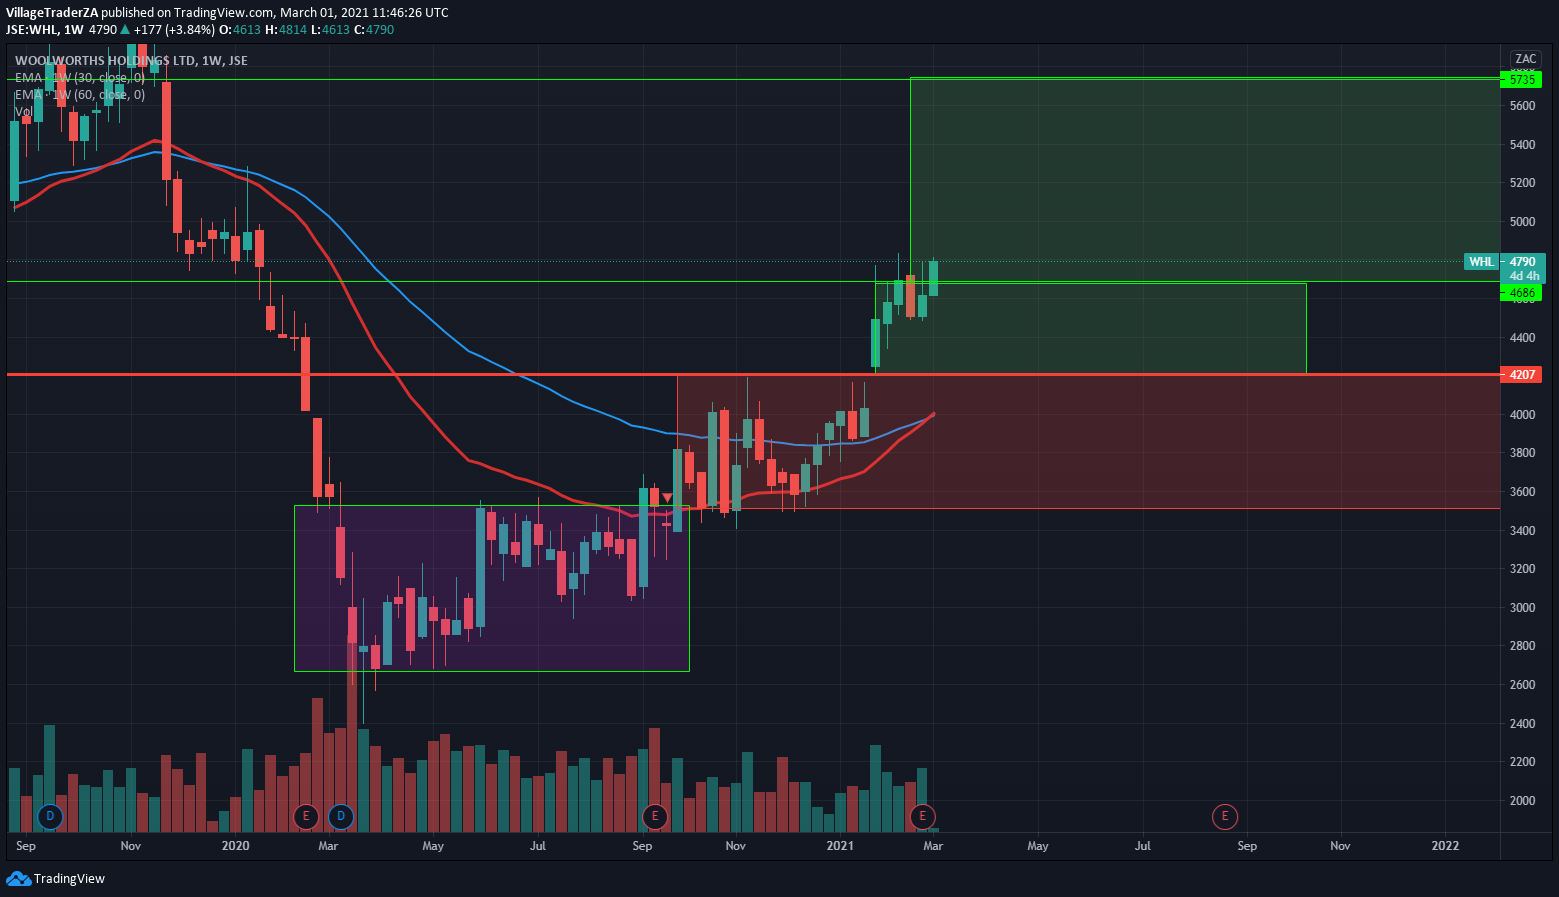
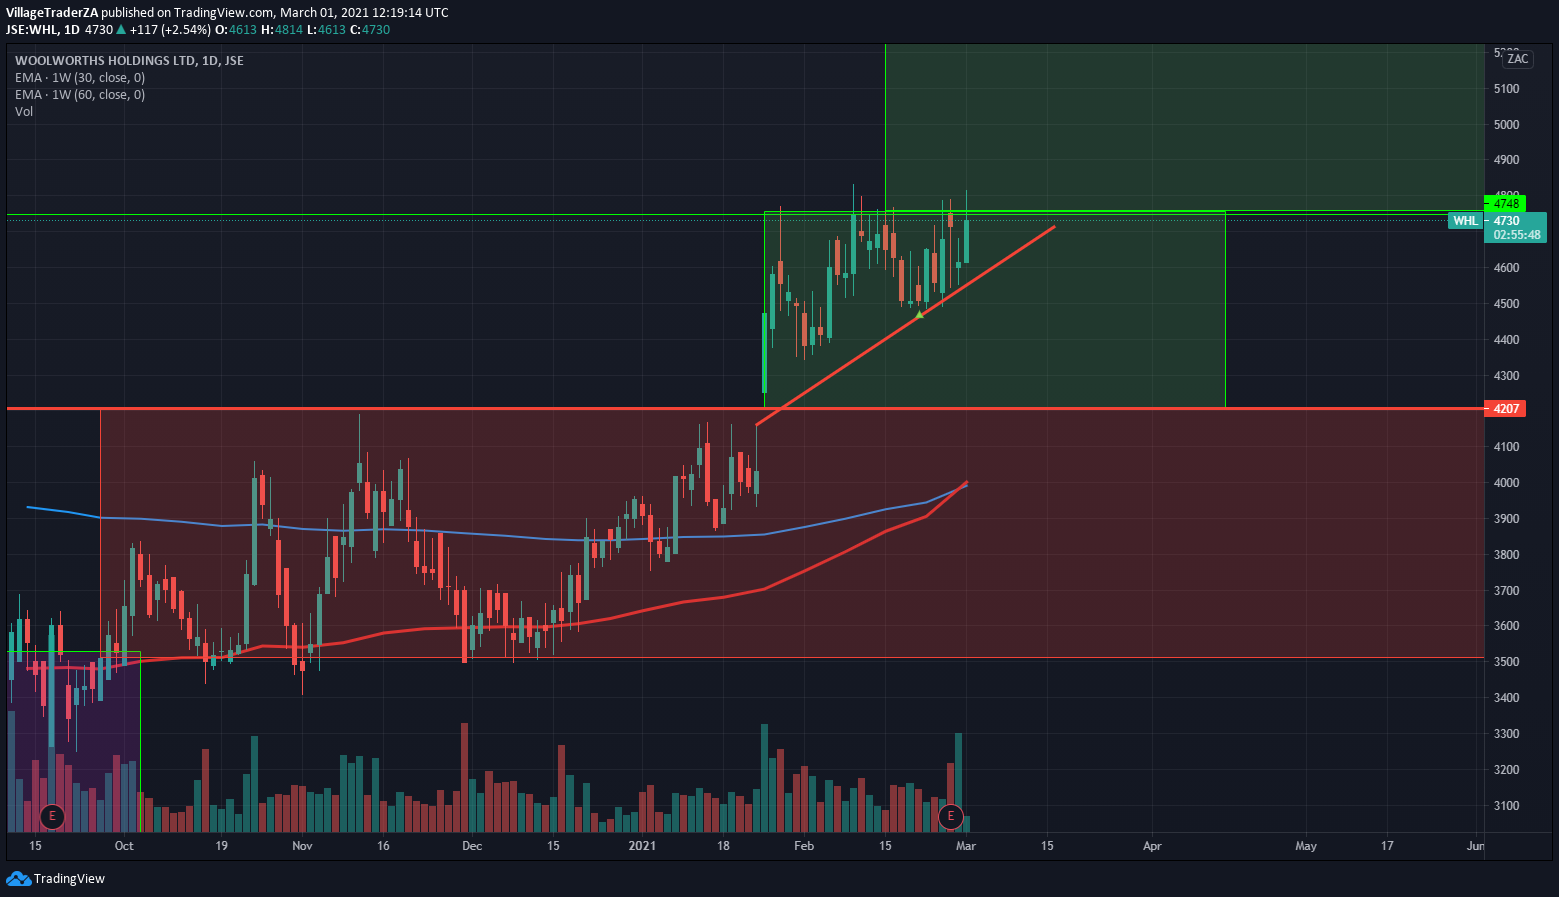
Woolworths

As a swing trader the bigger picture is important to me. This is why I like looking at the bigger picture. Looking at the weekly chart. Here are some of the JSE listed stocks stocks I’m currently looking at
Position
Average Entry: R75.50
Quantity: 4
Stop loss: R99.02
Risk: +R23.52
Current Risk ZAR: +R94.08
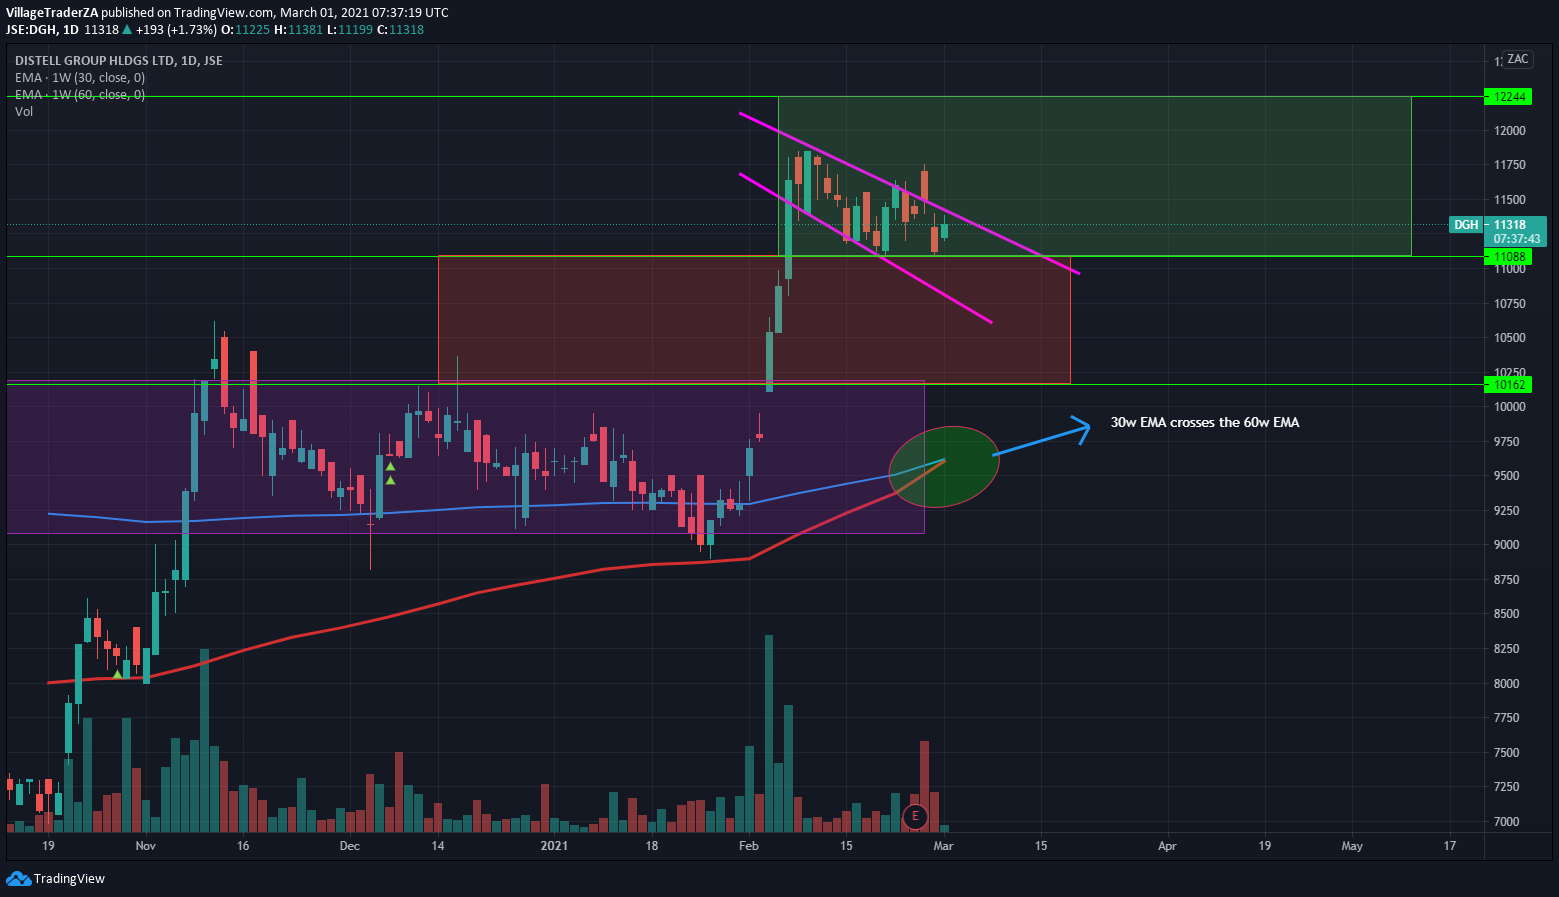
Distell is a stock I’ve held for some time. It has been moving to higher boxes over time since. Could not add to the position because I had since implemented a rule to trade in the direction of the weekly trend. The 30w EMA as of writing is only 13 points from crossing the 60w EMA. The stock broke to the R110 – R122 from the R101 – R110 box.
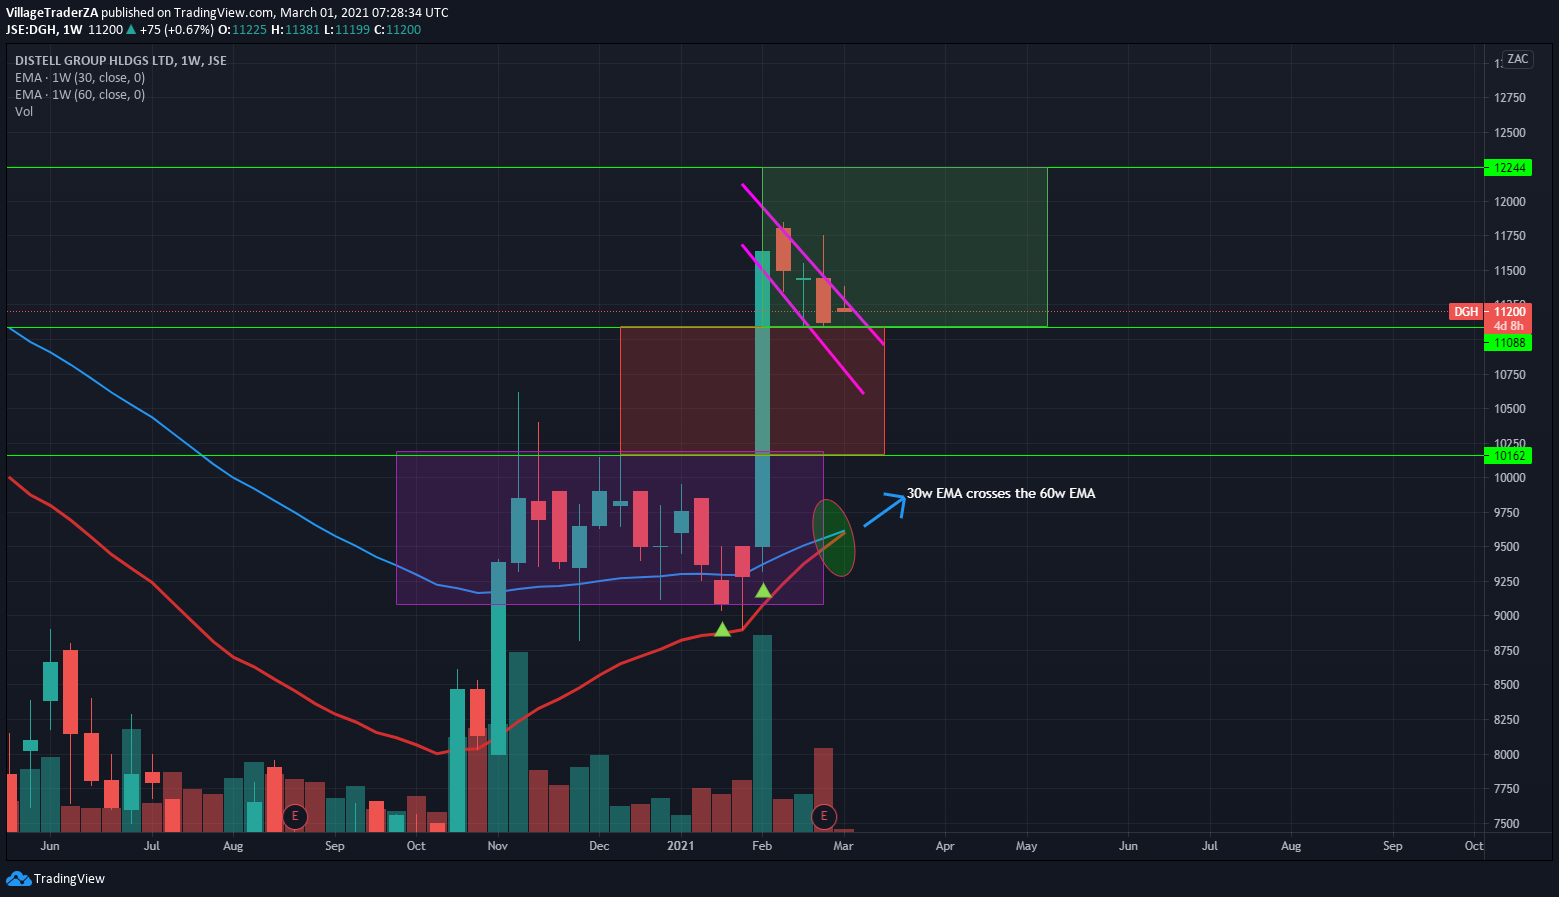
Taking a lot at the daily chart. We have a nice looking bullish flag on the stock as it was testing the R111 Support which held quite well. I’m going to add to my position when the stock breaks out of the bullish flag.
____________________________________________________________________________
Position
No position in the market.
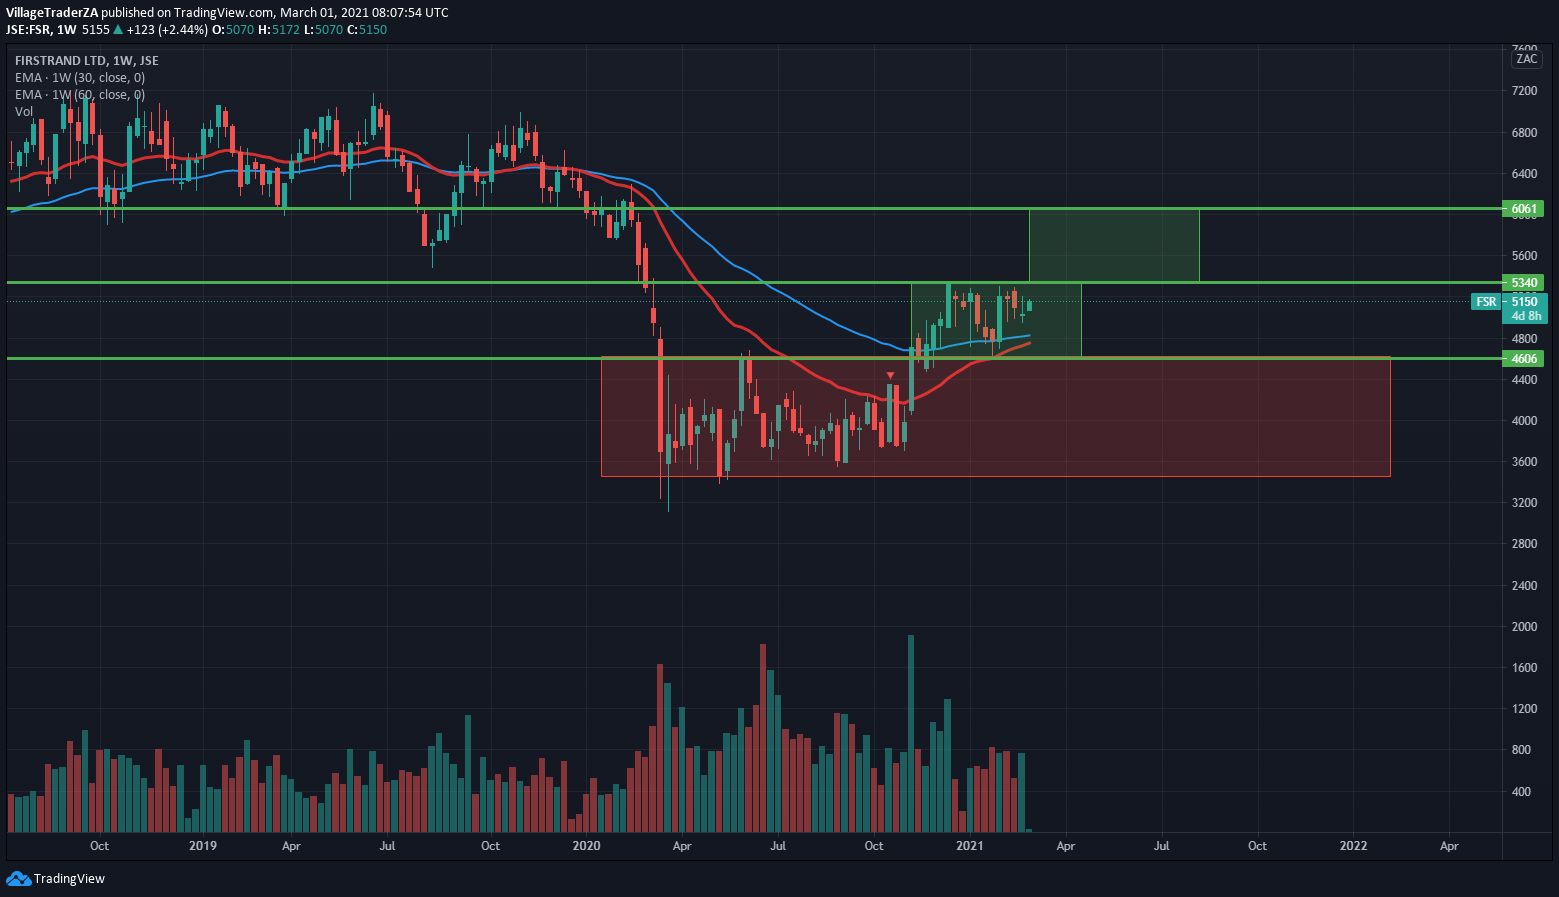
The banks are looking like they’re recovering. Firstrand is looking quite good at the moment. Currently trading within the R46 – R53 box. If the stock breaks to the R53 – R60 and the 30 EMA crosses the 60w EMA. I will buy the stock.
____________________________________________________________________________
Position
Average Entry: R271.10
Quantity: 8
Stop loss: R258.57
Risk: -R12.53
Current Risk ZAR: -R100.24
The stock looks quiet lively currently dancing about in the R251 – R303 box. I; lookking for a break through the R303 resistance moving to the R303 – R363, at which point I will add to my position and my position and trail my stop loss behind me.
____________________________________________________________________________
Position
Average Entry: R143.09
Quantity: 11.5
Stop loss: R133.04
Risk: -R10.05
Current Risk ZAR: -R115.58
The stock has been looking good for for some time now. Breaking into higher boxes. Looking for a break to the R150 – R192 box. The stock is still trading in the R108 – 150 box.
____________________________________________________________________________
Position
Average Entry: R49.25
Quantity: 47.30
Stop loss: R47.22
Risk: -R2.03
Current Risk ZAR: -R94.02
I’ve been in the trade for some time now. The stock is looking good piling up the boxes on the way up. Currently looking to break to the R51 – R58 box from the R44 – R51 box. We have a nice looking bullish flag on the stock at the top of the R44 – R51 box. When the stocks break the flag into the higher box I will add to my position.
___________________________________________________________________________
Position
No position in the market.
Woolies seems to have turned the tide. The stock has been moving into higher boxes, and the 30w EMA has crossed the 60w EMA. The stock is looking good to break to the R47 – R57 box.
Taking a look at the daily chart
We have a nice ascending triangle pattern. Waiting for break through R47.
____________________________________________________________________________
Position
Average Entry: R71.84
Quantity: 13.60
Stop loss: R69.42
Risk: -R2.42
Current Risk ZAR: -R32.60
Been holding the stock for a while now. The stock looked good to break into the R93 – R109 box. Having a tough with the R93 resistance. Still looking for a breakout. I will add to my position when we break above R93
Looking at the daily chart we have a nice ascending triangle pattern and the stock looking good to break higher to the R93 – R109 box.
___________________________________________________________________________
Account Summary on 1 March 2021
Capital invested R6 500
Current Balance: R4 763.61 -26.71%
Current Equity (Balance including paper P&L): R8 542.37 +31.42%
Current P&L : R3 778.66
As a swing trader the bigger picture is important to me. This is why I like looking at the bigger picture. Looking at the weekly chart. Here are some of the JSE listed stocks stocks I’m currently looking at
Position
No position in the market
The stock is looking good. I got stopped on the recent pullback in profit. However The stock still likes its trending higher. Currently trading in the R591 – R683 box. The stock has been moving nicely for quite some time. I’m currently waiting for a break through R583 on the daily chart. I will then get long the stock and put my stop halfway through the R531 – 683 box.

Position
Everage Entry: R368.66
Quantity: 8
Stop loss: R352.60
The stock is also looking good at the moment. After staying in the R279 – R333 box for about two years. It didn’t stay long in the R333 – R366. Recently the stock broke R366 resistance, and came back to retest this level.
Taking a look at the daily chart. There’s a nice bullish flag pattern.That broke out and retested the flag’s resistance. Providing a nice entry signal to add to my position.
Position
Everage Entry: R181..99
Quantity: 4
Stop loss: R163.95
The stock looks very good. I entered the trade on the break of the cup and handle and the R149 – R177 box. It recently broke to the R178 – R205. Still trading at the bottom of the R178 – R205. There’s a nice combination of bullish chart patterns. Head & Shoulders and Cup & handle. The neckline being. R187. There’s a great deal of wind at the back.
.
Daily chart.
There’s a nice bullish flag on the daily chart. Waiting for a break for the flag and close above the R187 (Neckline of the Head & Shoulders pattern) then I will add to my position.
‘
Position
Everage Entry: R194.67
Quantity: 4
Stop loss: R178.80
A trade that I’m in at the moment as the stock was entering the R186 – R218 Box. The stock is looking good to break in the R218 – R248 box. I’m going to add into the position when it breaks the R218 resistance.

Position
Everage Entry: R51
Quantity: 22.7
Stop loss: R53.04
Glencore breaks into the R59 – 72 box from the R45 -R59 box. I’m going to add to this position at Market open on Monday 22 February 2021. Buying 10.2 more shares. With a stop loss at R53.04.
Position
Everage Entry: R61.66
Quantity: 22.10
Stop loss: R60.89
The company came out with some great results in the week. The stock had quite a good week. It looked like it was breaking to the R70 – R83 box, but came back and closed the week below the R70 resistance. Waiting for the break through R70, then I will add to the position.
Position
Everage Entry: R153.22
Quantity: 10.20
Stop loss: R146.53
The stock is moving very well at the moment. Looked like it was breaking into the R180 – R200 box. I’m waiting for a break through R180 then I will get into my position and pull my stop loss behind me. Perhaps around R167 to start or half way through the R160 – R180 box.

Position
Everage Entry: R47.83
Quantity: 29.70
Stop loss: R43.14
The stock was stuck in the R37 – R44 box. When it broke, the boy did it move. breaking through the 200 week EMA, came back to retest it and it held. I’m now waiting for a break through R51 as it moves to the R51 – R58. I will add into the position then. With a stop loss half way through the R44 – R51, around R47.
Account Summary on 21 February 2021
Capital invested R6 500
Current Balance: 4809.84 -26%
Current Equity (Balance including paper P&L): R7 905.27 +21.62%
Current P&L : R3095.43
The stock broke through the 21600c resistance level. Now I’m waiting for the confirmation, a close above 22000c about 3% higher than the resistance. Taking into account the box theory the share is now moving into 22000c – 25100c box from the 19800c-21600c box.
The stock looks quite strong at the moment. We had a nice bullish engulfing candle last week, and this week’s close is higher than the engulfing candle. I’m looking for a break and close above 13900c. The share looks like it wants to move from 10800c – 13500c box to the 13500c – 16100c box.
The stock has been moving steadily upward moving to higher boxes. At the moment looking good to break the 14750c resistance. Moving to the 14700c – 18600c box from the 10800c – 14700c. I’m waiting for a close above 15000c, then I will add into my position on Aspen.
Clicks looking to break to the 25700c – 28100c box from 23300-25700 box. I’m waiting for a 3% break from the 25700c resistance. Looking for a close above 26400c. I will enter the position and my stop half way through the 23300c-25700 box.
Coronation seems to be making up for spending quite some time in the box 3700c – 4400c.. The stock broke to the 4400c – 5100c box and quickly closed into the 5100c-5800c. I’m waiting for a confirmation, a close above the 5263c, then I will add into my position with a stop half way through the 4400c-5100c box.
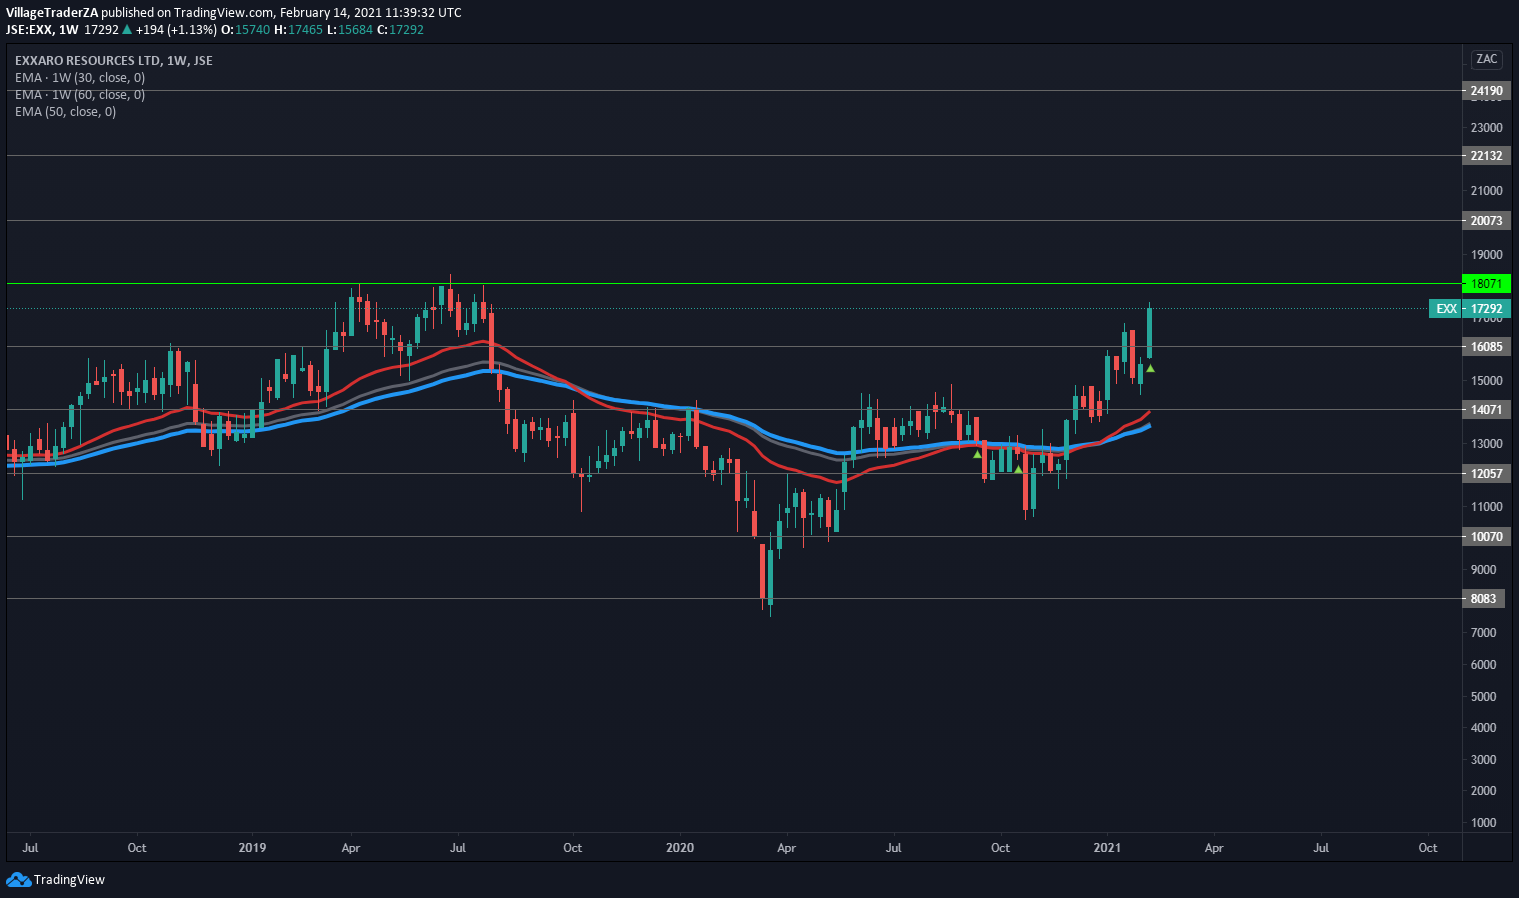
Exxaro looks quite strong at the minute. Breaking into higher boxes with speed and momentum behind. The stock didn’t stay for too long in the 14000c – 16000c box. After it broke from the 12000-14000 box where it stayed for some time. The stock quickly moved to the 16000c – 18000c box. Now I’m waiting for the break through the 180 resistance to add into my position.
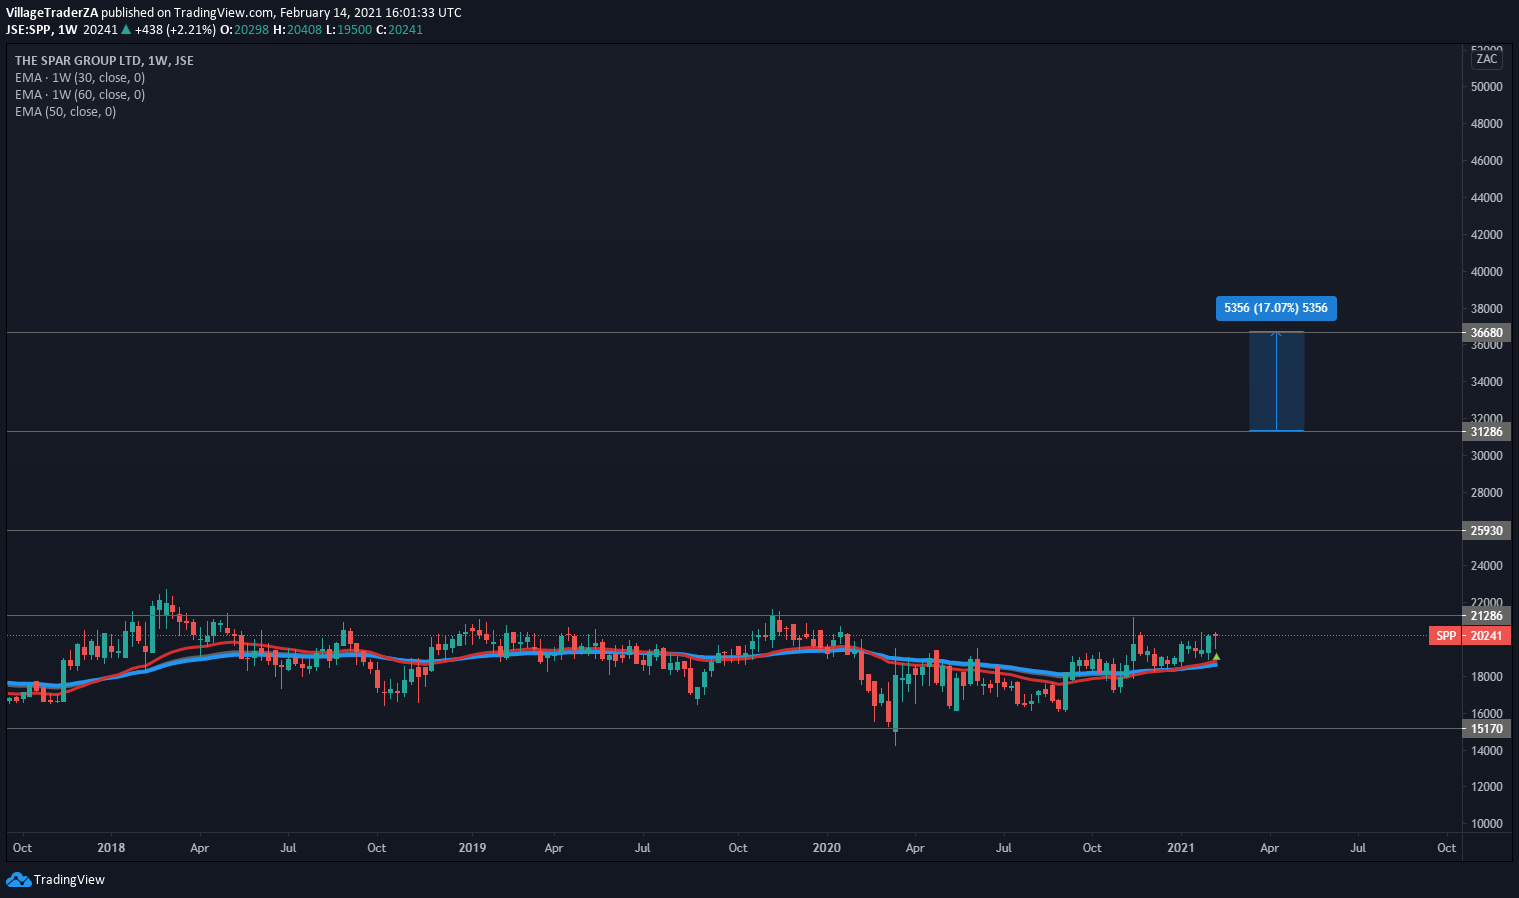
Spar has been in the 15100c – 21200c box for sometime now it has been in the box since 2015. I’m waiting for the break of this range.
Cup and handle/Bullish flag/Head & Shoulders
The stock looked like it was breaking on Friday. However, closed back within the flag/Handle. A nice cup and handle formation on the chart at the moment, which is also a head and shoulders plus a bullish flag. That’s quite some wind behind this trade. A break through 147837c. Confirms the trade for me. Even better above the 152500c.
For now I wait for the break through 147837c
Nice uptrend channel as the stock broke out. On the Head and Shoulders pattern which got me in my initial trade. Seems like the stock has a defined line of least resistance. The stock continuously making higher lows and higher highs. When it breaks through the 16722c and again as it breaks through 17996c. My target for Exxaro remains 21240c for now
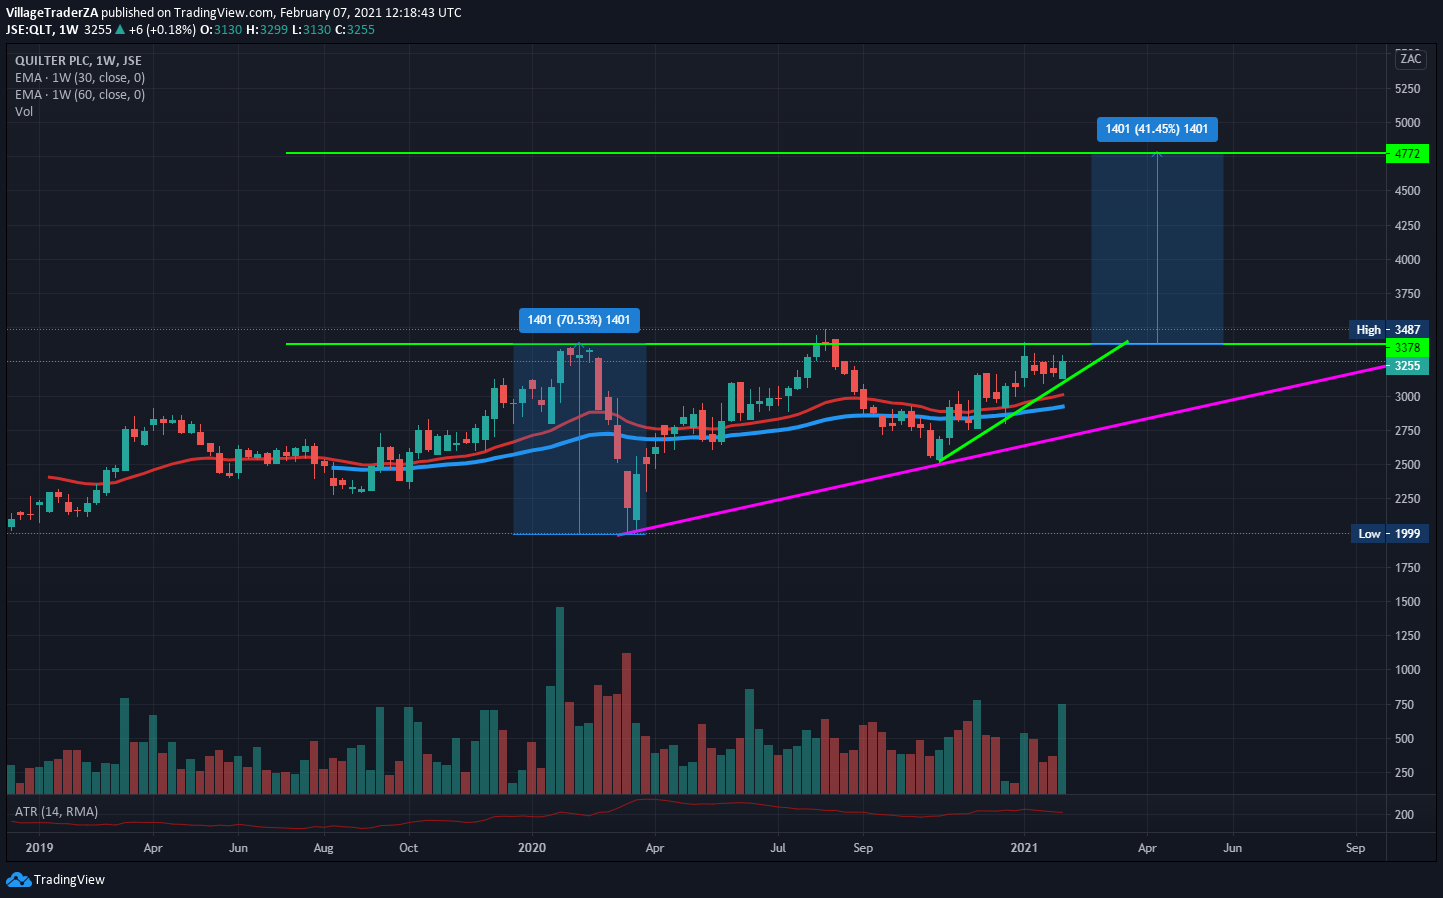
A beautiful ascending triangle pattern on Quilter. Showing an even healthier uprend on the daily chart. With an even steeper support line. I’m looking for a break through 3378c. My target on the stock is 4772c.
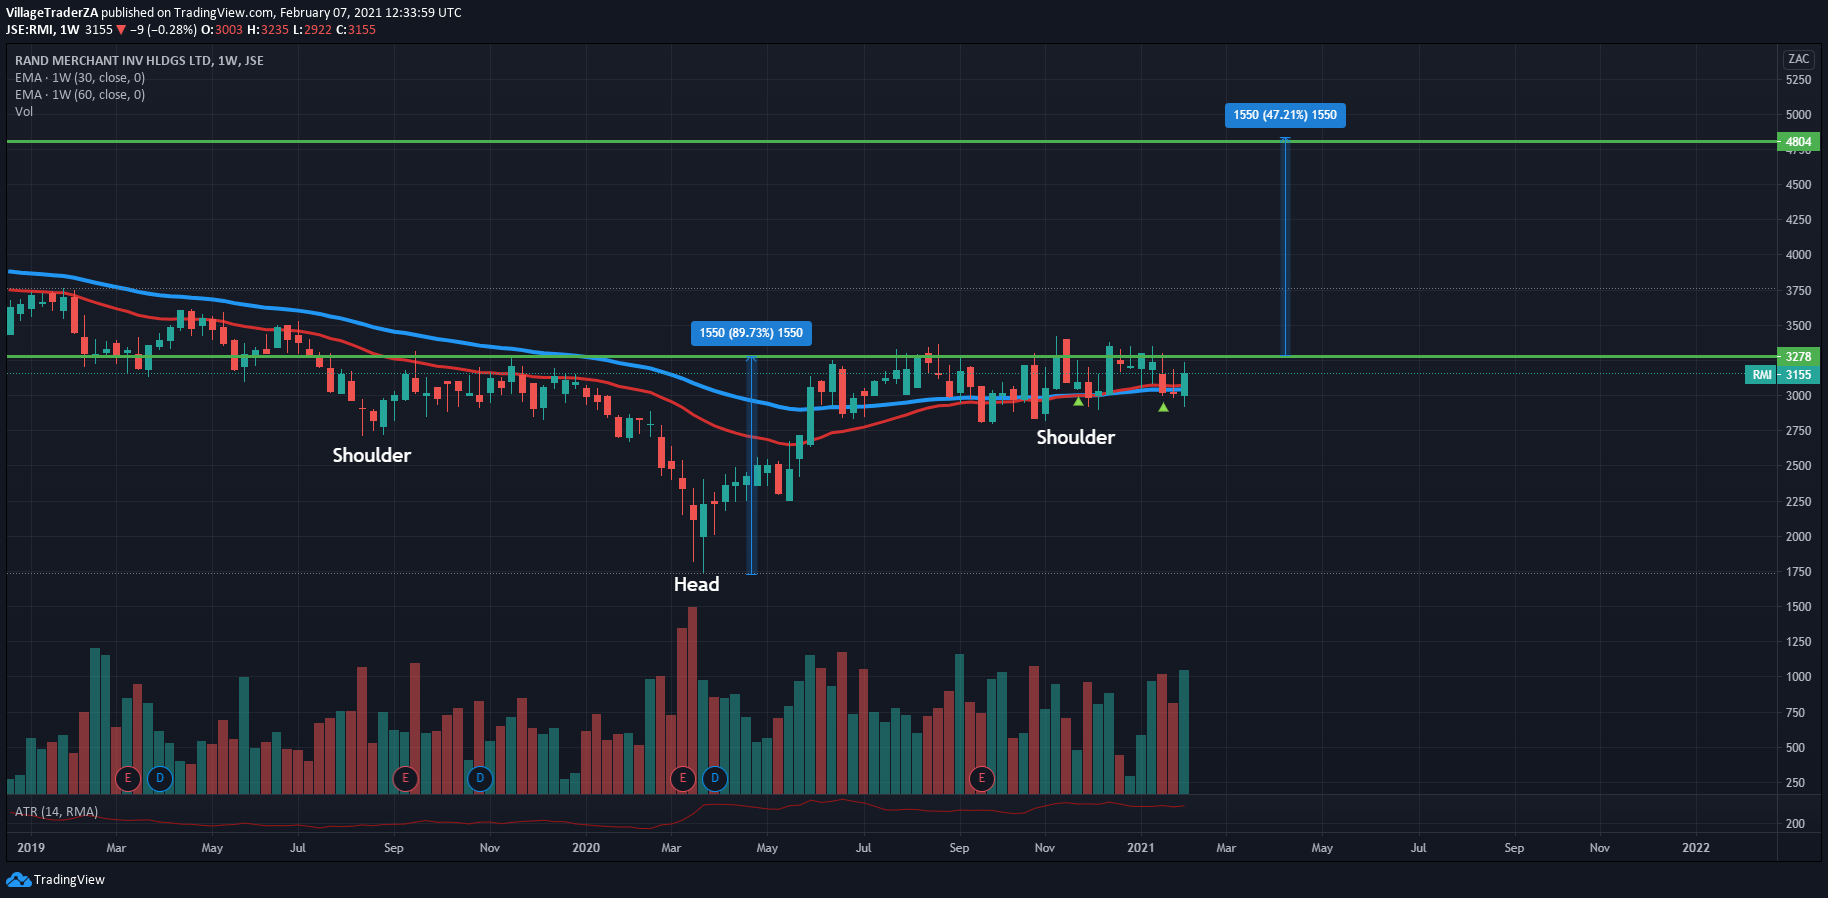
A nice head and shoulders formation on RMI. Ending the past week with a bullish engulfing candle. Waiting for a break through the 3278 neckline. My target for the share is 4800c.
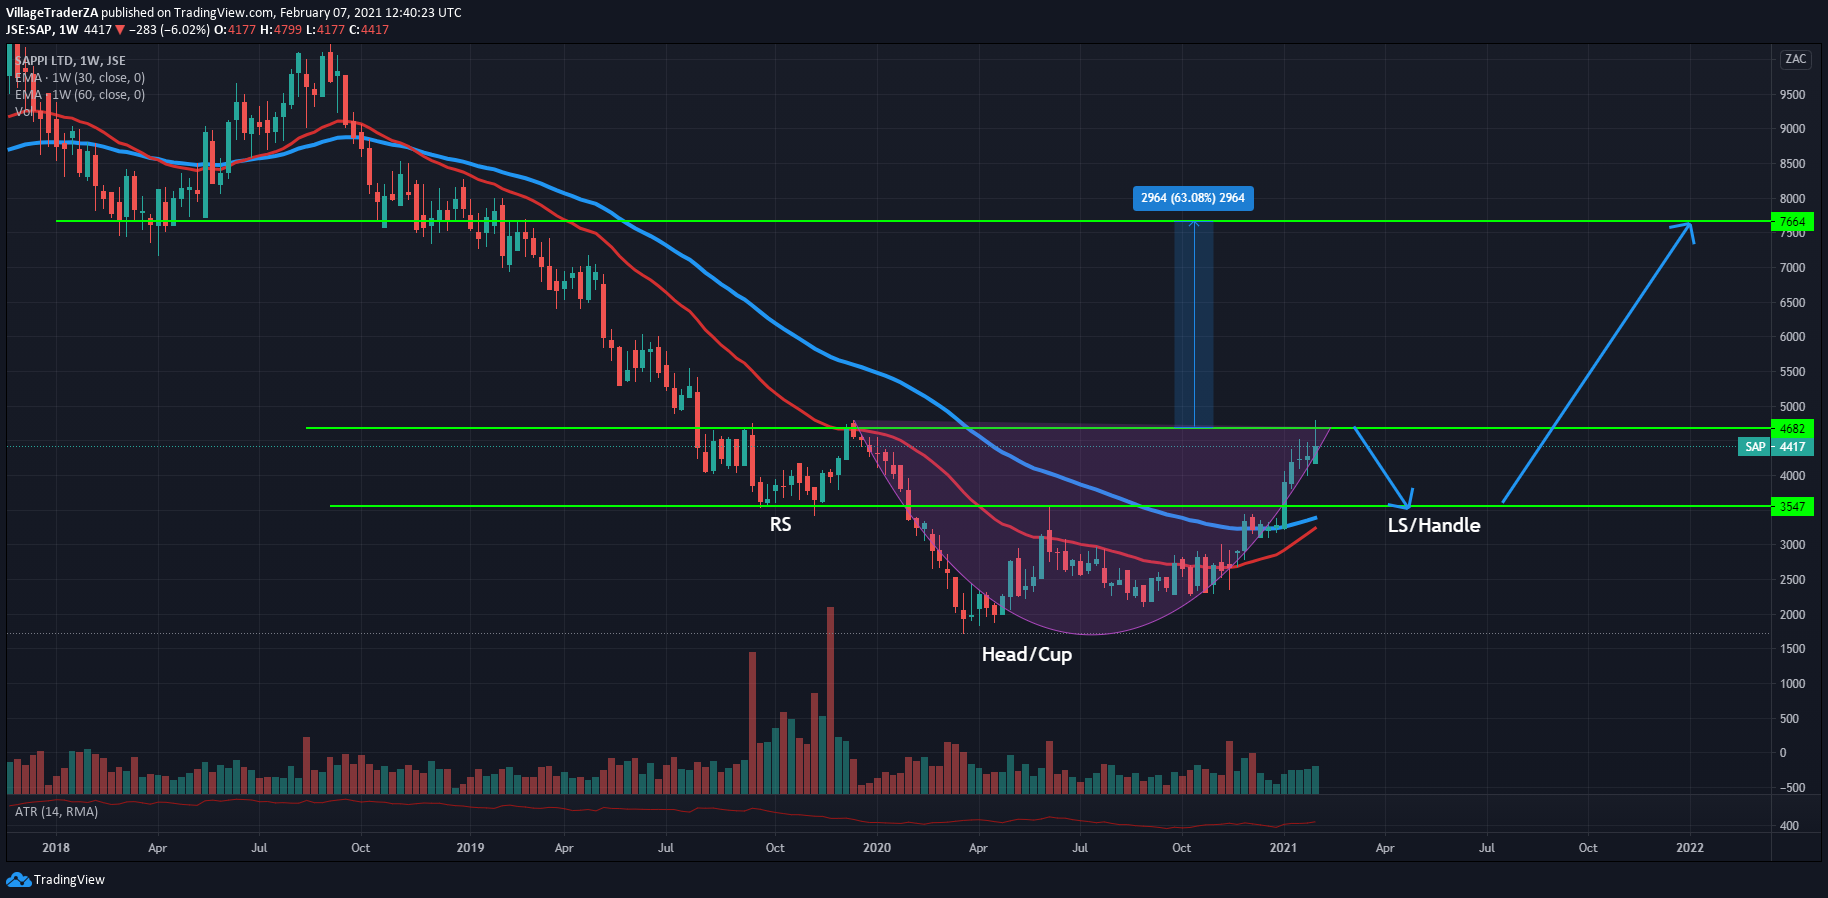
Sappi looks very attractive at the minute. As it break though 4682c resistance. We could see a bit of the reaction first, perhaps on some profit taking. For now i’m waiting for the 30w EMA to cross the 60EMA and for the stock to cross 4682c. Fait bit of volume coming over the past few weeks
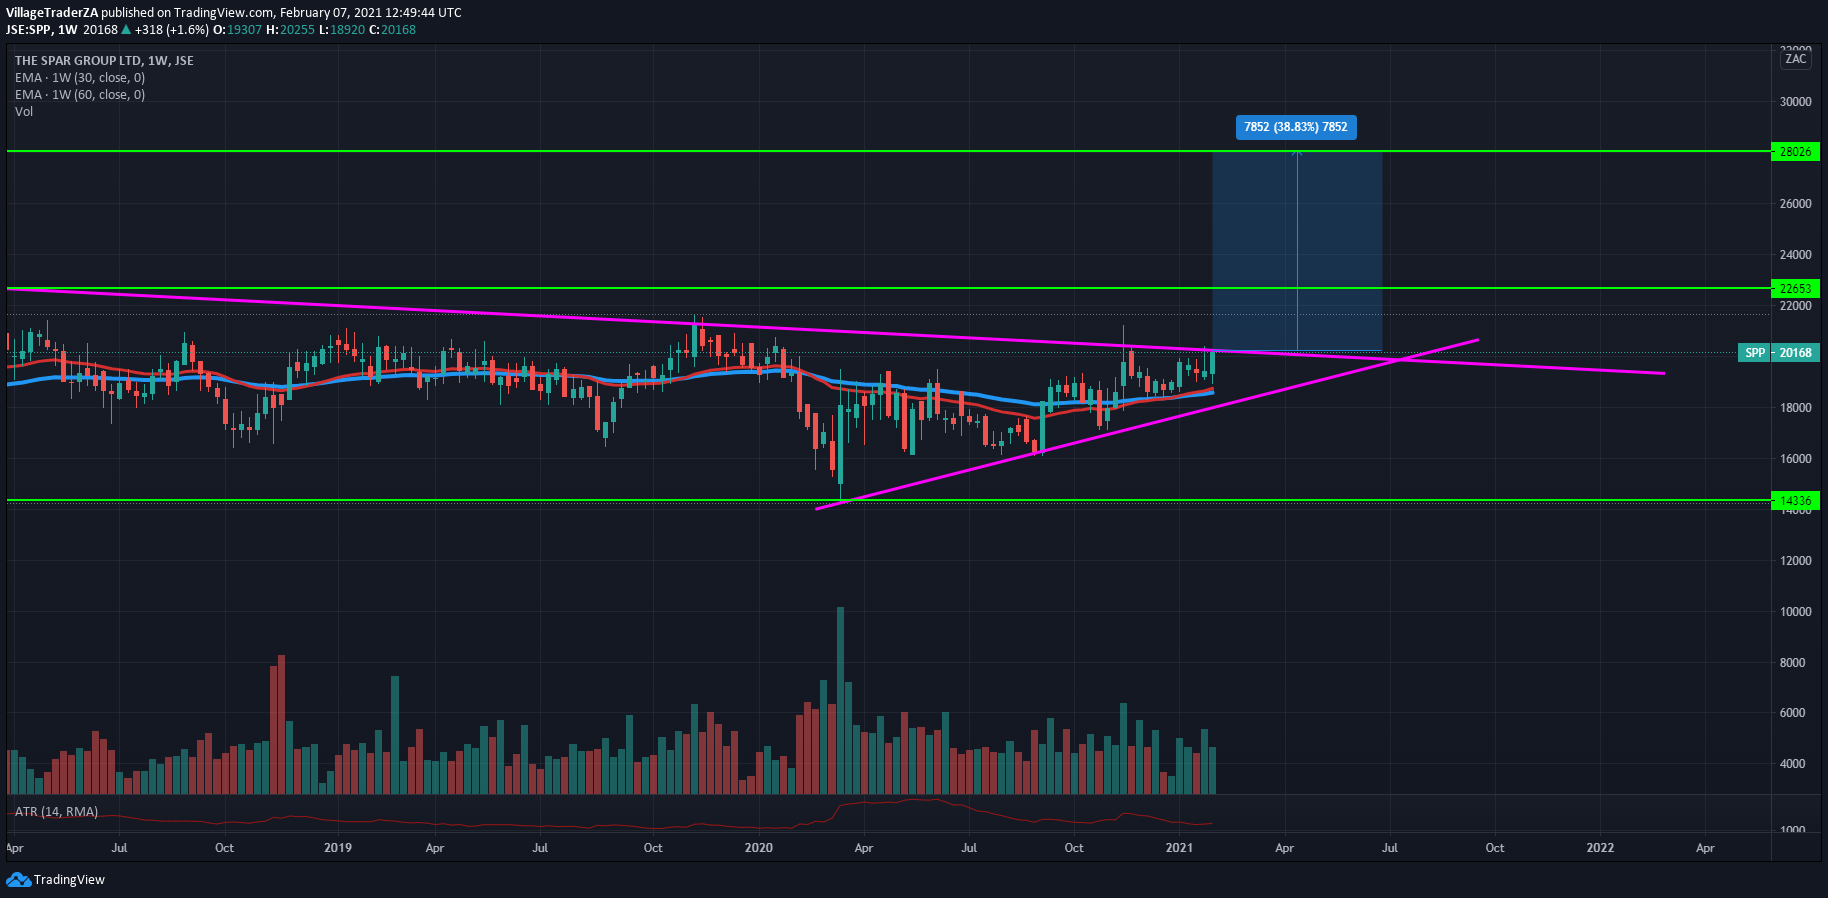
Nice Symmetrical triangle pattern on Spar. The 30w EMA just crossed the 60w EMA. Looking good to break higher. Using the height of the triangle my target for Spar is 28000c. Waiting for a break out through the symmetrical triangle
Nice horizontal bullish flag on bullish flag on Transaction. There seems to be a tug of war of buyers and sellers of the stock between the 2300c-2600c over the past couple of months. This is a trade I’m in. I’m looking for a break above 2600c and I will add into the position.
Healthy looking uptrend channel on Sibanye. Another trade I’m in. Looking to add into the trade when it crosses
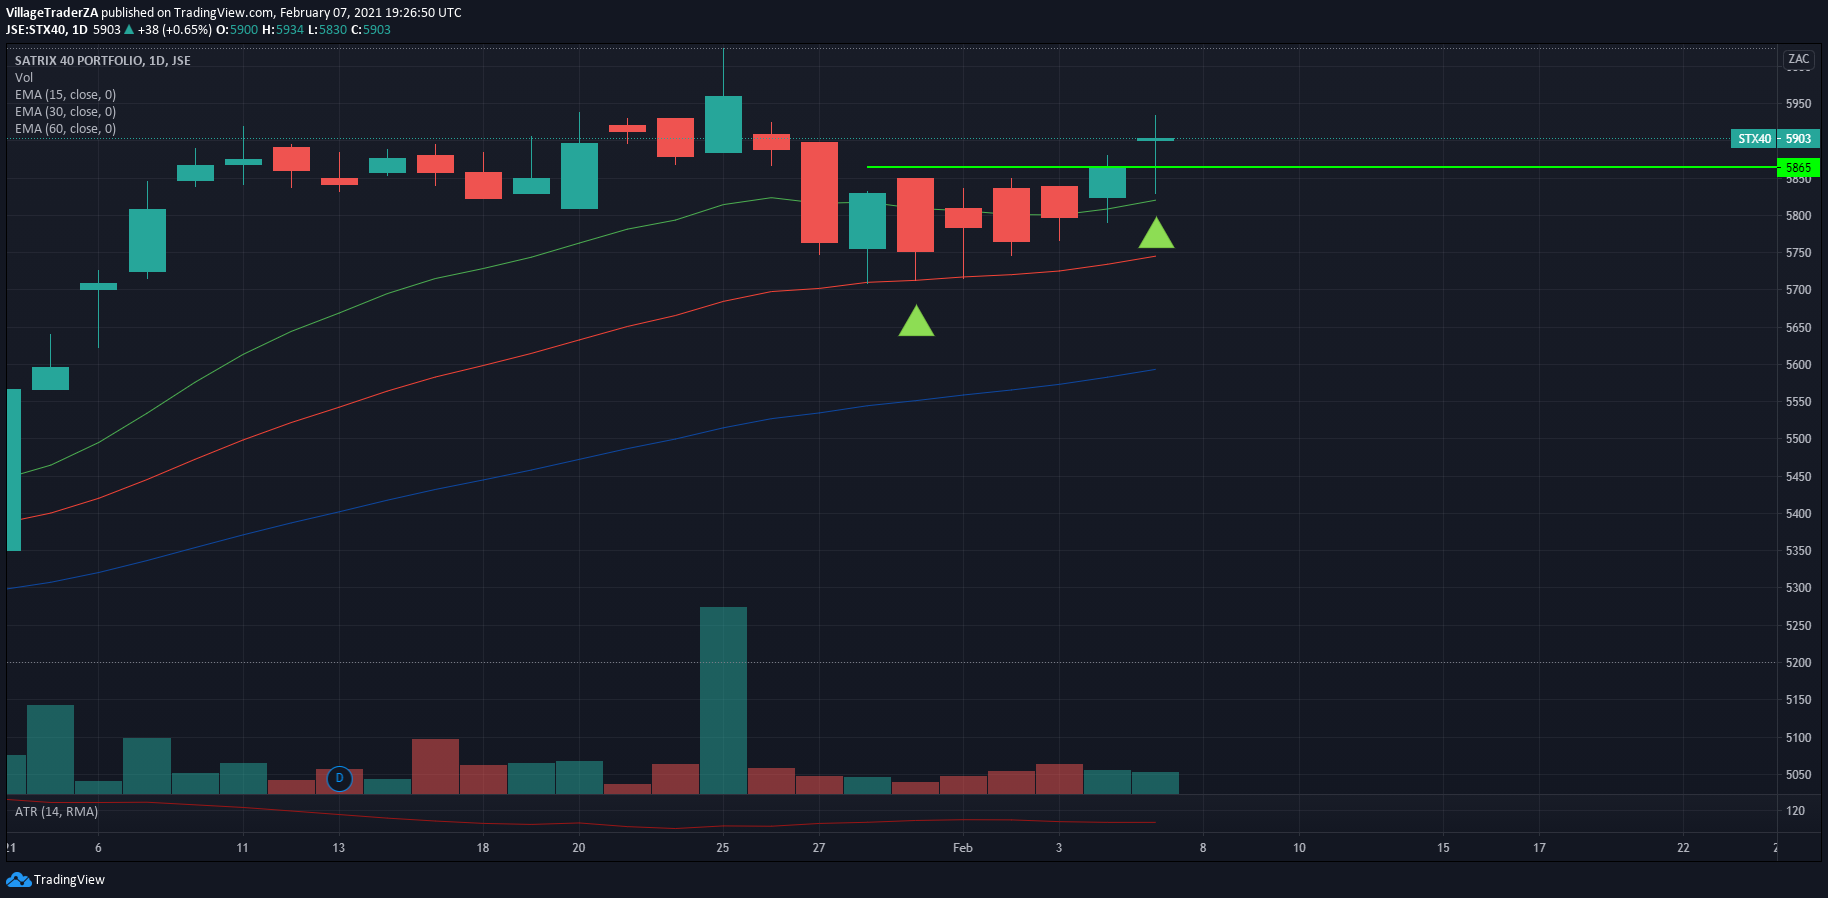
Satrix confirmed on the Lazy system as it closes above the close of the trigger candle.I’m entering long Market open on Monday
Village Trader portfolio update
Equity: 6259.60 up 12.79% from last week’s R5549.70 down -3.7% from capital invested
Floating P/L: 1155.92
Capital invested: R6500
Why I like moving averages
In the market there’s only one truth and that is price. Everything else is just interpretation and/or derivative of price. Each layer of analysis and technical indicators we add to our decision mankind. Takes us further and further away from price. They’re a lot of technical indicators in the market, probably far too many. All of which take prices run them through a mathematical formula to come up with some meaning of what price is doing and/or what it ought to do next.
Amongst technical indicators very few if any come as close to price as moving averages. Of any period for that matter. It’s just that some MA periods have been regarded by the majority of traders in the market to be of more importance than others.
I particularly prefer using exponential moving averages, but this article works just as well with any kind of MA. I use daily charts as merely example every time frame works pretty much the same
For example
5-20 period MA = Short term support/resistance
30-60 period MA = medium term support/resistance
100-200 period MA = long term support/resistance.
You will notice prices change direction more often than not when they get to the these moving averages.
Moving averages can be great indicators of price direction. Either a single MA in relation to price in relation to other moving averages. Like if the price is trading above the 200d MA there’s a high probability that price could move higher. Inversely when the price is below the 200d MA there’s a high probability that price could move lower. Over time.
Moving averages could be used relative to another MA to indicate price direction.For example if the 50d MA is above the 200d you want to be on the long side. Inversely when 50d MA is below the 200d MA you wanna be on the short side. That’s why when these two particular MAs cross, we call that a golden cross. It signals a potential change in direction.
I use MAs to pick a side of the market I want to be in. I use Elder’s triple screen system, Well double screen in my case because I only look at 2 timeframes. I start my analysis on the weekly chart to pick the side of the market I wanna trade along. I look at the 30w EMA in relation to the 60w EMA. To get my primary trend.
30w > 60w EMA =Llong
30w < 60w EMA = Short.
Once I’ve picked the side I want to be in I wait to get a signal in the daily chart in that direction, I ignore signals against the primary trend. For example if the 30w EMA is above the 60w EMA and I get a short signal. I ignore that signal. I would only entertain the long trades.
Another layer I have in my system. Is the 200d EMA. I can only take trades if the 200d EMA is behind me. For example when I’m long I want the 200d EMA to be below price. And vice versa when I’m short, I want it above price.
This strategy takes me out of a lot of trades, but limits me to trades with a bit of wind at the back. Important to note these trade filters aren’t there to eliminate risk or losing trades. You can never eliminate losing trades; they are part of normal business. Their purpose to increase the odds of winning in my favour.
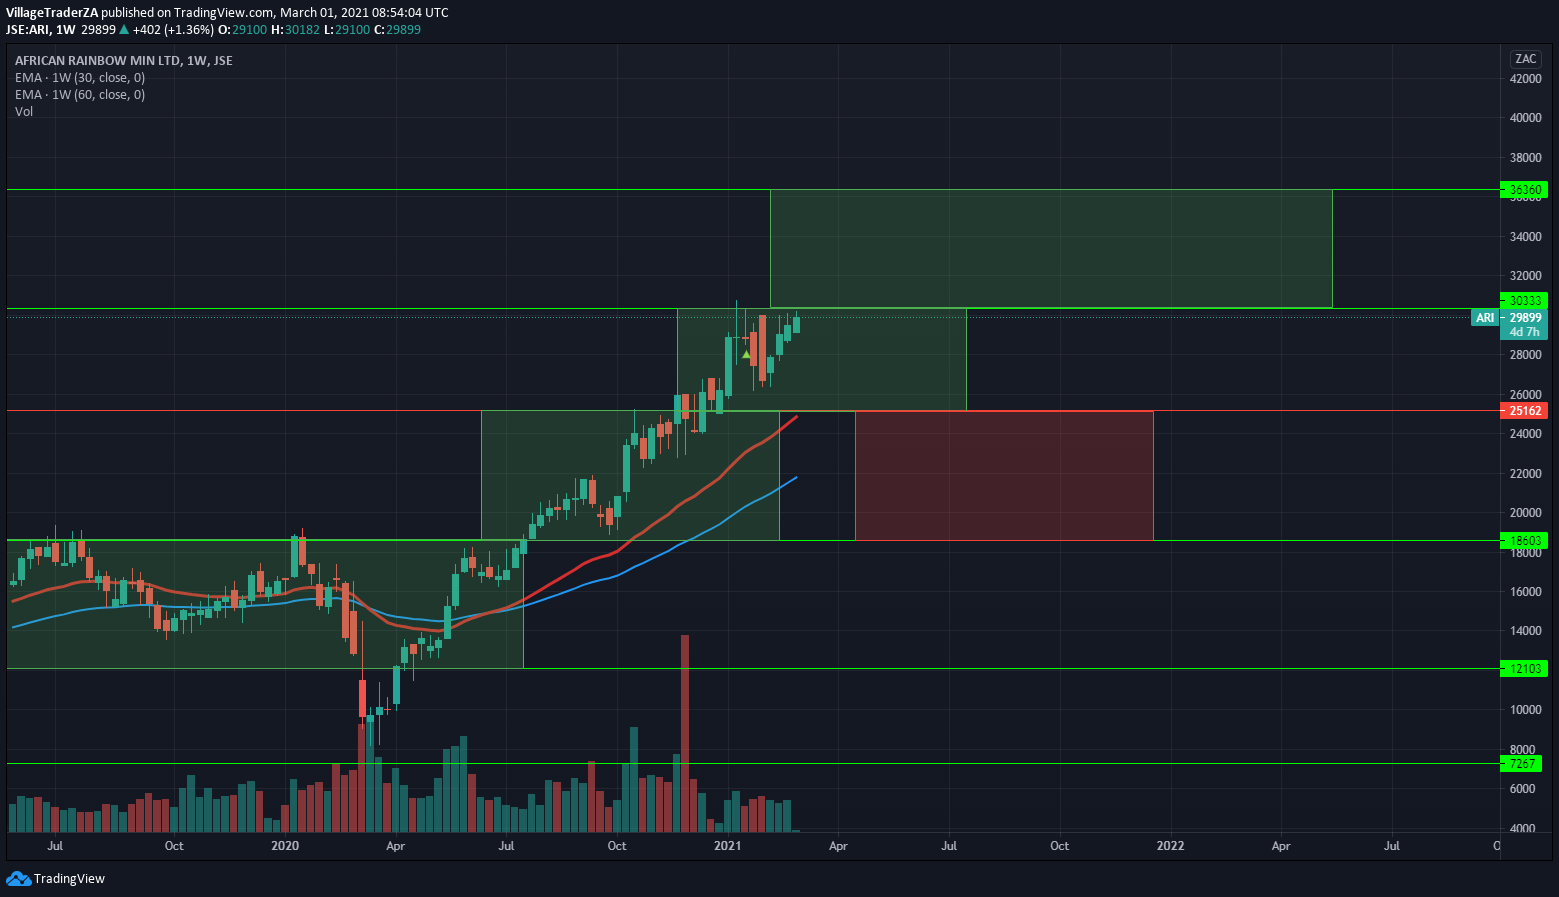
Here’s an example of a trade I took that worked satisfactory. The stock is African Rainbow Minerals
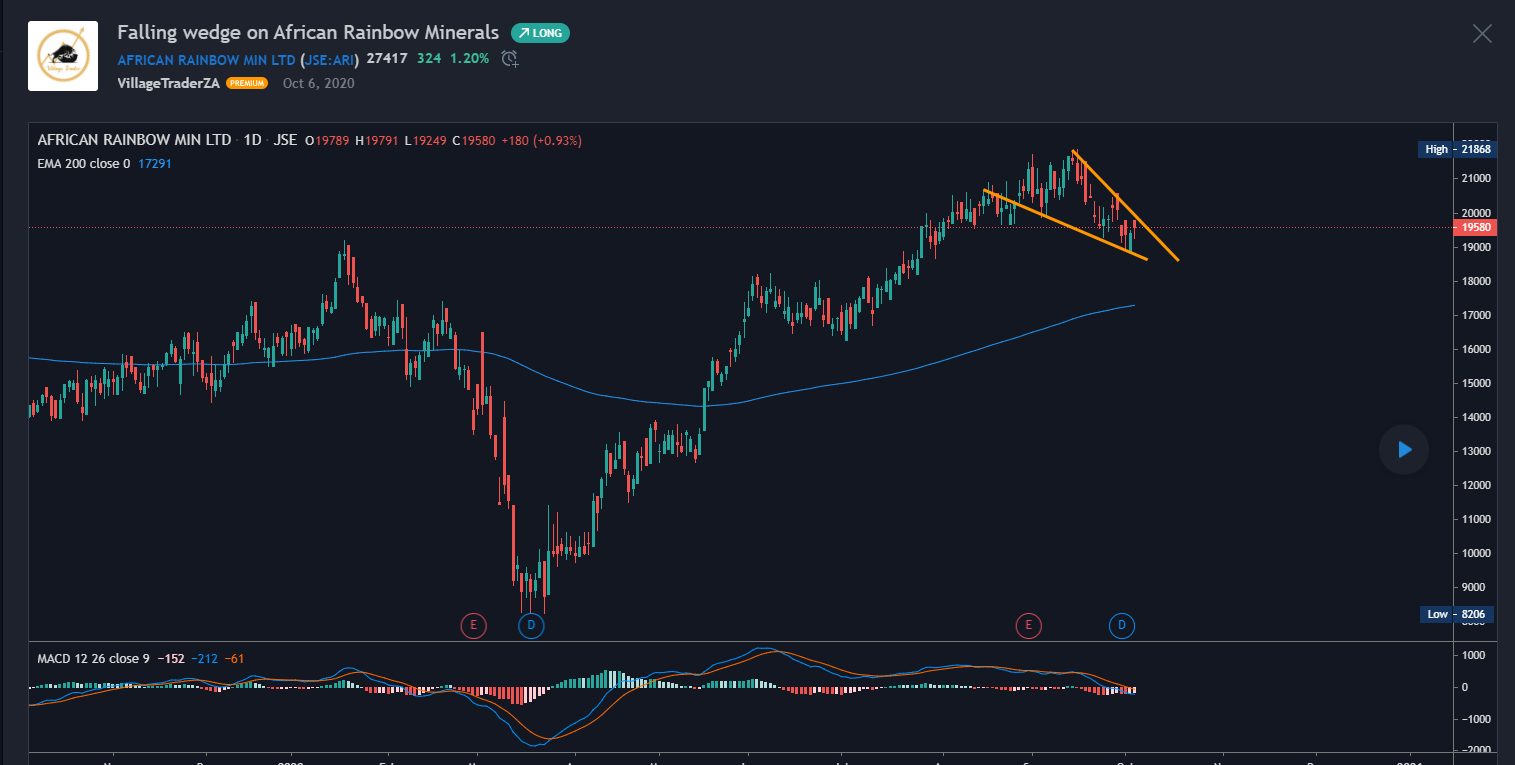
My reason for entry on this stock was a falling wedge as shown in the picture above.
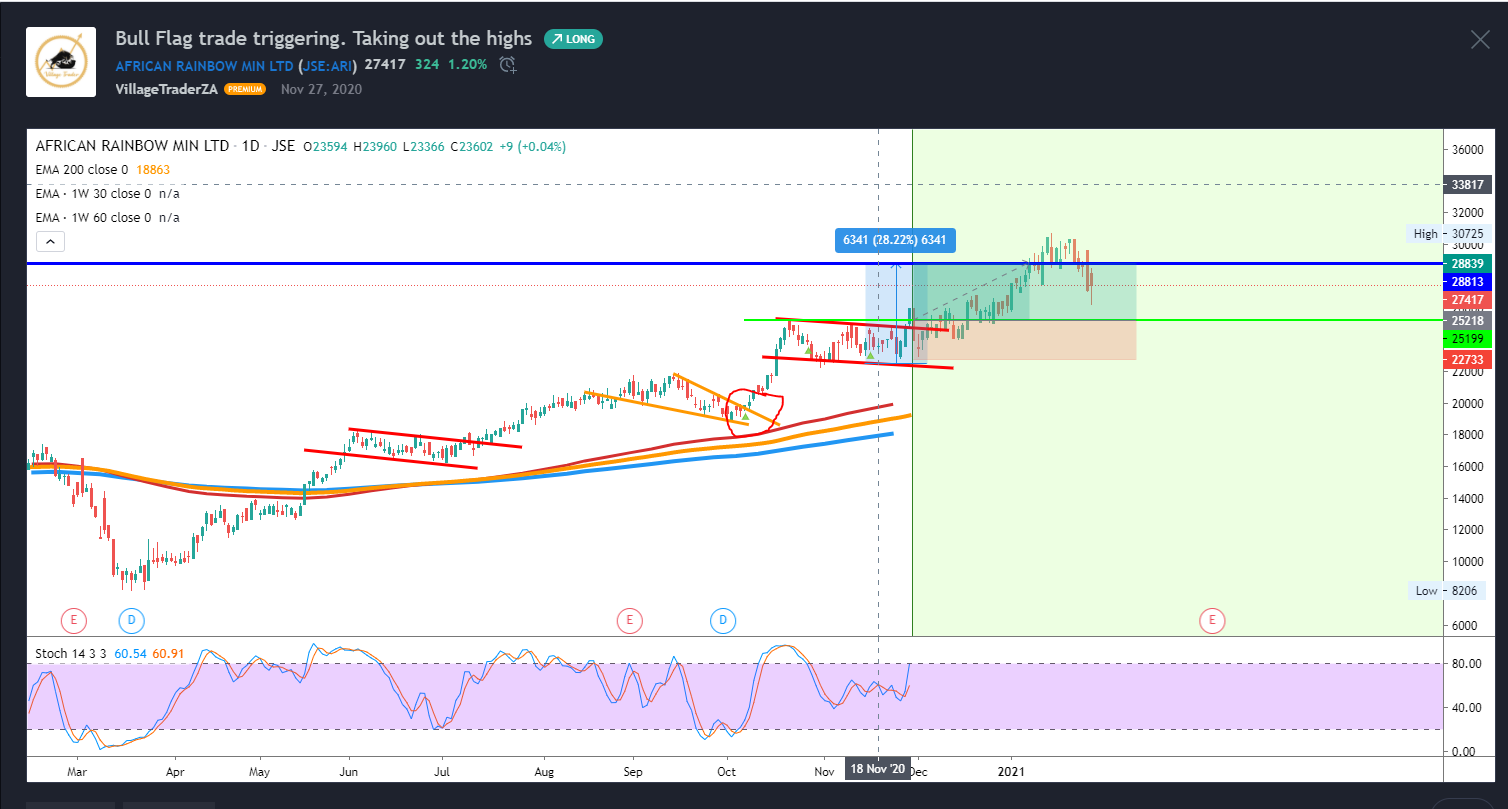
The red circle is when I took the long position. The red EMA is my 30w EMA and the blue one is the 60w EMA, then the yellow one is the 200d EMA. LIke I mentioned earlier. First check the direction.
30w EMA > 60w EMA = Long
200d EMA being me on entry.
I took the trade and added into the position until i got stopped on that last pull back.
Moving averages can also be used as exit points/stop loss. For example a close below a certain MA triggers stop loss exit. Like in the lazy system, a system I trade on ETFs. The system exclusively uses the MAs for both entry and exit. A close below the 30d EMA triggers a my stop loss and I exit the position..
Conclusion
Moving averages can help you to check the direction of the wind, and ultimately trade with the wind at the back. This will improve your hit rate.